Averages for the 2020 tax year for zip code 71060, filed in 2021:
Average Adjusted Gross Income (AGI) in 2020: $47,869 (Individual Income Tax Returns)
Here:
$47,869
State:
$60,757
Salary/wage: $45,131 (reported on 79.7% of returns)
Here:
$45,131
State:
$50,882
(% of AGI for various income ranges: 1010.3% for AGIs below $25k, 3206.5% for AGIs $25k-50k, 6118.6% for AGIs $50k-75k, 9425.7% for AGIs $75k-100k, 21691.4% for AGIs $100k-200k)
Taxable interest for individuals: $336 (reported on 21.2% of returns)
This zip code:
$336
Louisiana:
$1,576
(% of AGI for various income ranges: 4.6% for AGIs below $25k, 4.2% for AGIs $25k-50k, 7.9% for AGIs $50k-75k, 25.7% for AGIs $75k-100k, 38.6% for AGIs $100k-200k)
Ordinary dividends: $3,744 (reported on 7.6% of returns)
Here:
$3,744
State:
$7,743
(% of AGI for various income ranges: 11.4% for AGIs below $25k, 80.0% for AGIs $50k-75k, 261.4% for AGIs $100k-200k)
Net capital gain/loss in AGI: +$6,244 (reported on 7.6% of returns)
Here:
+$6,244
State:
+$16,917
(% of AGI for various income ranges: 7.6% for AGIs below $25k, 114.3% for AGIs $50k-75k, 534.3% for AGIs $100k-200k)
Profit/loss from business: +$3,816 (reported on 16.1% of returns)
Here:
+$3,816
State:
+$7,679
(% of AGI for various income ranges: 113.8% for AGIs below $25k, 119.3% for AGIs $50k-75k, 317.1% for AGIs $75k-100k)
Taxable individual retirement arrangement distribution: $10,925 (reported on 6.8% of returns)
71060:
$10,925
Louisiana:
$20,716
(% of AGI for various income ranges: 139.2% for AGIs $25k-50k, 731.4% for AGIs $75k-100k)
Total itemized deductions: $29,600 (reported on 1.7% of returns)
Here:
$29,600
State:
$36,265
(% of AGI for various income ranges: 227.7% for AGIs $25k-50k)
Taxes paid: $5,200 (reported on 1.7% of returns)
71060:
$5,200
State:
$6,643
(% of AGI for various income ranges: 40.0% for AGIs $25k-50k)
Earned income credit: $2,411 (reported on 22.9% of returns)
Here:
$2,411
State:
$2,671
(% of AGI for various income ranges: 119.2% for AGIs below $25k, 80.8% for AGIs $25k-50k)
Percentage of individuals using paid preparers for their 2020 taxes: 94.1%
Here:
94%
State:
92%
(% for various income ranges: 93.5% for AGIs below $25k, 93.3% for AGIs $25k-50k, 94.4% for AGIs $50k-75k, 100.0% for AGIs $75k-100k, 92.9% for AGIs $100k-200k)
Averages for the 2012 tax year for zip code 71060, filed in 2013:
Average Adjusted Gross Income (AGI) in 2012: $46,374 (Individual Income Tax Returns)
Here:
$46,374
State:
$56,730
Salary/wage: $43,428 (reported on 83.3% of returns)
Here:
$43,428
State:
$45,545
(% of AGI for various income ranges: 73.6% for AGIs below $25k, 82.0% for AGIs $25k-50k, 83.6% for AGIs $50k-75k, 80.2% for AGIs $75k-100k, 73.1% for AGIs $100k-200k)
Taxable interest for individuals: $407 (reported on 24.2% of returns)
This zip code:
$407
Louisiana:
$1,804
(% of AGI for various income ranges: 0.5% for AGIs below $25k, 0.2% for AGIs $25k-50k, 0.2% for AGIs $50k-75k, 0.2% for AGIs $75k-100k, 0.2% for AGIs $100k-200k)
Ordinary dividends: $2,217 (reported on 10.0% of returns)
Here:
$2,217
State:
$7,610
(% of AGI for various income ranges: 0.7% for AGIs below $25k, 0.6% for AGIs $25k-50k, 1.2% for AGIs $50k-75k, 0.2% for AGIs $100k-200k)
Net capital gain/loss in AGI: +$1,838 (reported on 6.7% of returns)
Here:
+$1,838
State:
+$17,096
(% of AGI for various income ranges: 1.0% for AGIs $100k-200k)
Profit/loss from business: +$7,038 (reported on 17.5% of returns)
Here:
+$7,038
State:
+$12,088
(% of AGI for various income ranges: 7.4% for AGIs below $25k, 2.8% for AGIs $25k-50k, 1.5% for AGIs $75k-100k, 2.9% for AGIs $100k-200k)
Taxable individual retirement arrangement distribution: $11,512 (reported on 6.7% of returns)
71060:
$11,512
Louisiana:
$16,085
(% of AGI for various income ranges: 2.1% for AGIs below $25k, 1.5% for AGIs $25k-50k, 5.9% for AGIs $75k-100k)
Total itemized deductions: $21,309 (24% of AGI, reported on 18.3% of returns)
Here:
$21,309
State:
$23,585
Here:
23.7% of AGI
State:
18.1% of AGI
(% of AGI for various income ranges: 4.3% for AGIs below $25k, 5.6% for AGIs $25k-50k, 8.4% for AGIs $50k-75k, 10.2% for AGIs $75k-100k, 10.6% for AGIs $100k-200k)
Charity contributions: $4,900 (reported on 13.3% of returns)
Here:
$4,900
State:
$5,533
(% of AGI for various income ranges: 1.5% for AGIs $25k-50k, 1.2% for AGIs $50k-75k, 1.5% for AGIs $75k-100k, 1.9% for AGIs $100k-200k)
Taxes paid: $4,168 (reported on 18.3% of returns)
71060:
$4,168
State:
$6,282
(% of AGI for various income ranges: 0.3% for AGIs below $25k, 0.8% for AGIs $25k-50k, 1.2% for AGIs $50k-75k, 1.6% for AGIs $75k-100k, 2.9% for AGIs $100k-200k)
Earned income credit: $2,321 (reported on 24.2% of returns)
Here:
$2,321
State:
$2,633
(% of AGI for various income ranges: 8.1% for AGIs below $25k, 1.4% for AGIs $25k-50k)
Percentage of individuals using paid preparers for their 2012 taxes: 56.7%
Here:
57%
State:
57%
(% for various income ranges: 53.1% for AGIs below $25k, 51.6% for AGIs $25k-50k, 56.2% for AGIs $50k-75k, 58.3% for AGIs $75k-100k, 83.3% for AGIs $100k-200k)
Averages for the 2004 tax year for zip code 71060, filed in 2005:
Average Adjusted Gross Income (AGI) in 2004: $34,921 (Individual Income Tax Returns)
Here:
$34,921
State:
$39,411
Salary/wage: $32,960 (reported on 87.0% of returns)
Here:
$32,960
State:
$34,434
(% of AGI for various income ranges: 82.4% for AGIs below $10k, 80.1% for AGIs $10k-25k, 85.9% for AGIs $25k-50k, 80.9% for AGIs $50k-75k, 91.8% for AGIs $75k-100k, 66.9% for AGIs over 100k)
Taxable interest for individuals: $972 (reported on 28.0% of returns)
This zip code:
$972
Louisiana:
$1,606
(% of AGI for various income ranges: 0.8% for AGIs below $10k, 1.3% for AGIs $10k-25k, 0.8% for AGIs $25k-50k, 0.8% for AGIs $50k-75k, 0.3% for AGIs $75k-100k, 0.5% for AGIs over 100k)
Taxable dividends: $1,130 (reported on 12.2% of returns)
Here:
$1,130
State:
$3,235
(% of AGI for various income ranges: 0.6% for AGIs below $10k, 0.5% for AGIs $10k-25k, 0.4% for AGIs $25k-50k, 0.5% for AGIs $50k-75k, 0.1% for AGIs $75k-100k, 0.4% for AGIs over 100k)
Net capital gain/loss: +$976 (reported on 7.5% of returns)
Here:
+$976
State:
+$8,531
(% of AGI for various income ranges: -0.2% for AGIs $10k-25k, 0.1% for AGIs $25k-50k, -0.2% for AGIs $50k-75k, 1.7% for AGIs $75k-100k)
Profit/loss from business: +$2,306 (reported on 13.0% of returns)
Here:
+$2,306
State:
+$9,128
(% of AGI for various income ranges: 7.2% for AGIs below $10k, 2.9% for AGIs $10k-25k, 0.5% for AGIs $25k-50k, 0.2% for AGIs $50k-75k)
IRA payment deduction: $2,900 (reported on 0.9% of returns)
71060:
$2,900
Louisiana:
$3,055
Total itemized deductions: $15,271 (26% of AGI, reported on 20.8% of returns)
Here:
$15,271
State:
$18,222
Here:
25.5% of AGI
State:
20.3% of AGI
(% of AGI for various income ranges: 6.8% for AGIs $10k-25k, 9.2% for AGIs $25k-50k, 8.9% for AGIs $50k-75k, 11.3% for AGIs $75k-100k, 11.1% for AGIs over 100k)
Charity contributions deductions: $3,331 (5% of AGI, reported on 16.0% of returns)
Here:
$3,331
State:
$4,190
Here:
5.4% of AGI
State:
4.4% of AGI
(% of AGI for various income ranges: 1.4% for AGIs $10k-25k, 1.6% for AGIs $25k-50k, 1.4% for AGIs $50k-75k, 2.0% for AGIs $75k-100k, 1.4% for AGIs over 100k)
Total tax: $3,915 (reported on 70.6% of returns)
71060:
$3,915
State:
$6,529
(% of AGI for various income ranges: 2.1% for AGIs below $10k, 3.1% for AGIs $10k-25k, 5.6% for AGIs $25k-50k, 8.4% for AGIs $50k-75k, 10.7% for AGIs $75k-100k, 15.6% for AGIs over 100k)
Earned income credit: $1,870 (reported on 25.7% of returns)
Here:
$1,870
State:
$2,103
Percentage of individuals using paid preparers for their 2004 taxes: 62.2%
Here:
62%
State:
61%
(% for various income ranges: 55.6% for AGIs below $10k, 65.3% for AGIs $10k-25k, 59.5% for AGIs $25k-50k, 62.7% for AGIs $50k-75k, 66.2% for AGIs $75k-100k, 78.4% for AGIs over 100k)
Household received Food Stamps/SNAP in the past 12 months: 141 Household did not receive Food Stamps/SNAP in the past 12 months: 880
Women who had a birth in the past 12 months: 13 (9 now married, 3 unmarried) Women who did not have a birth in the past 12 months: 420 (186 now married, 232 unmarried)
Housing units in zip code 71060 with a mortgage: 361 (47 second mortgage, 36 both second mortgage and home equity loan) Houses without a mortgage: 18
Median monthly owner costs for units with a mortgage: $1,096 Median monthly owner costs for units without a mortgage: $349
Residents with income below the poverty level in 2022:
This zip code:
18.8%
Whole state:
18.6%
Residents with income below 50% of the poverty level in 2022:
This zip code:
4.3%
Whole state:
10.1%
Median number of rooms in houses and condos:
Here:
5.4
State:
6.2
Median number of rooms in apartments:
Here:
5.2
State:
4.4
Notable locations in this zip code not listed on our city pages
Churches in zip code 71060 include: Baptist Temple (A), Shiloh Baptist Church (B), Republican Baptist Church (C), Saint Paul Baptist Church (D), Mount Olive Church (E), Mooringsport United Methodist Church (F), Mooringsport Baptist Church (G). Display/hide their locations on the map
Streams, rivers, and creeks: Gardener Bayou (A), Big Cypress Bayou (B), Walnut Bayou (C), Tete Bayou (D), Miller Branch (E), Jeter Branch (F). Display/hide their locations on the map
Size of family households: 395 2-persons, 164 3-persons, 124 4-persons, 1 5-persons, 19 6-persons, 3 7-or-more-persons
Size of nonfamily households: 294 1-person, 19 2-persons, 5 5-persons
128 married couples with children.
323 single-parent households (102 men, 221 women).
100.0% of residents of 71060 zip code speak English at home.
0.3% of residents speak other Indo-European language at home (100% well).
0.1% of residents speak Asian or Pacific Island language at home (100% well).
Foreign born population: 0 (0.0%)
:
0.0%
Whole state:
4.2%
26%American
17%Irish
7%English
6%German
3%Scottish
2%Portuguese
2%Dutch
Major facilities with environmental interests located in this zip code:
ATHENS CADDO BRICK (8469 BARNETTE RD. in MOORINGSPORT, LA)
AIR MINOR (AIRS/AFS) ENFORCEMENT/COMPLIANCE ACTIVITY (Integrated Compliance Information System) - ICIS-06-2004-0511, FORMAL ENFORCEMENT ACTION (Integrated Compliance Information System) - ICIS-06-2004-0511, FORMAL ENFORCEMENT ACTION COMPLIANCE ACTIVITY (Tracking inspections of insecticide, fungicide, and rodenticide, and toxic substances) CRITERIA AND HAZARDOUS AIR POLLUTANT INVENTORY (Inventory of air pollution sources) National Pollutant Discharge Elimination System NON-MAJOR (Tracking pollutant discharge elimination systems) - permit Conditionally Exempt Small Quantity Generators, less than 100 kg/month of hazardous waste (Resource Conservation and Recovery Act (tracking hazardous waste)) - notification TRI REPORTER (Tracking of toxic chemicals releasing facilities) Business SIC classification: CONSTRUCTION SAND AND GRAVEL; BRICK AND STRUCTURAL CLAY TILE Business NAICS classification: BRICK AND STRUCTURAL CLAY TILE MANUFACTURING.; BRICK AND STRUCTURAL CLAY TILE MANUFACTURING. Organizations: TXI (CONTACT/OPERATOR)
, ATHENS CADDO BRICK CO (CONTACT/OWNER)
Alternative names: ATHENS BRICK CO, ATHENS MOORINGSPORT, HANSON BRICK CADDO PLANT, KEVIN R FARLEY, TEXAS INDUSTRIES, TXI OPERATIONS, LP
MOORINGSPORT ELEMENTARY SCHOOL (602 LATIMER STREET in MOORINGSPORT, LA)
(National Center for Education Statistics) - STATE ID-009040 Organizations: CADDO PARISH SCHOOL BOARD (SCHOOL DISTRICT)
MOORINGSPORT WATER SYS (PO BOX 9 in MOORINGSPORT, LA)
(Integrated Compliance Information System) - ICIS-06-2000-0653, FORMAL ENFORCEMENT ACTION Business SIC classification: WATER SUPPLY
A C MITCHELL 20-2 PRODUCTION FACILITY - (OFF HWY 169, 11 MI SW OF in MOORINGSPORT, LA)
AIR MINOR (AIRS/AFS) Business SIC classification: CRUDE PETROLEUM AND NATURAL GAS Alternative names: A C MITCHELL 20-1 PRODUCTION FACILITY -
NOEL ESTATE 11 #1 FACILITY - LONGWOOD FI (HWY 169 W 2.8 MI SW OF in MOORINGSPORT, LA)
AIR MINOR (AIRS/AFS) Business SIC classification: CRUDE PETROLEUM AND NATURAL GAS
EAST MOORINGSPORT W. S. (122 CROOM ST in MOORINGSPORT, LA)
National Pollutant Discharge Elimination System NON-MAJOR (Tracking pollutant discharge elimination systems) - permit COMMUNITY WATER SYSTEM (SDWIS) Business SIC classification: SEWERAGE SYSTEMS Alternative names: MOORINGSPORT, TOWN OF, TOWN OF MOORINGSPORT
A C MITCHELL 17-1 PRODUCTION FACILITY - (OFF HWY 169, 10 MI SW OF in MOORINGSPORT, LA)
AIR MINOR (AIRS/AFS) Business SIC classification: CRUDE PETROLEUM AND NATURAL GAS
A C MITCHELL 8-1 PRODUCTION FACILITY - L (OFF HWY 169, 9 MI SW OF in MOORINGSPORT, LA)
AIR MINOR (AIRS/AFS) Business SIC classification: CRUDE PETROLEUM AND NATURAL GAS
MOORINGSPORT WTF (122 CROOM ST in MOORINGSPORT, LA)
National Pollutant Discharge Elimination System NON-MAJOR (Tracking pollutant discharge elimination systems) - permit Business SIC classification: COMBINATION UTILITIES
NOEL ESTATE 11 #2 FACILITY - LONGWOOD FI (HWY 169 E 2 MI SW OF in MOORINGSPORT, LA)
AIR MINOR (AIRS/AFS) Business SIC classification: CRUDE PETROLEUM AND NATURAL GAS
NOEL ESTATE 16 #1 PRODUCTION FACILTY - E (MOORINGSPORT-LATEX RD, 5 MI SW in MOORINGSPORT, LA)
AIR MINOR (AIRS/AFS) Business SIC classification: CRUDE PETROLEUM AND NATURAL GAS
PINEY WOODS HUNTING CLUB (CADDO LEASE ROAD in MOORINGSPORT, LA)
National Pollutant Discharge Elimination System NON-MAJOR (Tracking pollutant discharge elimination systems) - permit
GEMINI EXPLORATIONS (E FLOWLINE in MOORINGSPORT, LA)
National Pollutant Discharge Elimination System NON-MAJOR (Tracking pollutant discharge elimination systems) - permit
Housing units lacking complete plumbing facilities: 5.0% Housing units lacking complete kitchen facilities: 6.5%
63.7%Electricity
29.8%Utility gas
3.3%No fuel used
2.3%Bottled, tank, or LP gas
1.2%Wood
Population in 1990: 2,838.
Place of birth for U.S.-born residents:
This state: 1,772
Northeast: 33
Midwest: 142
South: 383
West: 60
58% of the 71060 zip code residents lived in the same house 5 years ago. Out of people who lived in different houses, 77% lived in this county. Out of people who lived in different counties, 50% lived in Louisiana.
91% of the 71060 zip code residents lived in the same house 1 year ago. Out of people who lived in different houses, 89% moved from this county. Out of people who lived in different houses, 2% moved from different county within same state. Out of people who lived in different houses, 6% moved from different state.
Private vs. public school enrollment:
Students in private schools in grades 1 to 8 (elementary and middle school):
Here:
0.0%
Louisiana:
19.6%
Students in private schools in grades 9 to 12 (high school): 37
Here:
32.9%
Louisiana:
18.3%
Students in private undergraduate colleges:
Here:
0.0%
Louisiana:
17.4%
Occupation by median earnings in the past 12 months ($)
107,052Construction and extraction occupations
77,235Management occupations
73,518Health diagnosing and treating practitioners and other technical occupations
58,046Production occupations
54,177Transportation occupations
51,924Education, training, and library occupations
Top industries in this zip code by the number of employees in 2005:
Mining: Support Activities for Oil and Gas Operations (20-49 employees: 1 establishment, 1-4 employees: 1 establishment)
Utilities: Electric Power Distribution (20-49: 1)
Other Services (except Public Administration): Religious Organizations (5-9: 1, 1-4: 1)
Construction: Poured Concrete Foundation and Structure Contractors (5-9: 1)
Construction: New Single-Family Housing Construction (except Operative Builders) (5-9: 1)
Other Services (except Public Administration): Pet Care (except Veterinary) Services (1-4: 2)
Administrative and Support and Waste Management and Remediation Services: Landscaping Services (1-4: 1)
Fatal accident statistics in 2013:
Fatal accident count: 1
Vehicles involved in fatal accidents: 1
Fatal accidents caused by drunken drivers: 0
Fatalities: 1
Persons involved in fatal accidents: 2
Pedestrians involved in fatal accidents: 1
Fatal accident statistics in 2012:
Fatal accident count: 1
Vehicles involved in fatal accidents: 1
Fatal accidents caused by drunken drivers: 0
Fatalities: 1
Persons involved in fatal accidents: 1
Pedestrians involved in fatal accidents: 0
Home Mortgage Disclosure Act Aggregated Statistics For Year 2009 (Based on 2 partial tracts)
A) FHA, FSA/RHS & VA Home Purchase Loans
B) Conventional Home Purchase Loans
C) Refinancings
D) Home Improvement Loans
E) Loans on Dwellings For 5+ Families
F) Non-occupant Loans on < 5 Family Dwellings (A B C & D)
G) Loans On Manufactured Home Dwelling (A B C & D)
Number
Average Value
Number
Average Value
Number
Average Value
Number
Average Value
Number
Average Value
Number
Average Value
Number
Average Value
LOANS ORIGINATED
66
$130,396
23
$128,102
65
$132,327
12
$36,359
1
$433,860
7
$62,330
45
$95,869
APPLICATIONS APPROVED, NOT ACCEPTED
4
$107,548
4
$55,765
9
$93,418
2
$6,740
0
$0
0
$0
9
$58,284
APPLICATIONS DENIED
5
$114,226
16
$58,522
53
$104,569
13
$32,620
0
$0
1
$42,900
26
$75,139
APPLICATIONS WITHDRAWN
5
$112,264
5
$130,894
32
$125,816
5
$52,946
0
$0
0
$0
9
$64,957
FILES CLOSED FOR INCOMPLETENESS
1
$199,770
2
$176,485
10
$95,719
0
$0
0
$0
0
$0
1
$35,540
Aggregated Statistics For Year 2008 (Based on 2 partial tracts)
A) FHA, FSA/RHS & VA Home Purchase Loans
B) Conventional Home Purchase Loans
C) Refinancings
D) Home Improvement Loans
F) Non-occupant Loans on < 5 Family Dwellings (A B C & D)
G) Loans On Manufactured Home Dwelling (A B C & D)
Number
Average Value
Number
Average Value
Number
Average Value
Number
Average Value
Number
Average Value
Number
Average Value
LOANS ORIGINATED
54
$119,133
27
$116,114
69
$99,984
13
$45,065
7
$68,984
50
$78,610
APPLICATIONS APPROVED, NOT ACCEPTED
5
$122,314
6
$84,362
13
$120,580
4
$15,012
2
$83,955
6
$96,618
APPLICATIONS DENIED
17
$116,072
18
$66,795
65
$115,923
20
$29,230
6
$82,115
38
$70,762
APPLICATIONS WITHDRAWN
12
$98,252
2
$79,665
23
$122,400
1
$198,550
0
$0
10
$96,332
FILES CLOSED FOR INCOMPLETENESS
2
$177,100
1
$105,400
1
$91,920
0
$0
0
$0
0
$0
Aggregated Statistics For Year 2007 (Based on 2 partial tracts)
A) FHA, FSA/RHS & VA Home Purchase Loans
B) Conventional Home Purchase Loans
C) Refinancings
D) Home Improvement Loans
F) Non-occupant Loans on < 5 Family Dwellings (A B C & D)
G) Loans On Manufactured Home Dwelling (A B C & D)
Number
Average Value
Number
Average Value
Number
Average Value
Number
Average Value
Number
Average Value
Number
Average Value
LOANS ORIGINATED
43
$109,877
59
$105,588
59
$93,997
34
$30,279
13
$80,984
59
$78,522
APPLICATIONS APPROVED, NOT ACCEPTED
0
$0
10
$84,812
17
$92,281
5
$32,356
1
$102,950
6
$53,110
APPLICATIONS DENIED
7
$108,903
23
$69,220
77
$91,570
31
$19,570
9
$32,956
40
$62,873
APPLICATIONS WITHDRAWN
2
$94,985
5
$61,034
18
$113,572
5
$46,818
4
$44,122
6
$96,822
FILES CLOSED FOR INCOMPLETENESS
0
$0
0
$0
7
$140,594
0
$0
0
$0
0
$0
Aggregated Statistics For Year 2006 (Based on 2 partial tracts)
A) FHA, FSA/RHS & VA Home Purchase Loans
B) Conventional Home Purchase Loans
C) Refinancings
D) Home Improvement Loans
F) Non-occupant Loans on < 5 Family Dwellings (A B C & D)
G) Loans On Manufactured Home Dwelling (A B C & D)
Number
Average Value
Number
Average Value
Number
Average Value
Number
Average Value
Number
Average Value
Number
Average Value
LOANS ORIGINATED
31
$96,466
77
$89,230
71
$94,647
39
$22,438
16
$76,600
60
$59,891
APPLICATIONS APPROVED, NOT ACCEPTED
0
$0
16
$62,582
17
$77,862
9
$42,488
0
$0
12
$36,666
APPLICATIONS DENIED
4
$61,588
36
$76,668
59
$94,579
26
$38,937
2
$73,535
28
$48,761
APPLICATIONS WITHDRAWN
4
$101,112
16
$84,030
42
$97,143
4
$58,830
1
$80,890
10
$79,909
FILES CLOSED FOR INCOMPLETENESS
0
$0
4
$107,548
10
$112,020
0
$0
1
$58,830
1
$58,830
Aggregated Statistics For Year 2005 (Based on 2 partial tracts)
A) FHA, FSA/RHS & VA Home Purchase Loans
B) Conventional Home Purchase Loans
C) Refinancings
D) Home Improvement Loans
F) Non-occupant Loans on < 5 Family Dwellings (A B C & D)
G) Loans On Manufactured Home Dwelling (A B C & D)
Number
Average Value
Number
Average Value
Number
Average Value
Number
Average Value
Number
Average Value
Number
Average Value
LOANS ORIGINATED
20
$89,469
85
$77,141
89
$86,384
27
$25,465
7
$45,873
39
$62,914
APPLICATIONS APPROVED, NOT ACCEPTED
9
$97,094
13
$86,546
31
$71,045
2
$15,320
0
$0
11
$65,848
APPLICATIONS DENIED
5
$84,566
32
$74,800
93
$91,525
21
$40,387
10
$55,275
33
$75,616
APPLICATIONS WITHDRAWN
1
$138,490
7
$60,230
61
$110,485
7
$87,367
1
$7,350
15
$64,221
FILES CLOSED FOR INCOMPLETENESS
1
$113,980
1
$183,840
15
$95,923
1
$79,660
0
$0
1
$113,980
Aggregated Statistics For Year 2004 (Based on 2 partial tracts)
A) FHA, FSA/RHS & VA Home Purchase Loans
B) Conventional Home Purchase Loans
C) Refinancings
D) Home Improvement Loans
F) Non-occupant Loans on < 5 Family Dwellings (A B C & D)
G) Loans On Manufactured Home Dwelling (A B C & D)
Number
Average Value
Number
Average Value
Number
Average Value
Number
Average Value
Number
Average Value
Number
Average Value
LOANS ORIGINATED
32
$93,988
60
$79,705
96
$80,124
28
$29,677
9
$24,512
50
$51,769
APPLICATIONS APPROVED, NOT ACCEPTED
2
$133,590
23
$53,713
21
$73,069
4
$8,580
0
$0
20
$40,568
APPLICATIONS DENIED
1
$113,980
32
$54,846
81
$78,696
21
$11,848
5
$44,366
38
$57,700
APPLICATIONS WITHDRAWN
2
$79,050
10
$75,742
50
$101,651
2
$75,985
0
$0
2
$64,955
FILES CLOSED FOR INCOMPLETENESS
0
$0
2
$82,115
2
$106,625
1
$61,280
0
$0
0
$0
Aggregated Statistics For Year 2003 (Based on 2 partial tracts)
A) FHA, FSA/RHS & VA Home Purchase Loans
B) Conventional Home Purchase Loans
C) Refinancings
D) Home Improvement Loans
F) Non-occupant Loans on < 5 Family Dwellings (A B C & D)
Number
Average Value
Number
Average Value
Number
Average Value
Number
Average Value
Number
Average Value
LOANS ORIGINATED
17
$92,352
66
$71,400
184
$78,512
28
$39,394
12
$38,708
APPLICATIONS APPROVED, NOT ACCEPTED
1
$94,370
11
$51,698
37
$70,455
7
$21,710
4
$64,037
APPLICATIONS DENIED
4
$65,262
22
$46,294
98
$68,008
15
$17,731
4
$37,380
APPLICATIONS WITHDRAWN
1
$85,790
9
$47,118
33
$88,169
0
$0
2
$14,095
FILES CLOSED FOR INCOMPLETENESS
0
$0
4
$47,185
5
$66,182
0
$0
0
$0
Aggregated Statistics For Year 1999 (Based on 1 partial tract)
A) FHA, FSA/RHS & VA Home Purchase Loans
B) Conventional Home Purchase Loans
C) Refinancings
D) Home Improvement Loans
E) Loans on Dwellings For 5+ Families
F) Non-occupant Loans on < 5 Family Dwellings (A B C & D)
Detailed PMIC statistics for the following Tracts:0245.04
2002 - 2018 National Fire Incident Reporting System (NFIRS) incidents
Based on the data from the years 2002 - 2018 the average number of fire incidents per year is 25. The highest number of fires - 77 took place in 2011, and the least - 7 in 2012. The data has a growing trend.
When looking into fire subcategories, the most reports belonged to: Outside Fires (65.7%), and Structure Fires (21.8%).
Fire incident types reported to NFIRS in Zip Code 71060

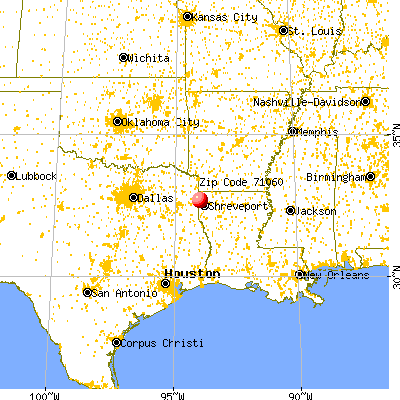


 Nearest zip codes: 71061, 71107, 71004, 71119, 71082, 75661.


 Based on the data from the years 2002 - 2018 the average number of fire incidents per year is 25. The highest number of fires - 77 took place in 2011, and the least - 7 in 2012. The data has a growing trend.
 When looking into fire subcategories, the most reports belonged to: Outside Fires (65.7%), and Structure Fires (21.8%).