Estimated median house/condo value in 2022: $102,121
71067:
$102,121
Louisiana:
$209,200
According to our research of Louisiana and other state lists, there were 12 registered sex offenders living in 71067 zip code as of May 28, 2024. The ratio of all residents to sex offenders in zip code 71067 is 312 to 1. The ratio of registered sex offenders to all residents in this zip code is near the state average.
Median resident age:
This zip code:
35.2 years
Louisiana median age:
38.2 years
Average household size:
This zip code:
3.3 people
Louisiana:
2.5 people
Averages for the 2020 tax year for zip code 71067, filed in 2021:
Average Adjusted Gross Income (AGI) in 2020: $43,408 (Individual Income Tax Returns)
Here:
$43,408
State:
$60,757
Salary/wage: $39,778 (reported on 84.0% of returns)
Here:
$39,778
State:
$50,882
(% of AGI for various income ranges: 1111.6% for AGIs below $25k, 3344.8% for AGIs $25k-50k, 6742.7% for AGIs $50k-75k, 9694.3% for AGIs $75k-100k, 18293.8% for AGIs $100k-200k)
Taxable interest for individuals: $270 (reported on 16.0% of returns)
This zip code:
$270
Louisiana:
$1,576
(% of AGI for various income ranges: 3.2% for AGIs below $25k, 5.8% for AGIs $25k-50k, 4.0% for AGIs $50k-75k, 2.9% for AGIs $75k-100k, 23.8% for AGIs $100k-200k)
Ordinary dividends: $957 (reported on 4.9% of returns)
Here:
$957
State:
$7,743
(% of AGI for various income ranges: 9.4% for AGIs $25k-50k, 45.0% for AGIs $100k-200k)
Net capital gain/loss in AGI: +$4,157 (reported on 4.9% of returns)
Here:
+$4,157
State:
+$16,917
(% of AGI for various income ranges: 10.0% for AGIs $25k-50k, 322.5% for AGIs $100k-200k)
Profit/loss from business: +$4,921 (reported on 16.7% of returns)
Here:
+$4,921
State:
+$7,679
(% of AGI for various income ranges: 122.8% for AGIs below $25k, 69.7% for AGIs $25k-50k, 171.3% for AGIs $50k-75k, 100.0% for AGIs $100k-200k)
Taxable individual retirement arrangement distribution: $10,383 (reported on 4.2% of returns)
71067:
$10,383
Louisiana:
$20,716
(% of AGI for various income ranges: 48.8% for AGIs below $25k, 252.7% for AGIs $50k-75k)
Total itemized deductions: $27,375 (reported on 2.8% of returns)
Here:
$27,375
State:
$36,265
(% of AGI for various income ranges: 1564.3% for AGIs $75k-100k)
Charity contributions: $5,200 (reported on 2.1% of returns)
Here:
$5,200
State:
$13,106
(% of AGI for various income ranges: 47.3% for AGIs $25k-50k)
Taxes paid: $4,075 (reported on 2.8% of returns)
71067:
$4,075
State:
$6,643
(% of AGI for various income ranges: 232.9% for AGIs $75k-100k)
Earned income credit: $2,510 (reported on 28.5% of returns)
Here:
$2,510
State:
$2,671
(% of AGI for various income ranges: 135.0% for AGIs below $25k, 107.3% for AGIs $25k-50k)
Percentage of individuals using paid preparers for their 2020 taxes: 91.0%
Here:
91%
State:
92%
(% for various income ranges: 90.3% for AGIs below $25k, 90.0% for AGIs $25k-50k, 90.0% for AGIs $50k-75k, 100.0% for AGIs $75k-100k, 90.9% for AGIs $100k-200k, 100.0% for AGIs over 200k)
Averages for the 2012 tax year for zip code 71067, filed in 2013:
Average Adjusted Gross Income (AGI) in 2012: $38,118 (Individual Income Tax Returns)
Here:
$38,118
State:
$56,730
Salary/wage: $35,283 (reported on 89.3% of returns)
Here:
$35,283
State:
$45,545
(% of AGI for various income ranges: 82.0% for AGIs below $25k, 84.3% for AGIs $25k-50k, 89.1% for AGIs $50k-75k, 85.0% for AGIs $75k-100k, 70.2% for AGIs $100k-200k)
Taxable interest for individuals: $411 (reported on 13.6% of returns)
This zip code:
$411
Louisiana:
$1,804
(% of AGI for various income ranges: 0.4% for AGIs below $25k, 0.2% for AGIs $50k-75k, 0.1% for AGIs $75k-100k)
Ordinary dividends: $460 (reported on 3.6% of returns)
Here:
$460
State:
$7,610
Profit/loss from business: +$11,656 (reported on 12.9% of returns)
Here:
+$11,656
State:
+$12,088
(% of AGI for various income ranges: 5.4% for AGIs below $25k, 2.4% for AGIs $25k-50k, 0.9% for AGIs $50k-75k, 0.2% for AGIs $75k-100k, 12.6% for AGIs $100k-200k)
Taxable individual retirement arrangement distribution: $9,971 (reported on 5.0% of returns)
71067:
$9,971
Louisiana:
$16,085
Total itemized deductions: $19,626 (27% of AGI, reported on 16.4% of returns)
Here:
$19,626
State:
$23,585
Here:
27.1% of AGI
State:
18.1% of AGI
(% of AGI for various income ranges: 3.1% for AGIs below $25k, 7.5% for AGIs $25k-50k, 10.5% for AGIs $50k-75k, 10.5% for AGIs $75k-100k, 10.3% for AGIs $100k-200k)
Charity contributions: $5,453 (reported on 12.1% of returns)
Here:
$5,453
State:
$5,533
(% of AGI for various income ranges: 2.1% for AGIs $25k-50k, 2.2% for AGIs $50k-75k, 2.3% for AGIs $75k-100k, 1.7% for AGIs $100k-200k)
Taxes paid: $3,135 (reported on 16.4% of returns)
71067:
$3,135
State:
$6,282
(% of AGI for various income ranges: 0.2% for AGIs below $25k, 0.6% for AGIs $25k-50k, 2.0% for AGIs $50k-75k, 1.5% for AGIs $75k-100k, 2.6% for AGIs $100k-200k)
Earned income credit: $2,445 (reported on 30.0% of returns)
Here:
$2,445
State:
$2,633
(% of AGI for various income ranges: 9.3% for AGIs below $25k, 1.6% for AGIs $25k-50k)
Percentage of individuals using paid preparers for their 2012 taxes: 51.4%
Here:
51%
State:
57%
(% for various income ranges: 48.4% for AGIs below $25k, 50.0% for AGIs $25k-50k, 55.6% for AGIs $50k-75k, 50.0% for AGIs $75k-100k, 83.3% for AGIs $100k-200k)
Averages for the 2004 tax year for zip code 71067, filed in 2005:
Average Adjusted Gross Income (AGI) in 2004: $29,231 (Individual Income Tax Returns)
Here:
$29,231
State:
$39,411
Salary/wage: $28,381 (reported on 92.3% of returns)
Here:
$28,381
State:
$34,434
(% of AGI for various income ranges: 141.4% for AGIs below $10k, 92.0% for AGIs $10k-25k, 89.4% for AGIs $25k-50k, 91.1% for AGIs $50k-75k, 89.7% for AGIs $75k-100k, 61.4% for AGIs over 100k)
Taxable interest for individuals: $475 (reported on 19.2% of returns)
This zip code:
$475
Louisiana:
$1,606
(% of AGI for various income ranges: 0.3% for AGIs below $10k, 0.2% for AGIs $10k-25k, 0.4% for AGIs $25k-50k, 0.2% for AGIs $50k-75k, 0.6% for AGIs $75k-100k, 0.1% for AGIs over 100k)
Taxable dividends: $571 (reported on 5.5% of returns)
Here:
$571
State:
$3,235
(% of AGI for various income ranges: 0.2% for AGIs below $10k, 0.2% for AGIs $25k-50k, 0.0% for AGIs $50k-75k, 0.2% for AGIs $75k-100k)
Net capital gain/loss: +$245 (reported on 4.6% of returns)
Here:
+$245
State:
+$8,531
Total itemized deductions: $14,932 (26% of AGI, reported on 12.8% of returns)
Here:
$14,932
State:
$18,222
Here:
25.8% of AGI
State:
20.3% of AGI
(% of AGI for various income ranges: 2.9% for AGIs $10k-25k, 6.7% for AGIs $25k-50k, 8.4% for AGIs $50k-75k, 6.9% for AGIs $75k-100k, 10.9% for AGIs over 100k)
Charity contributions deductions: $4,109 (7% of AGI, reported on 9.5% of returns)
Here:
$4,109
State:
$4,190
Here:
6.7% of AGI
State:
4.4% of AGI
(% of AGI for various income ranges: 0.6% for AGIs $10k-25k, 1.3% for AGIs $25k-50k, 1.3% for AGIs $50k-75k, 1.0% for AGIs $75k-100k, 4.0% for AGIs over 100k)
Total tax: $3,411 (reported on 63.7% of returns)
71067:
$3,411
State:
$6,529
(% of AGI for various income ranges: 2.1% for AGIs below $10k, 2.8% for AGIs $10k-25k, 5.7% for AGIs $25k-50k, 8.9% for AGIs $50k-75k, 11.6% for AGIs $75k-100k, 17.6% for AGIs over 100k)
Earned income credit: $1,987 (reported on 32.3% of returns)
Here:
$1,987
State:
$2,103
Percentage of individuals using paid preparers for their 2004 taxes: 60.8%
Here:
61%
State:
61%
(% for various income ranges: 54.8% for AGIs below $10k, 62.4% for AGIs $10k-25k, 64.2% for AGIs $25k-50k, 58.2% for AGIs $50k-75k, 64.3% for AGIs $75k-100k, 61.9% for AGIs over 100k)
Household received Food Stamps/SNAP in the past 12 months: 312 Household did not receive Food Stamps/SNAP in the past 12 months: 684
Women who had a birth in the past 12 months: 58 (0 now married, 60 unmarried) Women who did not have a birth in the past 12 months: 951 (315 now married, 637 unmarried)
Housing units in zip code 71067 with a mortgage: 320 (6 second mortgage) Median monthly owner costs for units with a mortgage: $978 Median monthly owner costs for units without a mortgage: $308
Residents with income below the poverty level in 2022:
This zip code:
36.5%
Whole state:
18.6%
Residents with income below 50% of the poverty level in 2022:
This zip code:
16.2%
Whole state:
10.1%
Median number of rooms in houses and condos:
Here:
6.1
State:
6.2
Median number of rooms in apartments:
Here:
4.6
State:
4.4
Notable locations in this zip code not listed on our city pages
Churches in zip code 71067 include: Starlight Church (A), Wesley Chapel Church (B), Hopewell Church (C), Saint James Church (D). Display/hide their locations on the map
Facilities with environmental interests located in this zip code:
PRINCETON ELEMENTARY SCHOOL (1895 WINFIELD ROAD in PRINCETON, LA)
(National Center for Education Statistics) - STATE ID-008040 Organizations: BOSSIER PARISH SCHOOL BOARD (SCHOOL DISTRICT)
CIRCLE W TRAILER PARK (1 CIRCLE DR in PRINCETON, LA)
National Pollutant Discharge Elimination System NON-MAJOR (Tracking pollutant discharge elimination systems) - permit National Pollutant Discharge Elimination System NON-MAJOR (Tracking pollutant discharge elimination systems) - permit Business SIC classification: RECREATIONAL VEHICLE PARKS AND CAMPSITES Alternative names: CIRCLE W MHP, ORF, LLC - CIRCLE W TRAILER
FALCO S & D INC (9321 HWY 157 in PRINCETON, LA)
Small Quantity Generators, between 100 kg and 1000 kg of hazardous waste/month (Resource Conservation and Recovery Act (tracking hazardous waste)) - notification TRANSPORTER (Resource Conservation and Recovery Act (tracking hazardous waste)) - notification USED OIL PROGRAM (Resource Conservation and Recovery Act (tracking hazardous waste)) Organizations: CLAIR S SMITH (CONTACT/OWNER)
BAYOU STATE OIL CORPORATION (BELLEVUE FIELD in PRINCETON, LA)
National Pollutant Discharge Elimination System NON-MAJOR (Tracking pollutant discharge elimination systems) - permit
BRIARWOOD MOBILE HOME PARK ( in PRINCETON, LA)
National Pollutant Discharge Elimination System NON-MAJOR (Tracking pollutant discharge elimination systems) - permit Business SIC classification: SEWERAGE SYSTEMS Alternative names: BRIARWOOD MOBILE HO-
PRINCETON MIDDLE SCHOOL (1895 WINFIELD RD in PRINCETON, LA)
National Pollutant Discharge Elimination System NON-MAJOR (Tracking pollutant discharge elimination systems) - permit Business SIC classification: SEWERAGE SYSTEMS
EASTWOOD MOBILE HOME PARK ( in PRINCETON, LA)
National Pollutant Discharge Elimination System NON-MAJOR (Tracking pollutant discharge elimination systems) - permit Business SIC classification: SEWERAGE SYSTEMS Alternative names: EASTWOOD MOBILE HOM-
EXXON PIPELINE COMPANY (TRANSMISSION LINE in PRINCETON, LA)
National Pollutant Discharge Elimination System NON-MAJOR (Tracking pollutant discharge elimination systems) - permit Alternative names: EXXON PIPELINE TRANSMISSION LN
F-S PRESTRESS INC- ( in , LA)
National Pollutant Discharge Elimination System NON-MAJOR (Tracking pollutant discharge elimination systems) - permit Business SIC classification: CONCRETE PRODUCTS, EXCEPT BLOCK AND BRICK
FILMORE TRUCK UNLOAD (9321 HWY 157 in PRINCETON, LA)
National Pollutant Discharge Elimination System NON-MAJOR (Tracking pollutant discharge elimination systems) - permit Alternative names: GENESIS CRUDE OIL, LP
BENSON CONSTRUCTION CO INC (HWY 157 .5 M S HWY 80 in PRINCETON, LA)
Conditionally Exempt Small Quantity Generators, less than 100 kg/month of hazardous waste (Resource Conservation and Recovery Act (tracking hazardous waste)) - notification
58.3%Electricity
38.4%Utility gas
2.4%Bottled, tank, or LP gas
1.1%No fuel used
Population in 1990: 1,914.
Place of birth for U.S.-born residents:
This state: 2,680
Northeast: 45
Midwest: 68
South: 132
West: 221
58% of the 71067 zip code residents lived in the same house 5 years ago. Out of people who lived in different houses, 46% lived in this county. Out of people who lived in different counties, 50% lived in Louisiana.
88% of the 71067 zip code residents lived in the same house 1 year ago. Out of people who lived in different houses, 78% moved from this county. Out of people who lived in different houses, 11% moved from different county within same state. Out of people who lived in different houses, 6% moved from different state.
Private vs. public school enrollment:
Students in private schools in grades 1 to 8 (elementary and middle school): 28
Here:
8.5%
Louisiana:
19.6%
Students in private schools in grades 9 to 12 (high school):
Here:
0.0%
Louisiana:
18.3%
Students in private undergraduate colleges:
Here:
0.0%
Louisiana:
17.4%
Occupation by median earnings in the past 12 months ($)
63,636Community and social service occupations
42,091Construction and extraction occupations
22,027Sales and related occupations
19,746Education, training, and library occupations
6,125Food preparation and serving related occupations
2,415Office and administrative support occupations
Companies with federal contracts located in this zip code:
HAVE KNIVES WILL TRAVEL CULINA (199 HILLTOP ROAD in PRINCETON, PA; small business) : $19,071 in 2 contractsin 2002
$10,788 with Army for Meat, Poultry, and Fish. Signed on 2002-12-04. Completion date: 2002-12-08.
$8,283, same as above.Signed on 2002-12-20. Completion date: 2002-12-08.
Top industries in this zip code by the number of employees in 2005:
Real Estate and Rental and Leasing: Construction, Mining, and Forestry Machinery and Equipment Rental and Leasing (20-49 employees: 1 establishment)
Mining: Crude Petroleum and Natural Gas Extraction (10-19: 1)
Construction: Poured Concrete Foundation and Structure Contractors (5-9: 1)
Construction: Electrical Contractors (1-4: 2)
Professional, Scientific, and Technical Services: All Other Professional, Scientific, and Technical Services (1-4: 2)
Fatal accident statistics in 2014:
Fatal accident count: 1
Vehicles involved in fatal accidents: 1
Fatal accidents caused by drunken drivers: 0
Fatalities: 1
Persons involved in fatal accidents: 4
Pedestrians involved in fatal accidents: 1
Fatal accident statistics in 2012:
Fatal accident count: 1
Vehicles involved in fatal accidents: 2
Fatal accidents caused by drunken drivers: 0
Fatalities: 1
Persons involved in fatal accidents: 8
Pedestrians involved in fatal accidents: 0
Home Mortgage Disclosure Act Aggregated Statistics For Year 2009 (Based on 2 partial tracts)
A) FHA, FSA/RHS & VA Home Purchase Loans
B) Conventional Home Purchase Loans
C) Refinancings
D) Home Improvement Loans
F) Non-occupant Loans on < 5 Family Dwellings (A B C & D)
G) Loans On Manufactured Home Dwelling (A B C & D)
Number
Average Value
Number
Average Value
Number
Average Value
Number
Average Value
Number
Average Value
Number
Average Value
LOANS ORIGINATED
120
$165,062
41
$131,308
114
$148,951
8
$14,402
15
$78,023
58
$86,402
APPLICATIONS APPROVED, NOT ACCEPTED
2
$101,875
11
$90,960
15
$125,565
1
$14,550
0
$0
11
$62,735
APPLICATIONS DENIED
18
$125,525
11
$73,209
61
$135,396
21
$12,243
6
$43,660
22
$72,106
APPLICATIONS WITHDRAWN
10
$140,806
5
$123,948
30
$173,754
2
$80,650
1
$155,240
7
$95,119
FILES CLOSED FOR INCOMPLETENESS
1
$163,730
0
$0
7
$226,447
1
$242,560
0
$0
2
$130,980
Aggregated Statistics For Year 2008 (Based on 2 partial tracts)
A) FHA, FSA/RHS & VA Home Purchase Loans
B) Conventional Home Purchase Loans
C) Refinancings
D) Home Improvement Loans
F) Non-occupant Loans on < 5 Family Dwellings (A B C & D)
G) Loans On Manufactured Home Dwelling (A B C & D)
Number
Average Value
Number
Average Value
Number
Average Value
Number
Average Value
Number
Average Value
Number
Average Value
LOANS ORIGINATED
159
$148,801
73
$168,612
87
$148,631
12
$30,421
12
$161,202
76
$77,268
APPLICATIONS APPROVED, NOT ACCEPTED
4
$116,732
13
$79,485
15
$173,673
2
$20,010
0
$0
15
$50,614
APPLICATIONS DENIED
18
$108,343
27
$70,612
86
$126,103
19
$60,257
7
$51,804
56
$74,609
APPLICATIONS WITHDRAWN
8
$167,064
8
$350,045
52
$164,848
2
$55,790
1
$1,576,640
12
$100,562
FILES CLOSED FOR INCOMPLETENESS
0
$0
2
$274,095
2
$161,910
0
$0
0
$0
0
$0
Aggregated Statistics For Year 2007 (Based on 2 partial tracts)
A) FHA, FSA/RHS & VA Home Purchase Loans
B) Conventional Home Purchase Loans
C) Refinancings
D) Home Improvement Loans
F) Non-occupant Loans on < 5 Family Dwellings (A B C & D)
G) Loans On Manufactured Home Dwelling (A B C & D)
Number
Average Value
Number
Average Value
Number
Average Value
Number
Average Value
Number
Average Value
Number
Average Value
LOANS ORIGINATED
78
$131,682
115
$137,046
85
$118,598
18
$35,306
8
$66,855
64
$78,813
APPLICATIONS APPROVED, NOT ACCEPTED
7
$133,927
19
$102,258
25
$102,215
2
$17,585
0
$0
17
$58,357
APPLICATIONS DENIED
11
$86,329
50
$63,235
81
$97,952
38
$53,395
4
$90,658
63
$61,930
APPLICATIONS WITHDRAWN
4
$107,030
11
$144,985
38
$123,993
5
$82,470
1
$208,600
16
$76,331
FILES CLOSED FOR INCOMPLETENESS
0
$0
2
$197,080
13
$116,615
1
$97,020
0
$0
2
$107,940
Aggregated Statistics For Year 2006 (Based on 2 partial tracts)
A) FHA, FSA/RHS & VA Home Purchase Loans
B) Conventional Home Purchase Loans
C) Refinancings
D) Home Improvement Loans
F) Non-occupant Loans on < 5 Family Dwellings (A B C & D)
G) Loans On Manufactured Home Dwelling (A B C & D)
Number
Average Value
Number
Average Value
Number
Average Value
Number
Average Value
Number
Average Value
Number
Average Value
LOANS ORIGINATED
69
$114,302
133
$117,943
84
$99,132
19
$24,894
11
$72,768
75
$87,225
APPLICATIONS APPROVED, NOT ACCEPTED
4
$82,168
16
$73,071
24
$93,689
6
$39,012
1
$71,560
18
$64,211
APPLICATIONS DENIED
18
$129,433
40
$89,747
67
$89,820
39
$41,049
5
$82,228
50
$72,137
APPLICATIONS WITHDRAWN
6
$126,132
16
$101,951
28
$102,828
5
$90,718
1
$60,640
4
$91,870
FILES CLOSED FOR INCOMPLETENESS
1
$137,050
1
$83,680
8
$75,042
0
$0
0
$0
2
$89,745
Aggregated Statistics For Year 2005 (Based on 2 partial tracts)
A) FHA, FSA/RHS & VA Home Purchase Loans
B) Conventional Home Purchase Loans
C) Refinancings
D) Home Improvement Loans
F) Non-occupant Loans on < 5 Family Dwellings (A B C & D)
G) Loans On Manufactured Home Dwelling (A B C & D)
Number
Average Value
Number
Average Value
Number
Average Value
Number
Average Value
Number
Average Value
Number
Average Value
LOANS ORIGINATED
58
$107,124
121
$96,934
92
$81,851
24
$37,850
12
$59,528
69
$65,157
APPLICATIONS APPROVED, NOT ACCEPTED
7
$86,456
30
$74,749
34
$79,866
5
$23,286
1
$59,430
23
$53,890
APPLICATIONS DENIED
10
$86,836
49
$65,739
108
$93,610
27
$32,656
6
$36,182
61
$61,674
APPLICATIONS WITHDRAWN
5
$119,824
15
$89,667
53
$102,173
10
$124,797
2
$115,820
22
$74,422
FILES CLOSED FOR INCOMPLETENESS
0
$0
2
$140,080
15
$104,058
1
$36,380
0
$0
0
$0
Aggregated Statistics For Year 2004 (Based on 2 partial tracts)
A) FHA, FSA/RHS & VA Home Purchase Loans
B) Conventional Home Purchase Loans
C) Refinancings
D) Home Improvement Loans
F) Non-occupant Loans on < 5 Family Dwellings (A B C & D)
G) Loans On Manufactured Home Dwelling (A B C & D)
Number
Average Value
Number
Average Value
Number
Average Value
Number
Average Value
Number
Average Value
Number
Average Value
LOANS ORIGINATED
44
$110,944
68
$82,506
70
$75,939
8
$34,716
11
$73,099
55
$63,176
APPLICATIONS APPROVED, NOT ACCEPTED
6
$94,800
15
$51,261
29
$64,404
2
$12,735
0
$0
17
$44,731
APPLICATIONS DENIED
10
$90,717
42
$74,212
120
$72,000
23
$40,391
7
$54,749
73
$59,992
APPLICATIONS WITHDRAWN
4
$93,385
8
$118,400
61
$88,733
4
$24,255
1
$67,920
13
$88,441
FILES CLOSED FOR INCOMPLETENESS
0
$0
2
$135,225
8
$138,714
0
$0
0
$0
0
$0
Aggregated Statistics For Year 2003 (Based on 2 partial tracts)
A) FHA, FSA/RHS & VA Home Purchase Loans
B) Conventional Home Purchase Loans
C) Refinancings
D) Home Improvement Loans
F) Non-occupant Loans on < 5 Family Dwellings (A B C & D)
Number
Average Value
Number
Average Value
Number
Average Value
Number
Average Value
Number
Average Value
LOANS ORIGINATED
39
$90,214
96
$76,785
160
$83,683
17
$16,908
11
$38,368
APPLICATIONS APPROVED, NOT ACCEPTED
1
$166,150
11
$74,973
36
$92,206
2
$114,005
0
$0
APPLICATIONS DENIED
7
$91,653
22
$61,467
132
$81,818
25
$13,535
2
$50,940
APPLICATIONS WITHDRAWN
1
$208,600
15
$79,641
56
$109,542
2
$21,225
0
$0
FILES CLOSED FOR INCOMPLETENESS
1
$137,050
0
$0
11
$68,247
0
$0
0
$0
Aggregated Statistics For Year 1999 (Based on 1 partial tract)
A) FHA, FSA/RHS & VA Home Purchase Loans
B) Conventional Home Purchase Loans
C) Refinancings
D) Home Improvement Loans
F) Non-occupant Loans on < 5 Family Dwellings (A B C & D)
Detailed PMIC statistics for the following Tracts:0111.06
2002 - 2018 National Fire Incident Reporting System (NFIRS) incidents
According to the data from the years 2002 - 2018 the average number of fires per year is 6. The highest number of reported fire incidents - 22 took place in 2005, and the least - 0 in 2003. The data has a growing trend.
When looking into fire subcategories, the most reports belonged to: Outside Fires (62.6%), and Structure Fires (27.1%).
Fire incident types reported to NFIRS in Zip Code 71067

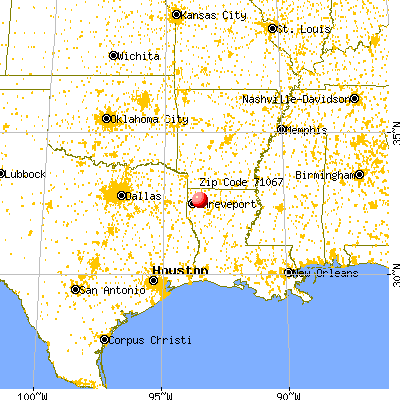


 Nearest zip codes: 71037, 71110, 71023, 71006, 71111, 71112.


 (Students: 683, Location: 1895 WINFIELD ROAD, Grades: PK-5)


 According to the data from the years 2002 - 2018 the average number of fires per year is 6. The highest number of reported fire incidents - 22 took place in 2005, and the least - 0 in 2003. The data has a growing trend.
 When looking into fire subcategories, the most reports belonged to: Outside Fires (62.6%), and Structure Fires (27.1%).