Estimated zip code population in 2022: 2,280 Zip code population in 2010: 2,807 Zip code population in 2000: 2,383
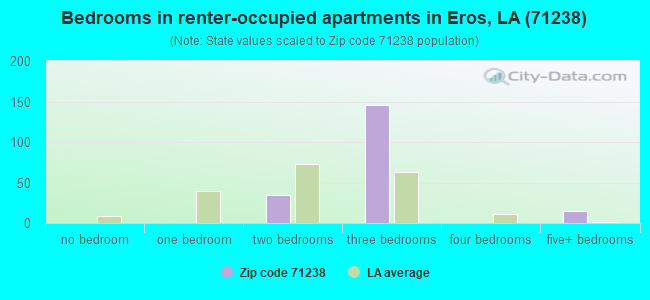
Houses and condos: 1,315 Renter-occupied apartments: 180
% of renters here:
18%
State:
32%
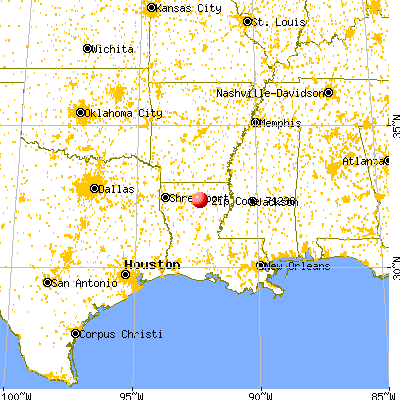
March 2022 cost of living index in zip code 71238: 80.6 (low, U.S. average is 100)
Land area: 109.4 sq. mi. Water area: 0.1 sq. mi.
Population density: 21 people per square mile
(very low).
OSM Map
General Map
Google Map
MSN Map
OSM Map
General Map
Google Map
MSN Map
OSM Map
General Map
Google Map
MSN Map
OSM Map
General Map
Google Map
MSN Map
Please wait while loading the map...
Real estate property taxes paid for housing units in 2022:
This zip code:
0.6% ($899)
Louisiana:
0.5% ($1,127)
Median real estate property taxes paid for housing units with mortgages in 2022: $1,228 (0.6%) Median real estate property taxes paid for housing units with no mortgage in 2022: $758 (0.8%)
Business Search- 14 Million verified businesses
Males: 1,089
(47.8%)
Females: 1,190
(52.2%)
For population 25 years and over in 71238:
High school or higher: 84.6%
Bachelor's degree or higher: 8.0%
Graduate or professional degree: 1.0%
Unemployed: 3.1%
Mean travel time to work (commute): 33.1 minutes
For population 15 years and over in 71238:
Never married: 27.6%
Now married: 56.8%
Separated: 1.3%
Widowed: 5.2%
Divorced: 9.1%
Zip code 71238 compared to state average:
Unemployed percentage below state average.
Black race population percentage significantly below state average.
Hispanic race population percentage significantly below state average.
Median age above state average.
Foreign-born population percentage significantly below state average.
Renting percentage below state average.
Length of stay since moving in above state average.
House age below state average.
Percentage of population with a bachelor's degree or higher significantly below state average.
Estimated median house/condo value in 2022: $139,467
71238:
$139,467
Louisiana:
$209,200
According to our research of Louisiana and other state lists, there were 8 registered sex offenders living in 71238 zip code as of May 28, 2024. The ratio of all residents to sex offenders in zip code 71238 is 399 to 1. The ratio of registered sex offenders to all residents in this zip code is near the state average.
Median resident age:
This zip code:
45.7 years
Louisiana median age:
38.2 years
Average household size:
This zip code:
2.3 people
Louisiana:
2.5 people
Averages for the 2020 tax year for zip code 71238, filed in 2021:
Average Adjusted Gross Income (AGI) in 2020: $52,036 (Individual Income Tax Returns)
Here:
$52,036
State:
$60,757
Salary/wage: $48,851 (reported on 82.9% of returns)
Here:
$48,851
State:
$50,882
(% of AGI for various income ranges: 1146.6% for AGIs below $25k, 3556.4% for AGIs $25k-50k, 6807.1% for AGIs $50k-75k, 9713.3% for AGIs $75k-100k, 15174.2% for AGIs $100k-200k)
Taxable interest for individuals: $393 (reported on 23.3% of returns)
This zip code:
$393
Louisiana:
$1,576
(% of AGI for various income ranges: 6.8% for AGIs below $25k, 11.2% for AGIs $25k-50k, 20.0% for AGIs $50k-75k, 16.7% for AGIs $75k-100k, 17.5% for AGIs $100k-200k)
Ordinary dividends: $1,170 (reported on 7.8% of returns)
Here:
$1,170
State:
$7,743
(% of AGI for various income ranges: 8.7% for AGIs below $25k, 37.9% for AGIs $50k-75k, 25.8% for AGIs $100k-200k)
Net capital gain/loss in AGI: +$4,044 (reported on 7.0% of returns)
Here:
+$4,044
State:
+$16,917
(% of AGI for various income ranges: 19.2% for AGIs below $25k, 32.9% for AGIs $50k-75k, 204.2% for AGIs $100k-200k)
Profit/loss from business: +$5,400 (reported on 16.3% of returns)
Here:
+$5,400
State:
+$7,679
(% of AGI for various income ranges: 105.3% for AGIs below $25k, 103.2% for AGIs $25k-50k, 7.9% for AGIs $50k-75k, 410.8% for AGIs $100k-200k)
Taxable individual retirement arrangement distribution: $10,756 (reported on 7.0% of returns)
71238:
$10,756
Louisiana:
$20,716
(% of AGI for various income ranges: 81.8% for AGIs below $25k, 85.6% for AGIs $25k-50k, 492.2% for AGIs $75k-100k)
Total itemized deductions: $31,450 (reported on 3.1% of returns)
Here:
$31,450
State:
$36,265
(% of AGI for various income ranges: 1048.3% for AGIs $100k-200k)
Charity contributions: $11,400 (reported on 2.3% of returns)
Here:
$11,400
State:
$13,106
(% of AGI for various income ranges: 380.0% for AGIs $75k-100k)
Taxes paid: $7,500 (reported on 2.3% of returns)
71238:
$7,500
State:
$6,643
(% of AGI for various income ranges: 187.5% for AGIs $100k-200k)
Earned income credit: $2,555 (reported on 22.5% of returns)
Here:
$2,555
State:
$2,671
(% of AGI for various income ranges: 127.6% for AGIs below $25k, 102.4% for AGIs $25k-50k)
Percentage of individuals using paid preparers for their 2020 taxes: 93.8%
Here:
94%
State:
92%
(% for various income ranges: 91.8% for AGIs below $25k, 90.3% for AGIs $25k-50k, 100.0% for AGIs $50k-75k, 100.0% for AGIs $75k-100k, 93.8% for AGIs $100k-200k, 100.0% for AGIs over 200k)
Averages for the 2012 tax year for zip code 71238, filed in 2013:
Average Adjusted Gross Income (AGI) in 2012: $46,701 (Individual Income Tax Returns)
Here:
$46,701
State:
$56,730
Salary/wage: $43,237 (reported on 86.1% of returns)
Here:
$43,237
State:
$45,545
(% of AGI for various income ranges: 73.6% for AGIs below $25k, 82.1% for AGIs $25k-50k, 85.6% for AGIs $50k-75k, 84.7% for AGIs $75k-100k, 73.4% for AGIs $100k-200k)
Taxable interest for individuals: $371 (reported on 25.4% of returns)
This zip code:
$371
Louisiana:
$1,804
(% of AGI for various income ranges: 0.8% for AGIs below $25k, 0.2% for AGIs $25k-50k, 0.2% for AGIs $50k-75k, 0.1% for AGIs $100k-200k)
Ordinary dividends: $1,371 (reported on 5.7% of returns)
Here:
$1,371
State:
$7,610
Net capital gain/loss in AGI: +$114 (reported on 5.7% of returns)
Here:
+$114
State:
+$17,096
(% of AGI for various income ranges: 0.1% for AGIs $100k-200k)
Profit/loss from business: +$6,650 (reported on 18.0% of returns)
Here:
+$6,650
State:
+$12,088
(% of AGI for various income ranges: 11.0% for AGIs below $25k, 2.4% for AGIs $25k-50k, 1.6% for AGIs $50k-75k, 3.2% for AGIs $75k-100k)
Taxable individual retirement arrangement distribution: $13,633 (reported on 7.4% of returns)
71238:
$13,633
Louisiana:
$16,085
(% of AGI for various income ranges: 1.5% for AGIs below $25k, 4.5% for AGIs $25k-50k, 6.1% for AGIs $75k-100k)
Total itemized deductions: $18,173 (20% of AGI, reported on 21.3% of returns)
Here:
$18,173
State:
$23,585
Here:
20.4% of AGI
State:
18.1% of AGI
(% of AGI for various income ranges: 5.5% for AGIs below $25k, 5.5% for AGIs $25k-50k, 8.7% for AGIs $50k-75k, 9.5% for AGIs $75k-100k, 10.0% for AGIs $100k-200k)
Charity contributions: $5,639 (reported on 14.8% of returns)
Here:
$5,639
State:
$5,533
(% of AGI for various income ranges: 1.8% for AGIs below $25k, 1.8% for AGIs $50k-75k, 2.1% for AGIs $75k-100k, 2.7% for AGIs $100k-200k)
Taxes paid: $3,712 (reported on 20.5% of returns)
71238:
$3,712
State:
$6,282
(% of AGI for various income ranges: 0.4% for AGIs below $25k, 0.6% for AGIs $25k-50k, 1.2% for AGIs $50k-75k, 1.8% for AGIs $75k-100k, 2.9% for AGIs $100k-200k)
Earned income credit: $2,206 (reported on 27.0% of returns)
Here:
$2,206
State:
$2,633
(% of AGI for various income ranges: 8.7% for AGIs below $25k, 1.8% for AGIs $25k-50k)
Percentage of individuals using paid preparers for their 2012 taxes: 59.0%
Here:
59%
State:
57%
(% for various income ranges: 55.1% for AGIs below $25k, 54.8% for AGIs $25k-50k, 57.9% for AGIs $50k-75k, 66.7% for AGIs $75k-100k, 81.8% for AGIs $100k-200k)
Averages for the 2004 tax year for zip code 71238, filed in 2005:
Average Adjusted Gross Income (AGI) in 2004: $35,151 (Individual Income Tax Returns)
Here:
$35,151
State:
$39,411
Salary/wage: $33,726 (reported on 88.9% of returns)
Here:
$33,726
State:
$34,434
(% of AGI for various income ranges: 101.8% for AGIs below $10k, 78.6% for AGIs $10k-25k, 87.4% for AGIs $25k-50k, 85.5% for AGIs $50k-75k, 92.4% for AGIs $75k-100k, 76.5% for AGIs over 100k)
Taxable interest for individuals: $792 (reported on 32.1% of returns)
This zip code:
$792
Louisiana:
$1,606
(% of AGI for various income ranges: 1.1% for AGIs below $10k, 1.4% for AGIs $10k-25k, 0.5% for AGIs $25k-50k, 0.3% for AGIs $50k-75k, 0.6% for AGIs $75k-100k, 1.4% for AGIs over 100k)
Taxable dividends: $720 (reported on 8.7% of returns)
Here:
$720
State:
$3,235
(% of AGI for various income ranges: 0.4% for AGIs $10k-25k, 0.1% for AGIs $25k-50k, 0.3% for AGIs $50k-75k, 0.1% for AGIs over 100k)
Net capital gain/loss: +$1,826 (reported on 8.6% of returns)
Here:
+$1,826
State:
+$8,531
(% of AGI for various income ranges: -1.0% for AGIs below $10k, 0.7% for AGIs $10k-25k, 0.2% for AGIs $25k-50k, 0.5% for AGIs $50k-75k, 1.4% for AGIs over 100k)
Profit/loss from business: +$5,552 (reported on 15.3% of returns)
Here:
+$5,552
State:
+$9,128
(% of AGI for various income ranges: 5.0% for AGIs below $10k, 6.4% for AGIs $10k-25k, 4.4% for AGIs $25k-50k, 0.3% for AGIs $50k-75k, 0.7% for AGIs $75k-100k)
Total itemized deductions: $15,867 (24% of AGI, reported on 19.8% of returns)
Here:
$15,867
State:
$18,222
Here:
24.5% of AGI
State:
20.3% of AGI
(% of AGI for various income ranges: 4.6% for AGIs $10k-25k, 7.9% for AGIs $25k-50k, 10.9% for AGIs $50k-75k, 9.8% for AGIs $75k-100k, 12.5% for AGIs over 100k)
Charity contributions deductions: $5,119 (8% of AGI, reported on 16.6% of returns)
Here:
$5,119
State:
$4,190
Here:
7.6% of AGI
State:
4.4% of AGI
(% of AGI for various income ranges: 1.7% for AGIs below $10k, 2.1% for AGIs $25k-50k, 2.6% for AGIs $50k-75k, 3.6% for AGIs $75k-100k, 4.0% for AGIs over 100k)
Total tax: $3,871 (reported on 72.2% of returns)
71238:
$3,871
State:
$6,529
(% of AGI for various income ranges: 3.5% for AGIs below $10k, 3.7% for AGIs $10k-25k, 5.7% for AGIs $25k-50k, 8.1% for AGIs $50k-75k, 10.8% for AGIs $75k-100k, 14.4% for AGIs over 100k)
Earned income credit: $1,774 (reported on 23.7% of returns)
Here:
$1,774
State:
$2,103
Percentage of individuals using paid preparers for their 2004 taxes: 63.8%
Here:
64%
State:
61%
(% for various income ranges: 52.8% for AGIs below $10k, 68.7% for AGIs $10k-25k, 64.4% for AGIs $25k-50k, 64.4% for AGIs $50k-75k, 70.5% for AGIs $75k-100k, 69.2% for AGIs over 100k)
Household received Food Stamps/SNAP in the past 12 months: 228 Household did not receive Food Stamps/SNAP in the past 12 months: 777
Women who had a birth in the past 12 months: 3 (0 now married, 3 unmarried) Women who did not have a birth in the past 12 months: 516 (240 now married, 274 unmarried)
Housing units in zip code 71238 with a mortgage: 350 (24 second mortgage, 22 both second mortgage and home equity loan) Houses without a mortgage: 15
Median monthly owner costs for units with a mortgage: $1,439 Median monthly owner costs for units without a mortgage: $331
Residents with income below the poverty level in 2022:
This zip code:
22.8%
Whole state:
18.6%
Residents with income below 50% of the poverty level in 2022:
This zip code:
13.2%
Whole state:
10.1%
Median number of rooms in houses and condos:
Here:
5.8
State:
6.2
Median number of rooms in apartments:
Here:
5.0
State:
4.4
Notable locations in this zip code not listed on our city pages
Churches in zip code 71238 include: Walnut Grove Church (A), Plum Hill Church (B), Salem Baptist Church (C), Robinson Chapel (D), Oak Grove Baptist Church (E), Frantom Chapel Methodist Church (F), Galilee Church (G), Mount Olive Church (H), Pine Grove Church (I). Display/hide their locations on the map
Cemeteries: Williams Cemetery (1), Eros Cemetery (2), Bethel Cemetery (3), Oak Ridge Cemetery (4), Bonett Cemetery (5), Frantom Chapel Cemetery (6), Henson Cemetery (7). Display/hide their locations on the map
Streams, rivers, and creeks: Dry Creek (A), Cub Creek (B), Collie Branch (C), Clear Branch (D), Bullard Branch (E), Taylor Branch (F), Pool Branch (G), Little Glade Creek (H), Hurricane Creek (I). Display/hide their locations on the map
Size of family households: 413 2-persons, 117 3-persons, 105 4-persons, 28 5-persons, 12 6-persons
Size of nonfamily households: 281 1-person, 37 2-persons, 6 3-persons
267 married couples with children.
155 single-parent households (78 men, 77 women).
97.8% of residents of 71238 zip code speak English at home.
1.5% of residents speak Spanish at home (100% very well).
1.0% of residents speak other Indo-European language at home (100% not well).
Foreign born population: 0 (0.0%)
:
0.0%
Whole state:
4.2%
25%American
23%English
10%Irish
5%European
4%Austrian
4%Scotch-Irish
3%Italian
Facilities with environmental interests located in this zip code:
PATRICK CONE ET AL 7 #2 ALT TANK BATTERY (OFF VERNON EROS RD 0.4 MI S in EROS, LA)
AIR MINOR (AIRS/AFS) Business SIC classification: CRUDE PETROLEUM AND NATURAL GAS
EROS SEWER FACILITY ( in 27950, LA)
National Pollutant Discharge Elimination System NON-MAJOR (Tracking pollutant discharge elimination systems) - permit Business SIC classification: SEWERAGE SYSTEMS Alternative names: EROS, TOWN OF, EROS, TOWN OF-EROS SEWER
ERW CORP 8-1 TANK BATTERY - VERNON FIELD (4.25 MI W OF in EROS, LA)
AIR MINOR (AIRS/AFS) Business SIC classification: CRUDE PETROLEUM AND NATURAL GAS Alternative names: ANADARKO ERW CORP 8-
Housing units lacking complete plumbing facilities: 1.5% Housing units lacking complete kitchen facilities: 3.0%
74.0%Electricity
11.2%Bottled, tank, or LP gas
10.8%Utility gas
3.4%Wood
0.6%No fuel used
Population in 1990: 2,296. Population change in the 1990s: +87 (+3.8%).
Place of birth for U.S.-born residents:
This state: 1,966
Northeast: 50
Midwest: 35
South: 175
West: 52
64% of the 71238 zip code residents lived in the same house 5 years ago. Out of people who lived in different houses, 61% lived in this county. Out of people who lived in different counties, 50% lived in Louisiana.
95% of the 71238 zip code residents lived in the same house 1 year ago. Out of people who lived in different houses, 37% moved from this county. Out of people who lived in different houses, 43% moved from different county within same state. Out of people who lived in different houses, 23% moved from different state.
Private vs. public school enrollment:
Students in private schools in grades 1 to 8 (elementary and middle school): 84
Here:
34.0%
Louisiana:
19.6%
Students in private schools in grades 9 to 12 (high school): 12
Here:
11.4%
Louisiana:
18.3%
Students in private undergraduate colleges:
Here:
0.0%
Louisiana:
17.4%
Occupation by median earnings in the past 12 months ($)
78,097Transportation occupations
73,668Production occupations
73,439Health technologists and technicians
63,967Management occupations
49,359Business and financial operations occupations
46,260Legal occupations
Top industries in this zip code by the number of employees in 2005:
Other Services (except Public Administration): Religious Organizations (5-9 employees: 2 establishments)
Construction: Painting and Wall Covering Contractors (5-9: 1)
Administrative and Support and Waste Management and Remediation Services: Solid Waste Collection (1-4: 1)
Construction: Roofing Contractors (1-4: 1)
Mining: Drilling Oil and Gas Wells (1-4: 1)
Administrative and Support and Waste Management and Remediation Services: All Other Support Services (1-4: 1)
Health Care and Social Assistance: Home Health Care Services (1-4: 1)
Other Services (except Public Administration): Linen Supply (1-4: 1)
Administrative and Support and Waste Management and Remediation Services: Landscaping Services (1-4: 1)
Home Mortgage Disclosure Act Aggregated Statistics For Year 2009 (Based on 8 partial tracts)
A) FHA, FSA/RHS & VA Home Purchase Loans
B) Conventional Home Purchase Loans
C) Refinancings
D) Home Improvement Loans
F) Non-occupant Loans on < 5 Family Dwellings (A B C & D)
G) Loans On Manufactured Home Dwelling (A B C & D)
Number
Average Value
Number
Average Value
Number
Average Value
Number
Average Value
Number
Average Value
Number
Average Value
LOANS ORIGINATED
40
$149,370
34
$107,161
115
$132,171
15
$45,203
15
$79,625
25
$47,550
APPLICATIONS APPROVED, NOT ACCEPTED
1
$68,690
4
$84,818
5
$159,208
0
$0
0
$0
4
$39,440
APPLICATIONS DENIED
12
$147,359
14
$68,981
44
$133,255
4
$38,282
2
$51,200
17
$57,690
APPLICATIONS WITHDRAWN
3
$137,487
4
$113,060
26
$155,498
0
$0
1
$75,110
3
$110,260
FILES CLOSED FOR INCOMPLETENESS
2
$161,355
2
$101,335
12
$127,027
1
$55,960
0
$0
1
$46,460
Aggregated Statistics For Year 2008 (Based on 8 partial tracts)
A) FHA, FSA/RHS & VA Home Purchase Loans
B) Conventional Home Purchase Loans
C) Refinancings
D) Home Improvement Loans
E) Loans on Dwellings For 5+ Families
F) Non-occupant Loans on < 5 Family Dwellings (A B C & D)
G) Loans On Manufactured Home Dwelling (A B C & D)
Number
Average Value
Number
Average Value
Number
Average Value
Number
Average Value
Number
Average Value
Number
Average Value
Number
Average Value
LOANS ORIGINATED
36
$138,256
47
$115,802
100
$118,668
17
$46,249
1
$286,850
20
$107,352
38
$46,682
APPLICATIONS APPROVED, NOT ACCEPTED
3
$114,637
11
$67,347
12
$120,291
1
$23,120
0
$0
1
$66,490
12
$56,306
APPLICATIONS DENIED
10
$147,475
29
$59,020
40
$118,061
12
$36,157
0
$0
3
$74,277
32
$51,652
APPLICATIONS WITHDRAWN
3
$161,500
5
$149,288
22
$154,350
0
$0
0
$0
0
$0
1
$41,030
FILES CLOSED FOR INCOMPLETENESS
1
$170,440
2
$153,570
9
$131,067
1
$14,730
0
$0
1
$47,710
1
$53,830
Aggregated Statistics For Year 2007 (Based on 8 partial tracts)
A) FHA, FSA/RHS & VA Home Purchase Loans
B) Conventional Home Purchase Loans
C) Refinancings
D) Home Improvement Loans
F) Non-occupant Loans on < 5 Family Dwellings (A B C & D)
G) Loans On Manufactured Home Dwelling (A B C & D)
Number
Average Value
Number
Average Value
Number
Average Value
Number
Average Value
Number
Average Value
Number
Average Value
LOANS ORIGINATED
17
$114,094
77
$110,362
85
$105,035
21
$42,499
22
$63,657
37
$49,919
APPLICATIONS APPROVED, NOT ACCEPTED
1
$74,250
15
$69,274
15
$92,684
6
$25,605
1
$184,270
12
$52,790
APPLICATIONS DENIED
5
$117,866
42
$59,316
62
$113,793
18
$38,577
3
$38,847
44
$43,889
APPLICATIONS WITHDRAWN
1
$62,430
8
$83,985
23
$135,430
4
$39,592
2
$115,150
5
$56,552
FILES CLOSED FOR INCOMPLETENESS
0
$0
3
$103,550
7
$158,823
1
$90,120
1
$114,270
0
$0
Aggregated Statistics For Year 2006 (Based on 8 partial tracts)
A) FHA, FSA/RHS & VA Home Purchase Loans
B) Conventional Home Purchase Loans
C) Refinancings
D) Home Improvement Loans
F) Non-occupant Loans on < 5 Family Dwellings (A B C & D)
G) Loans On Manufactured Home Dwelling (A B C & D)
Number
Average Value
Number
Average Value
Number
Average Value
Number
Average Value
Number
Average Value
Number
Average Value
LOANS ORIGINATED
20
$105,856
84
$93,953
95
$103,817
18
$42,081
15
$53,551
47
$45,288
APPLICATIONS APPROVED, NOT ACCEPTED
1
$38,970
25
$61,906
16
$117,259
1
$14,840
2
$40,640
21
$39,033
APPLICATIONS DENIED
10
$79,952
44
$58,485
45
$98,533
10
$39,204
3
$54,240
44
$41,542
APPLICATIONS WITHDRAWN
3
$109,083
10
$89,160
35
$121,204
4
$60,282
1
$77,540
6
$92,108
FILES CLOSED FOR INCOMPLETENESS
1
$46,530
3
$111,693
10
$124,267
0
$0
1
$55,960
1
$46,530
Aggregated Statistics For Year 2005 (Based on 8 partial tracts)
A) FHA, FSA/RHS & VA Home Purchase Loans
B) Conventional Home Purchase Loans
C) Refinancings
D) Home Improvement Loans
F) Non-occupant Loans on < 5 Family Dwellings (A B C & D)
G) Loans On Manufactured Home Dwelling (A B C & D)
Number
Average Value
Number
Average Value
Number
Average Value
Number
Average Value
Number
Average Value
Number
Average Value
LOANS ORIGINATED
14
$117,352
87
$106,656
110
$96,022
25
$33,019
18
$61,081
34
$42,326
APPLICATIONS APPROVED, NOT ACCEPTED
3
$61,880
25
$76,417
27
$87,008
2
$45,660
1
$63,400
19
$46,078
APPLICATIONS DENIED
7
$61,033
47
$49,384
84
$101,666
15
$20,893
6
$43,350
49
$42,892
APPLICATIONS WITHDRAWN
0
$0
9
$81,307
40
$114,352
5
$120,130
2
$49,865
7
$53,060
FILES CLOSED FOR INCOMPLETENESS
1
$148,810
5
$120,216
11
$116,200
1
$19,440
0
$0
1
$50,430
Aggregated Statistics For Year 2004 (Based on 8 partial tracts)
A) FHA, FSA/RHS & VA Home Purchase Loans
B) Conventional Home Purchase Loans
C) Refinancings
D) Home Improvement Loans
F) Non-occupant Loans on < 5 Family Dwellings (A B C & D)
G) Loans On Manufactured Home Dwelling (A B C & D)
Number
Average Value
Number
Average Value
Number
Average Value
Number
Average Value
Number
Average Value
Number
Average Value
LOANS ORIGINATED
14
$96,864
86
$93,975
123
$92,072
18
$35,162
15
$84,588
40
$40,187
APPLICATIONS APPROVED, NOT ACCEPTED
2
$101,885
13
$98,988
30
$93,989
3
$21,127
1
$11,780
8
$39,934
APPLICATIONS DENIED
4
$67,435
28
$57,959
70
$90,055
12
$20,195
1
$5,890
31
$43,003
APPLICATIONS WITHDRAWN
2
$84,520
9
$112,714
40
$124,494
2
$56,485
1
$9,420
4
$64,948
FILES CLOSED FOR INCOMPLETENESS
1
$59,520
2
$116,915
3
$124,080
2
$41,945
0
$0
1
$16,490
Aggregated Statistics For Year 2003 (Based on 8 partial tracts)
A) FHA, FSA/RHS & VA Home Purchase Loans
B) Conventional Home Purchase Loans
C) Refinancings
D) Home Improvement Loans
F) Non-occupant Loans on < 5 Family Dwellings (A B C & D)
Number
Average Value
Number
Average Value
Number
Average Value
Number
Average Value
Number
Average Value
LOANS ORIGINATED
11
$108,659
99
$94,484
215
$102,888
16
$30,669
19
$67,093
APPLICATIONS APPROVED, NOT ACCEPTED
0
$0
17
$67,404
32
$114,402
2
$26,420
1
$112,430
APPLICATIONS DENIED
4
$73,602
38
$42,195
61
$90,789
9
$27,624
2
$53,875
APPLICATIONS WITHDRAWN
1
$100,720
7
$81,123
37
$97,989
1
$9,420
1
$49,450
FILES CLOSED FOR INCOMPLETENESS
0
$0
2
$157,325
4
$83,395
1
$67,330
0
$0
Aggregated Statistics For Year 2002 (Based on 8 partial tracts)
A) FHA, FSA/RHS & VA Home Purchase Loans
B) Conventional Home Purchase Loans
C) Refinancings
D) Home Improvement Loans
F) Non-occupant Loans on < 5 Family Dwellings (A B C & D)
Number
Average Value
Number
Average Value
Number
Average Value
Number
Average Value
Number
Average Value
LOANS ORIGINATED
15
$66,011
74
$85,938
150
$98,856
19
$27,074
15
$57,840
APPLICATIONS APPROVED, NOT ACCEPTED
1
$15,900
26
$57,155
34
$84,484
3
$22,470
0
$0
APPLICATIONS DENIED
1
$38,870
46
$43,341
58
$75,880
8
$16,359
3
$37,367
APPLICATIONS WITHDRAWN
1
$31,810
5
$83,290
22
$83,533
3
$25,123
2
$45,645
FILES CLOSED FOR INCOMPLETENESS
1
$41,230
2
$96,005
10
$92,677
0
$0
0
$0
Aggregated Statistics For Year 2001 (Based on 8 partial tracts)
A) FHA, FSA/RHS & VA Home Purchase Loans
B) Conventional Home Purchase Loans
C) Refinancings
D) Home Improvement Loans
F) Non-occupant Loans on < 5 Family Dwellings (A B C & D)
Number
Average Value
Number
Average Value
Number
Average Value
Number
Average Value
Number
Average Value
LOANS ORIGINATED
12
$85,952
88
$77,421
170
$88,107
24
$23,832
8
$43,469
APPLICATIONS APPROVED, NOT ACCEPTED
3
$75,590
18
$47,522
31
$69,676
4
$26,112
2
$35,000
APPLICATIONS DENIED
3
$58,067
58
$41,197
67
$68,904
8
$23,130
5
$42,246
APPLICATIONS WITHDRAWN
1
$103,330
4
$106,945
37
$87,485
0
$0
2
$107,785
FILES CLOSED FOR INCOMPLETENESS
0
$0
0
$0
9
$97,703
1
$32,400
0
$0
Aggregated Statistics For Year 2000 (Based on 8 partial tracts)
A) FHA, FSA/RHS & VA Home Purchase Loans
B) Conventional Home Purchase Loans
C) Refinancings
D) Home Improvement Loans
E) Loans on Dwellings For 5+ Families
F) Non-occupant Loans on < 5 Family Dwellings (A B C & D)
Number
Average Value
Number
Average Value
Number
Average Value
Number
Average Value
Number
Average Value
Number
Average Value
LOANS ORIGINATED
15
$84,751
85
$63,101
65
$84,092
25
$17,219
1
$854,050
10
$42,882
APPLICATIONS APPROVED, NOT ACCEPTED
2
$42,825
24
$44,997
23
$54,785
6
$52,797
0
$0
2
$57,180
APPLICATIONS DENIED
2
$48,300
88
$35,136
62
$57,353
8
$18,768
0
$0
3
$37,940
APPLICATIONS WITHDRAWN
0
$0
5
$95,228
36
$57,678
1
$42,330
0
$0
0
$0
FILES CLOSED FOR INCOMPLETENESS
1
$57,130
1
$264,240
6
$80,198
0
$0
0
$0
0
$0
Aggregated Statistics For Year 1999 (Based on 4 partial tracts)
A) FHA, FSA/RHS & VA Home Purchase Loans
B) Conventional Home Purchase Loans
C) Refinancings
D) Home Improvement Loans
F) Non-occupant Loans on < 5 Family Dwellings (A B C & D)
Detailed PMIC statistics for the following Tracts:0104.00
, 0105.01
2002 - 2018 National Fire Incident Reporting System (NFIRS) incidents
Based on the data from the years 2002 - 2018 the average number of fires per year is 11. The highest number of fire incidents - 34 took place in 2014, and the least - 1 in 2006. The data has a growing trend.
When looking into fire subcategories, the most incidents belonged to: Outside Fires (70.2%), and Structure Fires (20.2%).
Fire incident types reported to NFIRS in Zip Code 71238


 Nearest zip codes: 71226, 71225, 71292, 71227, 71234, 71291.


 Based on the data from the years 2002 - 2018 the average number of fires per year is 11. The highest number of fire incidents - 34 took place in 2014, and the least - 1 in 2006. The data has a growing trend.
 When looking into fire subcategories, the most incidents belonged to: Outside Fires (70.2%), and Structure Fires (20.2%).