Estimated zip code population in 2022: 2,038 Zip code population in 2010: 1,897 Zip code population in 2000: 1,871
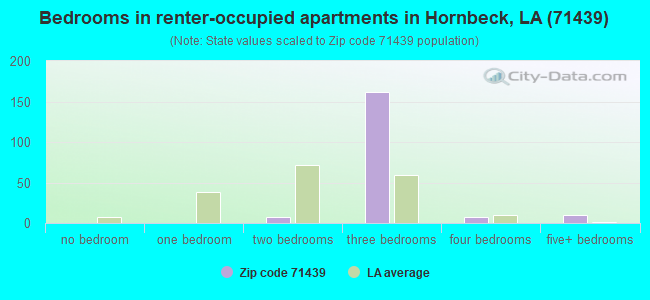
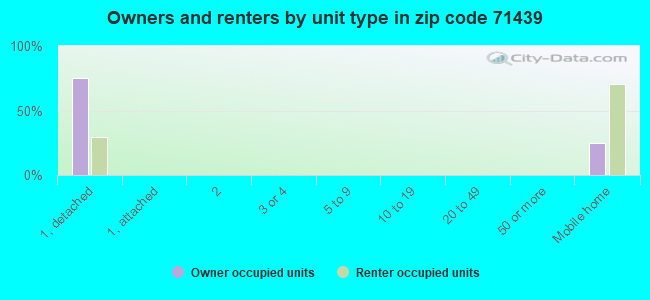
Houses and condos: 865 Renter-occupied apartments: 187
% of renters here:
28%
State:
32%
March 2022 cost of living index in zip code 71439: 79.9 (low, U.S. average is 100)
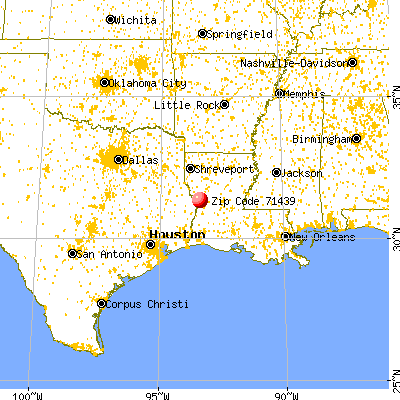
Land area: 53.9 sq. mi. Water area: 0.4 sq. mi.
Population density: 38 people per square mile
(very low).
OSM Map
General Map
Google Map
MSN Map
OSM Map
General Map
Google Map
MSN Map
OSM Map
General Map
Google Map
MSN Map
OSM Map
General Map
Google Map
MSN Map
Please wait while loading the map...
Real estate property taxes paid for housing units in 2022:
This zip code:
0.2% ($206)
Louisiana:
0.5% ($1,127)
Median real estate property taxes paid for housing units with mortgages in 2022: $642 (0.4%) Median real estate property taxes paid for housing units with no mortgage in 2022: $207 (0.2%)
Business Search- 14 Million verified businesses
Males: 982
(48.2%)
Females: 1,056
(51.8%)
For population 25 years and over in 71439:
High school or higher: 85.4%
Bachelor's degree or higher: 8.8%
Graduate or professional degree: 3.9%
Unemployed: 1.8%
Mean travel time to work (commute): 34.4 minutes
For population 15 years and over in 71439:
Never married: 26.3%
Now married: 42.6%
Separated: 2.9%
Widowed: 5.4%
Divorced: 22.8%
Zip code 71439 compared to state average:
Median house value below state average.
Unemployed percentage significantly below state average.
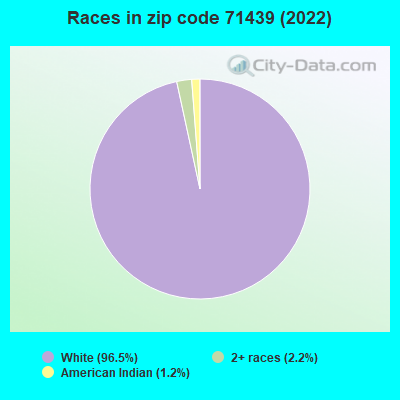
Black race population percentage significantly below state average.
Hispanic race population percentage significantly below state average.
Median age significantly below state average.
Foreign-born population percentage significantly below state average.
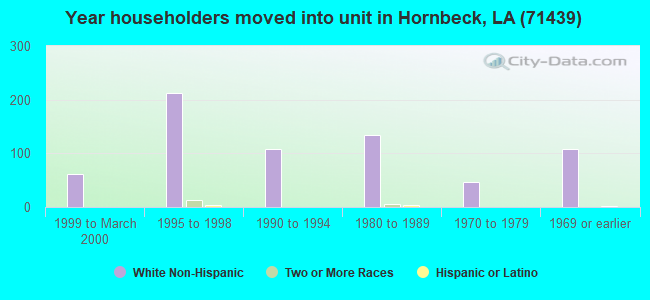
Length of stay since moving in significantly above state average.
Number of college students significantly below state average.
Percentage of population with a bachelor's degree or higher significantly below state average.
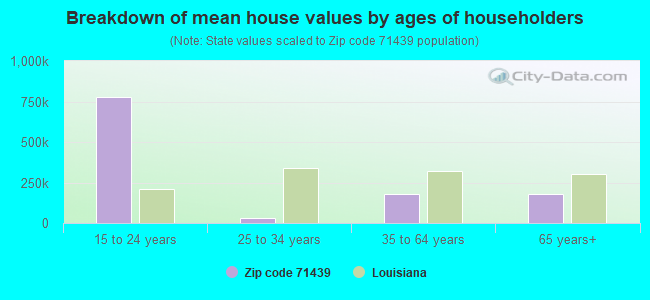
Estimated median house/condo value in 2022: $110,033
71439:
$110,033
Louisiana:
$209,200
According to our research of Louisiana and other state lists, there were 4 registered sex offenders living in 71439 zip code as of May 28, 2024. The ratio of all residents to sex offenders in zip code 71439 is 441 to 1. The ratio of registered sex offenders to all residents in this zip code is near the state average.
Median resident age:
This zip code:
29.5 years
Louisiana median age:
38.2 years
Average household size:
This zip code:
3.1 people
Louisiana:
2.5 people
Averages for the 2020 tax year for zip code 71439, filed in 2021:
Average Adjusted Gross Income (AGI) in 2020: $53,008 (Individual Income Tax Returns)
Here:
$53,008
State:
$60,757
Salary/wage: $49,133 (reported on 78.9% of returns)
Here:
$49,133
State:
$50,882
(% of AGI for various income ranges: 1126.3% for AGIs below $25k, 3115.3% for AGIs $25k-50k, 5243.0% for AGIs $50k-75k, 9130.0% for AGIs $75k-100k, 16175.7% for AGIs $100k-200k)
Taxable interest for individuals: $375 (reported on 26.3% of returns)
This zip code:
$375
Louisiana:
$1,576
(% of AGI for various income ranges: 3.7% for AGIs below $25k, 11.2% for AGIs $25k-50k, 27.0% for AGIs $50k-75k, 13.3% for AGIs $75k-100k, 20.0% for AGIs $100k-200k)
Ordinary dividends: $783 (reported on 7.9% of returns)
Here:
$783
State:
$7,743
(% of AGI for various income ranges: 6.3% for AGIs below $25k, 14.0% for AGIs $50k-75k, 30.0% for AGIs $100k-200k)
Net capital gain/loss in AGI: +$4,817 (reported on 7.9% of returns)
Here:
+$4,817
State:
+$16,917
(% of AGI for various income ranges: 6.3% for AGIs below $25k, 36.0% for AGIs $50k-75k, 344.3% for AGIs $100k-200k)
Profit/loss from business: +$4,429 (reported on 9.2% of returns)
Here:
+$4,429
State:
+$7,679
(% of AGI for various income ranges: 135.8% for AGIs below $25k, 30.6% for AGIs $25k-50k)
Taxable individual retirement arrangement distribution: $12,040 (reported on 6.6% of returns)
71439:
$12,040
Louisiana:
$20,716
(% of AGI for various income ranges: 602.0% for AGIs $50k-75k)
Earned income credit: $2,280 (reported on 19.7% of returns)
Here:
$2,280
State:
$2,671
(% of AGI for various income ranges: 109.5% for AGIs below $25k, 78.8% for AGIs $25k-50k)
Percentage of individuals using paid preparers for their 2020 taxes: 97.4%
Here:
97%
State:
92%
(% for various income ranges: 96.0% for AGIs below $25k, 100.0% for AGIs $25k-50k, 91.7% for AGIs $50k-75k, 100.0% for AGIs $75k-100k, 100.0% for AGIs $100k-200k)
Averages for the 2012 tax year for zip code 71439, filed in 2013:
Average Adjusted Gross Income (AGI) in 2012: $52,549 (Individual Income Tax Returns)
Here:
$52,549
State:
$56,730
Salary/wage: $45,212 (reported on 86.7% of returns)
Here:
$45,212
State:
$45,545
(% of AGI for various income ranges: 76.8% for AGIs below $25k, 81.8% for AGIs $25k-50k, 73.2% for AGIs $50k-75k, 80.4% for AGIs $75k-100k, 68.9% for AGIs $100k-200k)
Taxable interest for individuals: $350 (reported on 29.3% of returns)
This zip code:
$350
Louisiana:
$1,804
(% of AGI for various income ranges: 0.4% for AGIs below $25k, 0.3% for AGIs $25k-50k, 0.2% for AGIs $50k-75k, 0.2% for AGIs $75k-100k, 0.1% for AGIs $100k-200k)
Ordinary dividends: $612 (reported on 10.7% of returns)
Here:
$612
State:
$7,610
Profit/loss from business: +$3,589 (reported on 12.0% of returns)
Here:
+$3,589
State:
+$12,088
(% of AGI for various income ranges: 3.0% for AGIs below $25k, 2.5% for AGIs $25k-50k, 0.8% for AGIs $75k-100k)
Taxable individual retirement arrangement distribution: $9,925 (reported on 5.3% of returns)
71439:
$9,925
Louisiana:
$16,085
Total itemized deductions: $19,227 (20% of AGI, reported on 14.7% of returns)
Here:
$19,227
State:
$23,585
Here:
19.5% of AGI
State:
18.1% of AGI
(% of AGI for various income ranges: 10.0% for AGIs $25k-50k, 7.1% for AGIs $75k-100k, 6.5% for AGIs $100k-200k)
Charity contributions: $5,843 (reported on 9.3% of returns)
Here:
$5,843
State:
$5,533
Taxes paid: $3,610 (reported on 13.3% of returns)
71439:
$3,610
State:
$6,282
(% of AGI for various income ranges: 1.1% for AGIs $25k-50k, 1.1% for AGIs $75k-100k, 1.4% for AGIs $100k-200k)
Earned income credit: $2,013 (reported on 20.0% of returns)
Here:
$2,013
State:
$2,633
(% of AGI for various income ranges: 6.6% for AGIs below $25k, 1.1% for AGIs $25k-50k)
Percentage of individuals using paid preparers for their 2012 taxes: 64.0%
Here:
64%
State:
57%
(% for various income ranges: 51.9% for AGIs below $25k, 66.7% for AGIs $25k-50k, 75.0% for AGIs $50k-75k, 75.0% for AGIs $75k-100k, 70.0% for AGIs $100k-200k)
Averages for the 2004 tax year for zip code 71439, filed in 2005:
Average Adjusted Gross Income (AGI) in 2004: $34,897 (Individual Income Tax Returns)
Here:
$34,897
State:
$39,411
Salary/wage: $32,090 (reported on 87.2% of returns)
Here:
$32,090
State:
$34,434
(% of AGI for various income ranges: 95.5% for AGIs below $10k, 74.9% for AGIs $10k-25k, 83.4% for AGIs $25k-50k, 76.2% for AGIs $50k-75k, 93.5% for AGIs $75k-100k, 63.5% for AGIs over 100k)
Taxable interest for individuals: $525 (reported on 32.0% of returns)
This zip code:
$525
Louisiana:
$1,606
(% of AGI for various income ranges: 1.0% for AGIs below $10k, 1.0% for AGIs $10k-25k, 0.4% for AGIs $25k-50k, 0.4% for AGIs $50k-75k, 0.3% for AGIs $75k-100k, 0.2% for AGIs over 100k)
Taxable dividends: $690 (reported on 10.2% of returns)
Here:
$690
State:
$3,235
(% of AGI for various income ranges: 1.5% for AGIs below $10k, 0.3% for AGIs $25k-50k, 0.1% for AGIs $50k-75k, 0.2% for AGIs $75k-100k)
Net capital gain/loss: +$396 (reported on 7.6% of returns)
Here:
+$396
State:
+$8,531
Profit/loss from business: +$5,069 (reported on 12.5% of returns)
Here:
+$5,069
State:
+$9,128
(% of AGI for various income ranges: 8.3% for AGIs below $10k, 6.4% for AGIs $10k-25k, 1.9% for AGIs $25k-50k, 0.5% for AGIs $50k-75k)
Total itemized deductions: $13,523 (21% of AGI, reported on 12.3% of returns)
Here:
$13,523
State:
$18,222
Here:
21.4% of AGI
State:
20.3% of AGI
Charity contributions deductions: $4,409 (7% of AGI, reported on 9.5% of returns)
Here:
$4,409
State:
$4,190
Here:
6.9% of AGI
State:
4.4% of AGI
Total tax: $3,818 (reported on 71.9% of returns)
71439:
$3,818
State:
$6,529
(% of AGI for various income ranges: 2.2% for AGIs below $10k, 3.5% for AGIs $10k-25k, 6.1% for AGIs $25k-50k, 8.5% for AGIs $50k-75k, 10.9% for AGIs $75k-100k, 16.5% for AGIs over 100k)
Earned income credit: $1,911 (reported on 19.4% of returns)
Here:
$1,911
State:
$2,103
Percentage of individuals using paid preparers for their 2004 taxes: 66.9%
Here:
67%
State:
61%
(% for various income ranges: 61.8% for AGIs below $10k, 70.9% for AGIs $10k-25k, 64.4% for AGIs $25k-50k, 70.2% for AGIs $50k-75k, 67.6% for AGIs $75k-100k, 68.8% for AGIs over 100k)
Household received Food Stamps/SNAP in the past 12 months: 173 Household did not receive Food Stamps/SNAP in the past 12 months: 496
Women who had a birth in the past 12 months: 19 (18 now married, 0 unmarried) Women who did not have a birth in the past 12 months: 380 (144 now married, 236 unmarried)
Housing units in zip code 71439 with a mortgage: 143 Median monthly owner costs for units with a mortgage: $1,112 Median monthly owner costs for units without a mortgage: $323
Residents with income below the poverty level in 2022:
This zip code:
38.0%
Whole state:
18.6%
Residents with income below 50% of the poverty level in 2022:
This zip code:
34.1%
Whole state:
10.1%
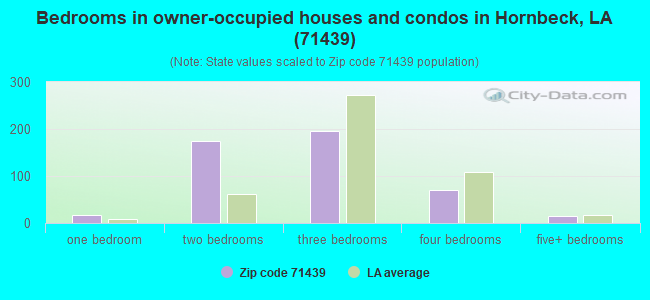
Median number of rooms in houses and condos:
Here:
5.9
State:
6.2
Median number of rooms in apartments:
Here:
4.7
State:
4.4
Notable locations in this zip code not listed on our city pages
Churches in zip code 71439 include: Union Grove Church (A), Toro Missionary Baptist Church (B), Pruitts Chapel (C), New Pleasant View Church (D), Pleasant View Church (E), First Baptist Church (F), Hornbeck United Methodist Church (G), Plainview Baptist Church (H). Display/hide their locations on the map
Streams, rivers, and creeks: Coon Branch (A), Brushy Creek (B), Everette Branch (C), Ade Branch (D), Elder Branch (E), White House Branch (F), Swenley Branch (G), Sip Branch (H), Mill Creek (I). Display/hide their locations on the map
Size of family households: 184 2-persons, 133 3-persons, 54 4-persons, 18 5-persons, 22 7-or-more-persons
Size of nonfamily households: 236 1-person, 9 2-persons
107 married couples with children.
201 single-parent households (23 men, 178 women).
99.3% of residents of 71439 zip code speak English at home.
0.3% of residents speak other Indo-European language at home (100% very well).
0.2% of residents speak Asian or Pacific Island language at home (100% very well).
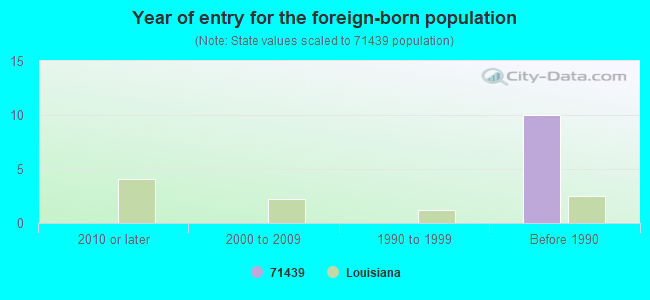
Foreign born population: 0 (0.0%)
:
0.0%
Whole state:
4.2%
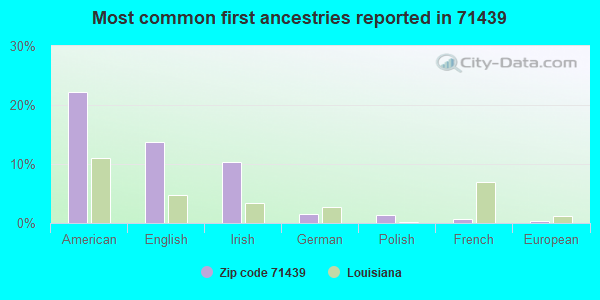
22%American
14%English
10%Irish
2%German
1%Polish
1%French
0%European
Year of entry for the foreign-born population
02010 or later
02000 to 2009
01990 to 1999
10Before 1990
Facilities with environmental interests located in this zip code:
HORNBECK HIGH SCHOOL (2363 STILLWELL AVENUE in HORNBECK, LA)
(National Center for Education Statistics) - STATE ID-058005 Organizations: VERNON PARISH SCHOOL BOARD (SCHOOL DISTRICT)
MITCHELL BORROW PIT (166 SHORTY POSTOTON RD in HORNBECK, LA)
National Pollutant Discharge Elimination System NON-MAJOR (Tracking pollutant discharge elimination systems) - permit Alternative names: DENTON-JAMES, LLC
Housing units lacking complete plumbing facilities: 11.0% Housing units lacking complete kitchen facilities: 0.8%
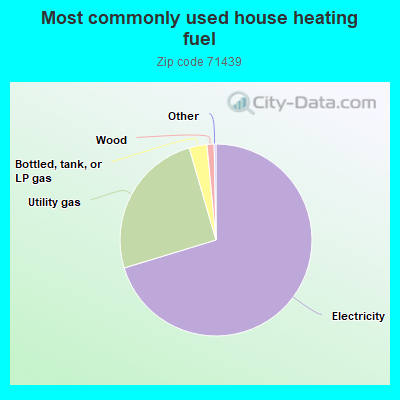
70.5%Electricity
25.3%Utility gas
3.0%Bottled, tank, or LP gas
1.2%Wood
Population in 1990: 1,352. Population change in the 1990s: +519 (+38.4%).
Place of birth for U.S.-born residents:
This state: 1,463
Northeast: 78
Midwest: 93
South: 358
West: 41
70% of the 71439 zip code residents lived in the same house 5 years ago. Out of people who lived in different houses, 55% lived in this county. Out of people who lived in different counties, 50% lived in Louisiana.
90% of the 71439 zip code residents lived in the same house 1 year ago. Out of people who lived in different houses, 50% moved from this county. Out of people who lived in different houses, 3% moved from different county within same state. Out of people who lived in different houses, 44% moved from different state.
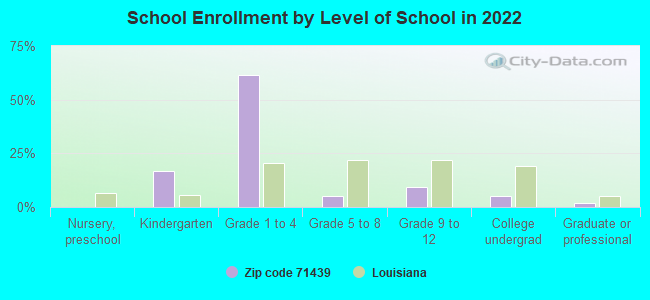
Private vs. public school enrollment:
Students in private schools in grades 1 to 8 (elementary and middle school):
Here:
0.4%
Louisiana:
19.6%
Students in private schools in grades 9 to 12 (high school): 8
Here:
23.1%
Louisiana:
18.3%
Students in private undergraduate colleges:
Here:
0.0%
Louisiana:
17.4%
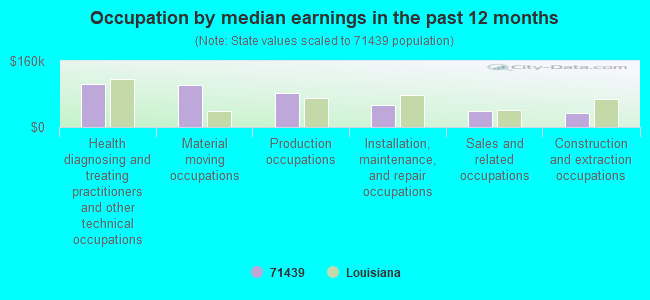
Occupation by median earnings in the past 12 months ($)
103,758Health diagnosing and treating practitioners and other technical occupations
101,870Material moving occupations
81,352Production occupations
52,943Installation, maintenance, and repair occupations
37,792Sales and related occupations
33,037Construction and extraction occupations
Companies with federal contracts located in this zip code:
NEAL, CHARLES (2625 DAISY STREET in HORNBECK, LA; small business) : $149,160 in 3 contractsin 2005
$109,200 with Federal Emergency Management Agency for Lease or Rental of Equipment -- Ground Effect Vehicles, Motor Vehicles, Trailers, and Cycles. Signed on 2005-10-21. Effective on 2005-09-16. Completion date: 2006-03-15.
$24,960, same as above.Signed on 2005-12-05. Effective on 2005-11-26. Completion date: 2006-11-25.
$15,000, same as above.Signed on 2005-10-23. Effective on 2005-09-12. Completion date: 2006-03-11.
BAGGS BETTER BUILT (1450 JETT RD in HORNBECK, LA; small business)
$12,400 with Army for Prefabricated and Portable Buildings. Signed on 2004-02-26. Completion date: 2004-03-05.
MARY A SEMONS (126 VALLY ELECTRIC RD in HORNBECK, LA; small business) : $8,060 in 6 contractsfrom 2001 to 2003
Contracts for Custodial Janitorial Services by Army Signed by year:2000: $0; 2001: $0; 2002: $9,000; 2003: -$940; 2004: $0; 2005: $0; 2006: $0.
Biggest contracts:
$4,500 with Army for Custodial Janitorial Services. Signed on 2002-09-21. Completion date: 2002-08-31.
$4,500, same as above.Signed on 2001-10-31. Completion date: 2002-08-31.
$3,750, same as above.Signed on 2002-01-24. Completion date: 2002-08-31.
$750, same as above.Signed on 2002-01-02. Completion date: 2002-08-31.
Top industries in this zip code by the number of employees in 2005:
Utilities: Electric Power Distribution (20-49 employees: 1 establishment)
Other Services (except Public Administration): Religious Organizations (1-4: 2)
Wholesale Trade: Industrial Machinery and Equipment Merchant Wholesalers (1-4: 1)
Wholesale Trade: Other Miscellaneous Durable Goods Merchant Wholesalers (1-4: 1)
Professional, Scientific, and Technical Services: Marketing Consulting Services (1-4: 1)
People in group quarters in 2010:
5 people in group homes intended for adults
2002 - 2018 National Fire Incident Reporting System (NFIRS) incidents
Based on the data from the years 2002 - 2018 the average number of fire incidents per year is 7. The highest number of reported fires - 25 took place in 2015, and the least - 0 in 2004. The data has an increasing trend.
When looking into fire subcategories, the most reports belonged to: Outside Fires (55.7%), and Structure Fires (33.6%).
Fire incident types reported to NFIRS in Zip Code 71439


 Nearest zip codes: 71429, 71403, 71426, 71449, 71461, 71446.
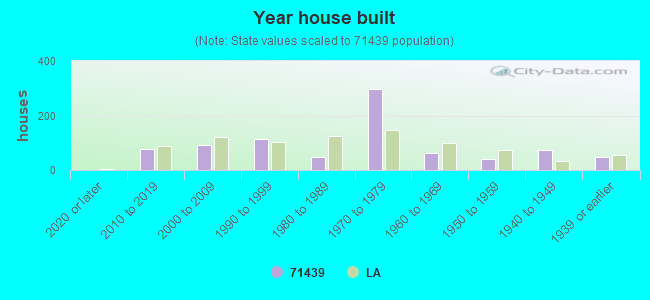


 Based on the data from the years 2002 - 2018 the average number of fire incidents per year is 7. The highest number of reported fires - 25 took place in 2015, and the least - 0 in 2004. The data has an increasing trend.
 When looking into fire subcategories, the most reports belonged to: Outside Fires (55.7%), and Structure Fires (33.6%).