Averages for the 2020 tax year for zip code 71447, filed in 2021:
Average Adjusted Gross Income (AGI) in 2020: $52,164 (Individual Income Tax Returns)
Here:
$52,164
State:
$60,757
Salary/wage: $48,241 (reported on 82.1% of returns)
Here:
$48,241
State:
$50,882
(% of AGI for various income ranges: 1138.7% for AGIs below $25k, 3691.7% for AGIs $25k-50k, 6351.4% for AGIs $50k-75k, 9140.0% for AGIs $75k-100k, 19877.5% for AGIs $100k-200k)
Taxable interest for individuals: $362 (reported on 23.2% of returns)
This zip code:
$362
Louisiana:
$1,576
(% of AGI for various income ranges: 12.7% for AGIs below $25k, 5.0% for AGIs $25k-50k, 17.1% for AGIs $50k-75k, 25.0% for AGIs $100k-200k)
Ordinary dividends: $1,033 (reported on 5.4% of returns)
Here:
$1,033
State:
$7,743
(% of AGI for various income ranges: 44.3% for AGIs $50k-75k)
Net capital gain/loss in AGI: +$2,333 (reported on 5.4% of returns)
Here:
+$2,333
State:
+$16,917
(% of AGI for various income ranges: 100.0% for AGIs $50k-75k)
Profit/loss from business: +$243 (reported on 12.5% of returns)
Here:
+$243
State:
+$7,679
(% of AGI for various income ranges: 63.3% for AGIs below $25k)
Taxable individual retirement arrangement distribution: $7,850 (reported on 3.6% of returns)
71447:
$7,850
Louisiana:
$20,716
(% of AGI for various income ranges: 104.7% for AGIs below $25k)
Earned income credit: $2,350 (reported on 21.4% of returns)
Here:
$2,350
State:
$2,671
(% of AGI for various income ranges: 127.3% for AGIs below $25k, 75.8% for AGIs $25k-50k)
Percentage of individuals using paid preparers for their 2020 taxes: 91.1%
Here:
91%
State:
92%
(% for various income ranges: 95.0% for AGIs below $25k, 86.7% for AGIs $25k-50k, 90.0% for AGIs $50k-75k, 100.0% for AGIs $75k-100k, 83.3% for AGIs $100k-200k)
Averages for the 2012 tax year for zip code 71447, filed in 2013:
Average Adjusted Gross Income (AGI) in 2012: $41,538 (Individual Income Tax Returns)
Here:
$41,538
State:
$56,730
Salary/wage: $38,577 (reported on 85.5% of returns)
Here:
$38,577
State:
$45,545
(% of AGI for various income ranges: 74.8% for AGIs below $25k, 80.6% for AGIs $25k-50k, 91.0% for AGIs $50k-75k, 93.1% for AGIs $75k-100k, 59.0% for AGIs $100k-200k)
Taxable interest for individuals: $467 (reported on 27.3% of returns)
This zip code:
$467
Louisiana:
$1,804
(% of AGI for various income ranges: 0.6% for AGIs below $25k, 0.5% for AGIs $25k-50k, 0.2% for AGIs $50k-75k, 0.3% for AGIs $75k-100k)
Ordinary dividends: $975 (reported on 7.3% of returns)
Here:
$975
State:
$7,610
Profit/loss from business: +$3,500 (reported on 9.1% of returns)
Here:
+$3,500
State:
+$12,088
Taxable individual retirement arrangement distribution: $4,767 (reported on 5.5% of returns)
71447:
$4,767
Louisiana:
$16,085
Total itemized deductions: $17,512 (23% of AGI, reported on 14.5% of returns)
Here:
$17,512
State:
$23,585
Here:
23.1% of AGI
State:
18.1% of AGI
Charity contributions: $4,325 (reported on 7.3% of returns)
Here:
$4,325
State:
$5,533
Taxes paid: $3,400 (reported on 12.7% of returns)
71447:
$3,400
State:
$6,282
Earned income credit: $2,107 (reported on 25.5% of returns)
Here:
$2,107
State:
$2,633
(% of AGI for various income ranges: 7.6% for AGIs below $25k, 1.0% for AGIs $25k-50k)
Percentage of individuals using paid preparers for their 2012 taxes: 43.6%
Here:
44%
State:
57%
(% for various income ranges: 39.1% for AGIs below $25k, 41.2% for AGIs $25k-50k, 50.0% for AGIs $50k-75k, 50.0% for AGIs $75k-100k, 66.7% for AGIs $100k-200k)
Averages for the 2004 tax year for zip code 71447, filed in 2005:
Average Adjusted Gross Income (AGI) in 2004: $27,924 (Individual Income Tax Returns)
Here:
$27,924
State:
$39,411
Salary/wage: $27,767 (reported on 86.3% of returns)
Here:
$27,767
State:
$34,434
(% of AGI for various income ranges: 75.4% for AGIs below $10k, 79.3% for AGIs $10k-25k, 87.3% for AGIs $25k-50k, 93.4% for AGIs $50k-75k, 80.2% for AGIs $75k-100k)
Taxable interest for individuals: $628 (reported on 27.6% of returns)
This zip code:
$628
Louisiana:
$1,606
(% of AGI for various income ranges: 1.5% for AGIs below $10k, 0.6% for AGIs $10k-25k, 0.9% for AGIs $25k-50k, 0.4% for AGIs $50k-75k, 0.2% for AGIs $75k-100k)
Taxable dividends: $510 (reported on 9.3% of returns)
Here:
$510
State:
$3,235
Net capital gain/loss: +$2,633 (reported on 5.7% of returns)
Here:
+$2,633
State:
+$8,531
Profit/loss from business: +$3,591 (reported on 8.4% of returns)
Here:
+$3,591
State:
+$9,128
Total itemized deductions: $15,042 (31% of AGI, reported on 9.1% of returns)
Here:
$15,042
State:
$18,222
Here:
30.9% of AGI
State:
20.3% of AGI
Charity contributions deductions: $3,486 (7% of AGI, reported on 6.7% of returns)
Here:
$3,486
State:
$4,190
Here:
7.5% of AGI
State:
4.4% of AGI
Total tax: $3,065 (reported on 61.8% of returns)
71447:
$3,065
State:
$6,529
(% of AGI for various income ranges: 1.8% for AGIs below $10k, 2.9% for AGIs $10k-25k, 5.9% for AGIs $25k-50k, 7.8% for AGIs $50k-75k, 13.6% for AGIs $75k-100k)
Earned income credit: $1,893 (reported on 28.3% of returns)
Here:
$1,893
State:
$2,103
Percentage of individuals using paid preparers for their 2004 taxes: 49.8%
Here:
50%
State:
61%
(% for various income ranges: 46.1% for AGIs below $10k, 47.6% for AGIs $10k-25k, 53.8% for AGIs $25k-50k, 49.2% for AGIs $50k-75k, 63.6% for AGIs $75k-100k)
Household received Food Stamps/SNAP in the past 12 months: 83 Household did not receive Food Stamps/SNAP in the past 12 months: 334
Women who did not have a birth in the past 12 months: 170 (103 now married, 65 unmarried)
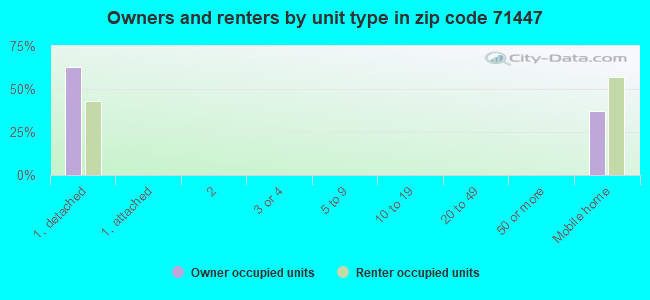
Housing units in zip code 71447 with a mortgage: 114 (27 second mortgage, 25 both second mortgage and home equity loan) Median monthly owner costs for units with a mortgage: $1,287 Median monthly owner costs for units without a mortgage: $243
Residents with income below the poverty level in 2022:
This zip code:
6.7%
Whole state:
18.6%
Residents with income below 50% of the poverty level in 2022:
This zip code:
5.0%
Whole state:
10.1%
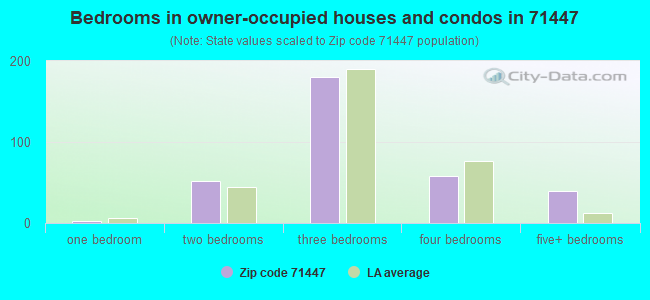
Median number of rooms in houses and condos:
Here:
5.5
State:
6.2
Median number of rooms in apartments:
Here:
5.3
State:
4.4
Notable locations in this zip code not listed on our city pages
Notable locations in zip code 71447: Galbraith Station (A), Zimmerman Camp (B), Flatwoods Volunteer Fire Department Station 3 (C). Display/hide their locations on the map
Churches in zip code 71447 include: Sharp Church (A), Wise Memorial Church (B), Saint Marys Church (C), Saint Johns Church (D), Church of God (E), Mount Herman Church (F), Damascus Church (G), Bay Spring (H), Emanuel Church (I). Display/hide their locations on the map
Cemeteries: Bay Spring Cemetery (1), Watkin Cemetery (2), Calvert Cemetery (3), Campbell Creek Cemetery (4), Marce Cemetery (5), Carnahan Cemetery (6), Knight Cemetery (7). Display/hide their locations on the map
Lakes and swamps: Shagafoot Lake (A), Big Trudo Lake (B), Nash Lake (C), Boudreaux Lake (D), Bush Lake (E), Jack Luke Lake (F), Mitchell Lake (G), Mill Pond (H). Display/hide their locations on the map
Streams, rivers, and creeks: Bayou Castor (A), Cherry Creek (B), Devils Creek (C), Davis Creek (D), Croupon Bayou (E), Dan Branch (F), Bynogue Branch (G), Bayou Jean De Jean (H), Bayou Barbue (I). Display/hide their locations on the map
Size of family households: 180 2-persons, 46 3-persons, 59 4-persons, 3 5-persons, 18 6-persons
Size of nonfamily households: 104 1-person, 2 2-persons
208 married couples with children.
19 single-parent households (19 women).
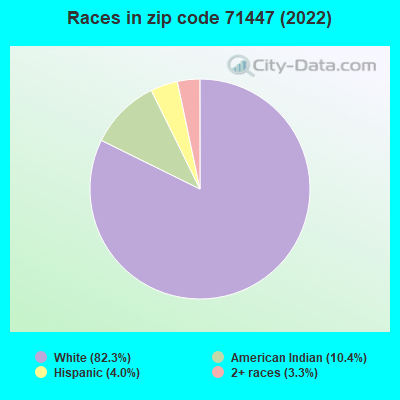
99.9% of residents of 71447 zip code speak English at home.
0.8% of residents speak Spanish at home (12% very well, 62% well, 25% not well).
0.1% of residents speak other Indo-European language at home (100% very well).
Foreign born population: 7 (0.7%) (72.9% of them are naturalized citizens)
This zip code:
0.7%
Whole state:
4.2%
86%Honduras
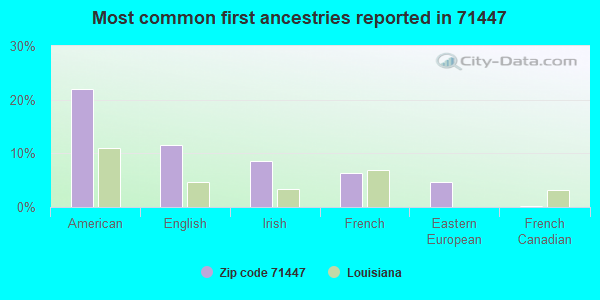
22%American
11%English
9%Irish
6%French
5%Eastern European
0%French Canadian
Year of entry for the foreign-born population
22010 or later
02000 to 2009
21990 to 1999
15Before 1990
Facilities with environmental interests located in this zip code:
NORTHWOOD HIGH SCHOOL (8830 HIGHWAY 1 NORTH in LENA, LA)
(National Center for Education Statistics) - STATE ID-040055 Organizations: RAPIDES PARISH SCHOOL BOARD (SCHOOL DISTRICT)
ABL CONTRACTING LLC (56 HWY 8 in LENA, LA)
TRANSPORTER (Resource Conservation and Recovery Act (tracking hazardous waste)) Business NAICS classification: GENERAL FREIGHT TRUCKING, LONG-DISTANCE, TRUCKLOAD. Organizations: MICHAEL PARKER (CONTACT/OPERATOR)
, RED RIVER TRANSPORTATION (CONTACT/OPERATOR)
Alternative names: RED RIVER TRANSPORTATION
NEWBERG VENTURE CONST CO LOCK & DAM #3 (RED RIVER LOCK & DAM NO3 E END in LENA, LA)
(Resource Conservation and Recovery Act (tracking hazardous waste))
HARD ROCK SAND AND GRAVEL (HWY 25 SOUTH APPROX 3/4 SOUTH in CLIFTON, LA)
National Pollutant Discharge Elimination System NON-MAJOR (Tracking pollutant discharge elimination systems) - permit
Housing units lacking complete plumbing facilities: 28.2% Housing units lacking complete kitchen facilities: 19.7%
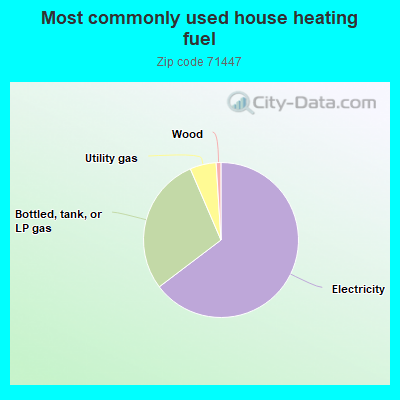
65.0%Electricity
29.0%Bottled, tank, or LP gas
5.5%Utility gas
1.0%Wood
Population in 1990: 757. Population change in the 1990s: +716 (+94.6%).
Place of birth for U.S.-born residents:
This state: 891
Northeast: 1
South: 102
West: 40
77% of the 71447 zip code residents lived in the same house 5 years ago. Out of people who lived in different houses, 71% lived in this county. Out of people who lived in different counties, 50% lived in Louisiana.
99% of the 71447 zip code residents lived in the same house 1 year ago. Out of people who lived in different houses, 11% moved from this county. Out of people who lived in different houses, 67% moved from different county within same state. Out of people who lived in different houses, 33% moved from different state.
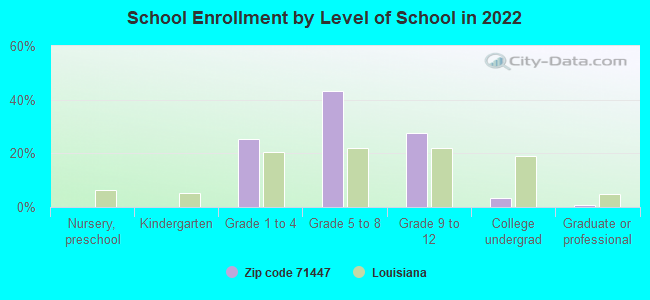
Private vs. public school enrollment:
Students in private schools in grades 1 to 8 (elementary and middle school): 19
Here:
11.6%
Louisiana:
19.6%
Students in private schools in grades 9 to 12 (high school): 7
Here:
10.5%
Louisiana:
18.3%
Students in private undergraduate colleges:
Here:
0.0%
Louisiana:
17.4%
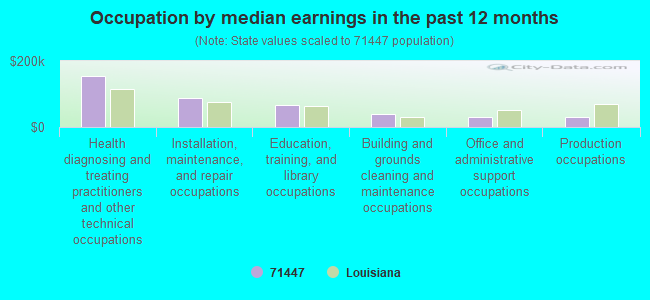
Occupation by median earnings in the past 12 months ($)
154,791Health diagnosing and treating practitioners and other technical occupations
87,054Installation, maintenance, and repair occupations
67,309Education, training, and library occupations
38,062Building and grounds cleaning and maintenance occupations
31,486Office and administrative support occupations
30,024Production occupations
Companies with federal contracts located in this zip code:
MICHAEL LARRY PARKER JR (56 HIGHWAY 8 in LENA, LA; small business) : $396,906 in 8 contractsfrom 2000 to 2003
Contracts for Miscellaneous Construction Materials, Mineral Construction Materials, Bulk, Maintenance, Repair or Alteration of Real Property -- Highways, Roads, Streets, Bridges, and Railways (includes resurfacing) by U.S. Army Corps of Engineers - civil program financing only, Air Force, Army Signed by year:2000: $148,250; 2001: $127,150; 2002: $44,375; 2003: $77,131; 2004: $0; 2005: $0; 2006: $0.
Biggest contracts:
$123,500 with U.S. Army Corps of Engineers - civil program financing only for Miscellaneous Construction Materials. Signed on 2000-05-08. Completion date: 2000-06-23.
$103,205 with U.S. Army Corps of Engineers - civil program financing only for Mineral Construction Materials, Bulk. Signed on 2003-09-11. Completion date: 2003-09-16.
$73,000 with Air Force for Maintenance, Repair or Alteration of Real Property -- Highways, Roads, Streets, Bridges, and Railways (includes resurfacing). Signed on 2001-04-24. Completion date: 2001-06-15.
$54,150, same as above.Signed on 2001-06-28. Completion date: 2001-08-27.
Top industries in this zip code by the number of employees in 2005:
Utilities: Fossil Fuel Electric Power Generation (50-99 employees: 1 establishment, 5-9 employees: 2 establishments)
Wholesale Trade: Printing and Writing Paper Merchant Wholesalers (1-4: 1)
Utilities: Water Supply and Irrigation Systems (1-4: 1)
Construction: Site Preparation Contractors (1-4: 1)
Mining: Support Activities for Oil and Gas Operations (1-4: 1)
Fatal accident statistics in 2012:
Fatal accident count: 1
Vehicles involved in fatal accidents: 1
Fatal accidents caused by drunken drivers: 1
Fatalities: 1
Persons involved in fatal accidents: 1
Pedestrians involved in fatal accidents: 0
Fatal accident statistics in 2010:
Fatal accident count: 1
Vehicles involved in fatal accidents: 1
Fatal accidents caused by drunken drivers: 1
Fatalities: 1
Persons involved in fatal accidents: 2
Pedestrians involved in fatal accidents: 0
Home Mortgage Disclosure Act Aggregated Statistics For Year 2009 (Based on 4 partial tracts)
A) FHA, FSA/RHS & VA Home Purchase Loans
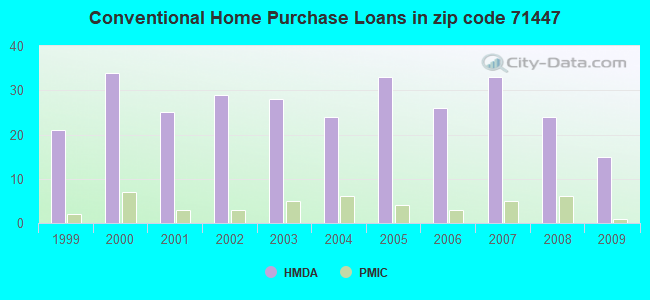
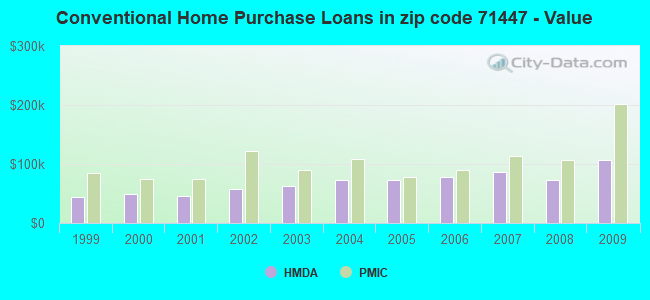
B) Conventional Home Purchase Loans
C) Refinancings
D) Home Improvement Loans
F) Non-occupant Loans on < 5 Family Dwellings (A B C & D)
G) Loans On Manufactured Home Dwelling (A B C & D)
Number
Average Value
Number
Average Value
Number
Average Value
Number
Average Value
Number
Average Value
Number
Average Value
LOANS ORIGINATED
9
$133,724
15
$106,558
40
$89,348
12
$31,594
9
$53,476
20
$37,422
APPLICATIONS APPROVED, NOT ACCEPTED
1
$25,540
3
$94,290
3
$143,620
1
$27,500
1
$136,200
3
$47,800
APPLICATIONS DENIED
2
$163,045
14
$117,771
15
$110,007
4
$7,202
1
$68,100
9
$55,003
APPLICATIONS WITHDRAWN
1
$160,430
1
$292,700
10
$116,227
0
$0
0
$0
1
$19,640
FILES CLOSED FOR INCOMPLETENESS
1
$50,420
2
$94,620
5
$115,244
0
$0
0
$0
1
$77,920
Aggregated Statistics For Year 2008 (Based on 4 partial tracts)
A) FHA, FSA/RHS & VA Home Purchase Loans
B) Conventional Home Purchase Loans
C) Refinancings
D) Home Improvement Loans
F) Non-occupant Loans on < 5 Family Dwellings (A B C & D)
G) Loans On Manufactured Home Dwelling (A B C & D)
Number
Average Value
Number
Average Value
Number
Average Value
Number
Average Value
Number
Average Value
Number
Average Value
LOANS ORIGINATED
10
$114,394
24
$72,819
41
$75,717
6
$44,417
10
$81,326
27
$45,230
APPLICATIONS APPROVED, NOT ACCEPTED
1
$246,200
8
$65,235
4
$120,155
1
$3,930
1
$67,440
8
$65,235
APPLICATIONS DENIED
1
$39,940
19
$52,005
16
$108,042
5
$44,002
0
$0
20
$50,420
APPLICATIONS WITHDRAWN
1
$64,830
1
$50,420
5
$124,282
0
$0
1
$50,420
1
$108,700
FILES CLOSED FOR INCOMPLETENESS
0
$0
1
$142,090
1
$117,860
0
$0
1
$142,090
0
$0
Aggregated Statistics For Year 2007 (Based on 4 partial tracts)
A) FHA, FSA/RHS & VA Home Purchase Loans
B) Conventional Home Purchase Loans
C) Refinancings
D) Home Improvement Loans
F) Non-occupant Loans on < 5 Family Dwellings (A B C & D)
G) Loans On Manufactured Home Dwelling (A B C & D)
Number
Average Value
Number
Average Value
Number
Average Value
Number
Average Value
Number
Average Value
Number
Average Value
LOANS ORIGINATED
5
$106,340
33
$86,493
41
$88,590
14
$45,134
14
$51,542
22
$47,354
APPLICATIONS APPROVED, NOT ACCEPTED
3
$57,623
20
$49,274
1
$152,570
1
$127,030
0
$0
20
$45,280
APPLICATIONS DENIED
2
$75,630
29
$64,961
28
$91,274
7
$29,560
1
$1,960
26
$45,635
APPLICATIONS WITHDRAWN
1
$122,450
5
$65,742
4
$103,785
3
$55,220
0
$0
4
$50,255
FILES CLOSED FOR INCOMPLETENESS
0
$0
1
$86,430
5
$103,328
0
$0
0
$0
1
$86,430
Aggregated Statistics For Year 2006 (Based on 4 partial tracts)
A) FHA, FSA/RHS & VA Home Purchase Loans
B) Conventional Home Purchase Loans
C) Refinancings
D) Home Improvement Loans
F) Non-occupant Loans on < 5 Family Dwellings (A B C & D)
G) Loans On Manufactured Home Dwelling (A B C & D)
Number
Average Value
Number
Average Value
Number
Average Value
Number
Average Value
Number
Average Value
Number
Average Value
LOANS ORIGINATED
3
$85,780
26
$78,702
21
$80,790
14
$32,179
6
$54,348
12
$38,742
APPLICATIONS APPROVED, NOT ACCEPTED
1
$129,650
12
$43,435
7
$69,596
3
$28,373
0
$0
14
$42,001
APPLICATIONS DENIED
3
$28,157
27
$59,757
16
$89,871
11
$35,538
3
$53,693
23
$47,573
APPLICATIONS WITHDRAWN
0
$0
3
$88,617
5
$115,506
1
$39,290
0
$0
1
$55,660
FILES CLOSED FOR INCOMPLETENESS
0
$0
1
$94,950
4
$102,968
0
$0
0
$0
0
$0
Aggregated Statistics For Year 2005 (Based on 4 partial tracts)
A) FHA, FSA/RHS & VA Home Purchase Loans
B) Conventional Home Purchase Loans
C) Refinancings
D) Home Improvement Loans
F) Non-occupant Loans on < 5 Family Dwellings (A B C & D)
G) Loans On Manufactured Home Dwelling (A B C & D)
Number
Average Value
Number
Average Value
Number
Average Value
Number
Average Value
Number
Average Value
Number
Average Value
LOANS ORIGINATED
2
$148,310
33
$72,147
34
$98,451
16
$19,644
7
$92,889
20
$35,916
APPLICATIONS APPROVED, NOT ACCEPTED
0
$0
16
$57,377
10
$99,857
3
$17,460
0
$0
14
$45,041
APPLICATIONS DENIED
2
$61,880
41
$51,170
28
$85,662
12
$28,211
2
$100,185
41
$46,667
APPLICATIONS WITHDRAWN
1
$37,320
5
$67,444
15
$114,372
2
$168,610
0
$0
5
$52,908
FILES CLOSED FOR INCOMPLETENESS
0
$0
0
$0
2
$96,910
0
$0
0
$0
0
$0
Aggregated Statistics For Year 2004 (Based on 4 partial tracts)
A) FHA, FSA/RHS & VA Home Purchase Loans
B) Conventional Home Purchase Loans
C) Refinancings
D) Home Improvement Loans
F) Non-occupant Loans on < 5 Family Dwellings (A B C & D)
G) Loans On Manufactured Home Dwelling (A B C & D)
Number
Average Value
Number
Average Value
Number
Average Value
Number
Average Value
Number
Average Value
Number
Average Value
LOANS ORIGINATED
5
$79,886
24
$72,738
46
$78,661
12
$19,371
6
$54,022
12
$33,668
APPLICATIONS APPROVED, NOT ACCEPTED
0
$0
4
$49,110
11
$84,112
1
$1,310
1
$24,230
3
$50,637
APPLICATIONS DENIED
1
$64,170
28
$46,959
29
$53,626
8
$19,808
2
$50,745
24
$42,316
APPLICATIONS WITHDRAWN
0
$0
4
$155,025
12
$79,012
1
$1,310
0
$0
3
$59,807
FILES CLOSED FOR INCOMPLETENESS
0
$0
2
$53,040
0
$0
1
$16,370
0
$0
1
$21,610
Aggregated Statistics For Year 2003 (Based on 4 partial tracts)
A) FHA, FSA/RHS & VA Home Purchase Loans
B) Conventional Home Purchase Loans
C) Refinancings
D) Home Improvement Loans
F) Non-occupant Loans on < 5 Family Dwellings (A B C & D)
Number
Average Value
Number
Average Value
Number
Average Value
Number
Average Value
Number
Average Value
LOANS ORIGINATED
1
$128,340
28
$63,048
71
$70,515
20
$13,587
8
$27,010
APPLICATIONS APPROVED, NOT ACCEPTED
0
$0
5
$65,350
16
$69,982
1
$1,960
1
$42,560
APPLICATIONS DENIED
2
$74,320
15
$35,839
38
$65,446
6
$10,258
3
$68,317
APPLICATIONS WITHDRAWN
0
$0
1
$182,690
15
$64,432
0
$0
1
$79,230
FILES CLOSED FOR INCOMPLETENESS
0
$0
1
$142,750
3
$122,883
1
$16,370
0
$0
Aggregated Statistics For Year 2002 (Based on 4 partial tracts)
A) FHA, FSA/RHS & VA Home Purchase Loans
B) Conventional Home Purchase Loans
C) Refinancings
D) Home Improvement Loans
F) Non-occupant Loans on < 5 Family Dwellings (A B C & D)
Number
Average Value
Number
Average Value
Number
Average Value
Number
Average Value
Number
Average Value
LOANS ORIGINATED
2
$121,465
29
$58,390
50
$72,591
12
$12,114
6
$60,678
APPLICATIONS APPROVED, NOT ACCEPTED
0
$0
9
$38,997
11
$58,992
2
$23,900
1
$10,480
APPLICATIONS DENIED
0
$0
18
$36,705
23
$48,028
7
$21,701
1
$25,540
APPLICATIONS WITHDRAWN
0
$0
3
$51,510
6
$89,927
1
$9,170
1
$31,430
FILES CLOSED FOR INCOMPLETENESS
1
$76,610
1
$85,120
4
$88,070
0
$0
0
$0
Aggregated Statistics For Year 2001 (Based on 4 partial tracts)
A) FHA, FSA/RHS & VA Home Purchase Loans
B) Conventional Home Purchase Loans
C) Refinancings
D) Home Improvement Loans
F) Non-occupant Loans on < 5 Family Dwellings (A B C & D)
Number
Average Value
Number
Average Value
Number
Average Value
Number
Average Value
Number
Average Value
LOANS ORIGINATED
1
$113,940
25
$45,914
54
$64,134
10
$22,656
4
$28,648
APPLICATIONS APPROVED, NOT ACCEPTED
1
$32,090
3
$32,957
10
$59,914
4
$16,208
1
$30,120
APPLICATIONS DENIED
2
$50,745
20
$37,716
33
$66,452
12
$19,098
3
$17,680
APPLICATIONS WITHDRAWN
0
$0
1
$72,680
10
$60,111
0
$0
0
$0
FILES CLOSED FOR INCOMPLETENESS
0
$0
0
$0
4
$84,632
0
$0
0
$0
Aggregated Statistics For Year 2000 (Based on 4 partial tracts)
A) FHA, FSA/RHS & VA Home Purchase Loans
B) Conventional Home Purchase Loans
C) Refinancings
D) Home Improvement Loans
F) Non-occupant Loans on < 5 Family Dwellings (A B C & D)
Number
Average Value
Number
Average Value
Number
Average Value
Number
Average Value
Number
Average Value
LOANS ORIGINATED
6
$63,952
34
$49,900
29
$58,097
9
$7,858
5
$33,394
APPLICATIONS APPROVED, NOT ACCEPTED
2
$35,030
14
$33,395
5
$73,862
4
$21,772
1
$40,600
APPLICATIONS DENIED
1
$37,980
37
$30,032
45
$44,366
12
$8,512
5
$27,894
APPLICATIONS WITHDRAWN
0
$0
0
$0
15
$52,471
3
$33,613
0
$0
FILES CLOSED FOR INCOMPLETENESS
0
$0
1
$104,770
2
$22,920
0
$0
0
$0
Aggregated Statistics For Year 1999 (Based on 2 partial tracts)
A) FHA, FSA/RHS & VA Home Purchase Loans
B) Conventional Home Purchase Loans
C) Refinancings
D) Home Improvement Loans
F) Non-occupant Loans on < 5 Family Dwellings (A B C & D)

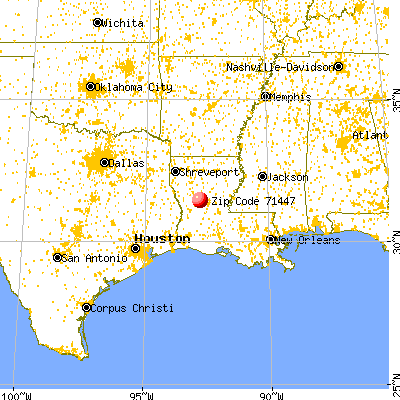


 Nearest zip codes: 71427, 71416, 71409, 71417, 71455, 71452.