Estimated zip code population in 2022: 2,364 Zip code population in 2010: 2,156 Zip code population in 2000: 2,404
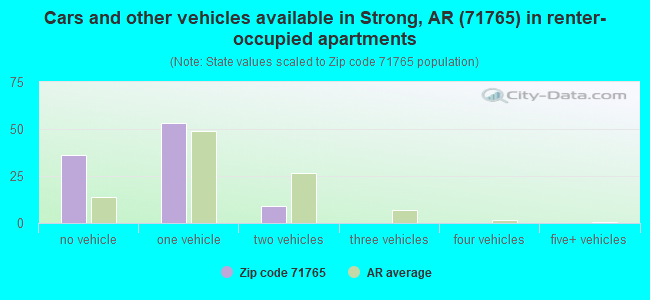
Houses and condos: 1,342 Renter-occupied apartments: 93
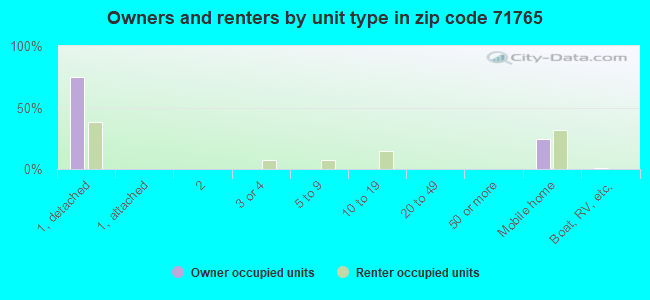
% of renters here:
9%
State:
34%
March 2022 cost of living index in zip code 71765: 76.8 (low, U.S. average is 100)
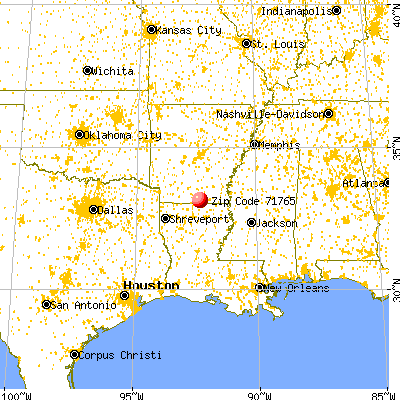
Land area: 198.3 sq. mi. Water area: 4.9 sq. mi.
Population density: 12 people per square mile
(very low).
OSM Map
General Map
Google Map
MSN Map
OSM Map
General Map
Google Map
MSN Map
OSM Map
General Map
Google Map
MSN Map
OSM Map
General Map
Google Map
MSN Map
Please wait while loading the map...
Real estate property taxes paid for housing units in 2022:
This zip code:
0.8% ($376)
Arkansas:
0.5% ($977)
Median real estate property taxes paid for housing units with mortgages in 2022: $368 (0.7%) Median real estate property taxes paid for housing units with no mortgage in 2022: $449 (1.2%)
Business Search- 14 Million verified businesses
Males: 1,132
(47.9%)
Females: 1,232
(52.1%)
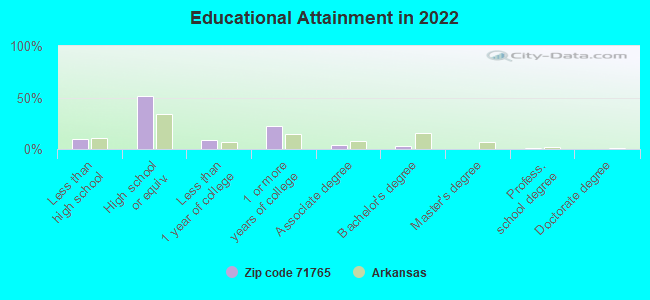
For population 25 years and over in 71765:
High school or higher: 89.6%
Bachelor's degree or higher: 4.4%
Graduate or professional degree: 1.1%
Unemployed: 3.2%
Mean travel time to work (commute): 34.5 minutes
For population 15 years and over in 71765:
Never married: 29.9%
Now married: 45.2%
Separated: 10.8%
Widowed: 6.8%
Divorced: 7.2%
Zip code 71765 compared to state average:
Median household income below state average.
Median house value significantly below state average.
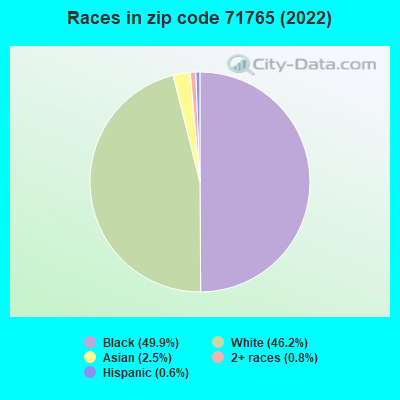
Black race population percentage significantly above state average.
Hispanic race population percentage significantly below state average.
Median age above state average.
Foreign-born population percentage below state average.
Renting percentage significantly below state average.
Length of stay since moving in significantly above state average.
Number of college students below state average.
Percentage of population with a bachelor's degree or higher significantly below state average.
Estimated median house/condo value in 2022: $49,489
71765:
$49,489
Arkansas:
$179,800
According to our research of Arkansas and other state lists, there were 2 registered sex offenders living in 71765 zip code as of May 28, 2024. The ratio of all residents to sex offenders in zip code 71765 is 1,002 to 1. The ratio of registered sex offenders to all residents in this zip code is lower than the state average.
Median resident age:
This zip code:
44.9 years
Arkansas median age:
38.9 years
Average household size:
This zip code:
2.3 people
Arkansas:
2.4 people
Averages for the 2020 tax year for zip code 71765, filed in 2021:
Average Adjusted Gross Income (AGI) in 2020: $43,340 (Individual Income Tax Returns)
Here:
$43,340
State:
$64,872
Salary/wage: $37,720 (reported on 84.1% of returns)
Here:
$37,720
State:
$50,644
(% of AGI for various income ranges: 1088.6% for AGIs below $25k, 4032.9% for AGIs $25k-50k, 6773.3% for AGIs $50k-75k, 9217.5% for AGIs $75k-100k, 20657.5% for AGIs $100k-200k)
Taxable interest for individuals: $526 (reported on 23.2% of returns)
This zip code:
$526
Arkansas:
$1,857
(% of AGI for various income ranges: 3.4% for AGIs below $25k, 19.4% for AGIs $25k-50k, 23.3% for AGIs $50k-75k, 47.5% for AGIs $75k-100k, 60.0% for AGIs $100k-200k)
Ordinary dividends: $2,350 (reported on 9.8% of returns)
Here:
$2,350
State:
$21,681
(% of AGI for various income ranges: 41.8% for AGIs $25k-50k, 96.7% for AGIs $50k-75k, 147.5% for AGIs $100k-200k)
Net capital gain/loss in AGI: +$4,933 (reported on 7.3% of returns)
Here:
+$4,933
State:
+$22,815
(% of AGI for various income ranges: 41.8% for AGIs $25k-50k, 562.5% for AGIs $75k-100k)
Profit/loss from business: +$3,627 (reported on 13.4% of returns)
Here:
+$3,627
State:
+$9,743
(% of AGI for various income ranges: 90.3% for AGIs below $25k, 318.3% for AGIs $50k-75k)
Taxable individual retirement arrangement distribution: $16,100 (reported on 7.3% of returns)
71765:
$16,100
Arkansas:
$18,502
(% of AGI for various income ranges: 190.0% for AGIs $25k-50k, 1607.5% for AGIs $75k-100k)
Earned income credit: $2,581 (reported on 31.7% of returns)
Here:
$2,581
State:
$2,546
(% of AGI for various income ranges: 169.3% for AGIs below $25k, 105.9% for AGIs $25k-50k)
Percentage of individuals using paid preparers for their 2020 taxes: 93.9%
Here:
94%
State:
94%
(% for various income ranges: 91.7% for AGIs below $25k, 95.7% for AGIs $25k-50k, 100.0% for AGIs $50k-75k, 100.0% for AGIs $75k-100k, 87.5% for AGIs $100k-200k)
Averages for the 2012 tax year for zip code 71765, filed in 2013:
Average Adjusted Gross Income (AGI) in 2012: $35,902 (Individual Income Tax Returns)
Here:
$35,902
State:
$52,148
Salary/wage: $33,347 (reported on 85.4% of returns)
Here:
$33,347
State:
$41,669
(% of AGI for various income ranges: 79.7% for AGIs below $25k, 86.2% for AGIs $25k-50k, 82.3% for AGIs $50k-75k, 82.4% for AGIs $75k-100k, 66.4% for AGIs $100k-200k)
Taxable interest for individuals: $573 (reported on 24.7% of returns)
This zip code:
$573
Arkansas:
$1,648
(% of AGI for various income ranges: 0.5% for AGIs below $25k, 0.5% for AGIs $25k-50k, 0.5% for AGIs $50k-75k, 0.2% for AGIs $75k-100k, 0.2% for AGIs $100k-200k)
Ordinary dividends: $3,043 (reported on 7.9% of returns)
Here:
$3,043
State:
$20,675
Net capital gain/loss in AGI: +$383 (reported on 6.7% of returns)
Here:
+$383
State:
+$15,222
Profit/loss from business: +$2,291 (reported on 12.4% of returns)
Here:
+$2,291
State:
+$9,665
(% of AGI for various income ranges: 4.4% for AGIs below $25k, 0.5% for AGIs $25k-50k)
Taxable individual retirement arrangement distribution: $12,020 (reported on 5.6% of returns)
71765:
$12,020
Arkansas:
$13,644
Total itemized deductions: $16,688 (25% of AGI, reported on 18.0% of returns)
Here:
$16,688
State:
$23,276
Here:
24.6% of AGI
State:
19.1% of AGI
(% of AGI for various income ranges: 9.2% for AGIs $25k-50k, 14.6% for AGIs $50k-75k, 12.9% for AGIs $100k-200k)
Charity contributions: $4,985 (reported on 14.6% of returns)
Here:
$4,985
State:
$5,996
(% of AGI for various income ranges: 2.5% for AGIs $25k-50k, 4.3% for AGIs $50k-75k, 2.1% for AGIs $100k-200k)
Taxes paid: $5,067 (reported on 16.9% of returns)
71765:
$5,067
State:
$7,941
(% of AGI for various income ranges: 1.4% for AGIs $25k-50k, 3.5% for AGIs $50k-75k, 5.7% for AGIs $100k-200k)
Earned income credit: $2,353 (reported on 38.2% of returns)
Here:
$2,353
State:
$2,455
(% of AGI for various income ranges: 11.8% for AGIs below $25k, 1.6% for AGIs $25k-50k)
Percentage of individuals using paid preparers for their 2012 taxes: 62.9%
Here:
63%
State:
61%
(% for various income ranges: 64.4% for AGIs below $25k, 56.5% for AGIs $25k-50k, 63.6% for AGIs $50k-75k, 60.0% for AGIs $75k-100k, 80.0% for AGIs $100k-200k)
Averages for the 2004 tax year for zip code 71765, filed in 2005:
Average Adjusted Gross Income (AGI) in 2004: $30,911 (Individual Income Tax Returns)
Here:
$30,911
State:
$39,270
Salary/wage: $29,008 (reported on 86.9% of returns)
Here:
$29,008
State:
$34,079
(% of AGI for various income ranges: 99.0% for AGIs below $10k, 86.2% for AGIs $10k-25k, 88.7% for AGIs $25k-50k, 84.0% for AGIs $50k-75k, 78.9% for AGIs $75k-100k, 52.9% for AGIs over 100k)
Taxable interest for individuals: $1,469 (reported on 28.3% of returns)
This zip code:
$1,469
Arkansas:
$1,904
(% of AGI for various income ranges: 6.4% for AGIs below $10k, 1.8% for AGIs $10k-25k, 1.3% for AGIs $25k-50k, 0.7% for AGIs $50k-75k, 1.5% for AGIs $75k-100k, 0.6% for AGIs over 100k)
Taxable dividends: $1,883 (reported on 11.6% of returns)
Here:
$1,883
State:
$5,995
(% of AGI for various income ranges: 1.7% for AGIs $10k-25k, 0.6% for AGIs $25k-50k, 0.3% for AGIs $50k-75k, 0.9% for AGIs $75k-100k)
Net capital gain/loss: +$5,380 (reported on 8.3% of returns)
Here:
+$5,380
State:
+$10,430
(% of AGI for various income ranges: 0.5% for AGIs $10k-25k, 0.0% for AGIs $25k-50k, 0.6% for AGIs $50k-75k, 8.8% for AGIs $75k-100k)
Profit/loss from business: +$1,102 (reported on 11.3% of returns)
Here:
+$1,102
State:
+$7,823
(% of AGI for various income ranges: 12.3% for AGIs below $10k, -0.5% for AGIs $10k-25k, 0.4% for AGIs $25k-50k, 0.1% for AGIs $50k-75k)
Total itemized deductions: $14,811 (24% of AGI, reported on 17.7% of returns)
Here:
$14,811
State:
$18,389
Here:
23.7% of AGI
State:
21.0% of AGI
(% of AGI for various income ranges: 6.5% for AGIs $10k-25k, 8.4% for AGIs $25k-50k, 7.9% for AGIs $50k-75k, 12.8% for AGIs $75k-100k, 10.0% for AGIs over 100k)
Charity contributions deductions: $3,671 (6% of AGI, reported on 15.6% of returns)
Here:
$3,671
State:
$4,725
Here:
5.9% of AGI
State:
5.1% of AGI
(% of AGI for various income ranges: 1.0% for AGIs $10k-25k, 1.7% for AGIs $25k-50k, 2.4% for AGIs $50k-75k, 3.5% for AGIs $75k-100k, 1.1% for AGIs over 100k)
Total tax: $3,894 (reported on 62.4% of returns)
71765:
$3,894
State:
$6,047
(% of AGI for various income ranges: 2.5% for AGIs below $10k, 2.7% for AGIs $10k-25k, 5.7% for AGIs $25k-50k, 8.9% for AGIs $50k-75k, 10.3% for AGIs $75k-100k, 17.6% for AGIs over 100k)
Earned income credit: $2,104 (reported on 35.0% of returns)
Here:
$2,104
State:
$1,909
Percentage of individuals using paid preparers for their 2004 taxes: 71.1%
Here:
71%
State:
67%
(% for various income ranges: 63.3% for AGIs below $10k, 78.4% for AGIs $10k-25k, 68.4% for AGIs $25k-50k, 68.6% for AGIs $50k-75k, 68.1% for AGIs $75k-100k, 81.8% for AGIs over 100k)
Household received Food Stamps/SNAP in the past 12 months: 70 Household did not receive Food Stamps/SNAP in the past 12 months: 962
Women who did not have a birth in the past 12 months: 473 (202 now married, 270 unmarried)
Housing units in zip code 71765 with a mortgage: 304 Median monthly owner costs for units with a mortgage: $942 Median monthly owner costs for units without a mortgage: $421
Residents with income below the poverty level in 2022:
This zip code:
18.9%
Whole state:
16.8%
Residents with income below 50% of the poverty level in 2022:
This zip code:
6.5%
Whole state:
8.5%
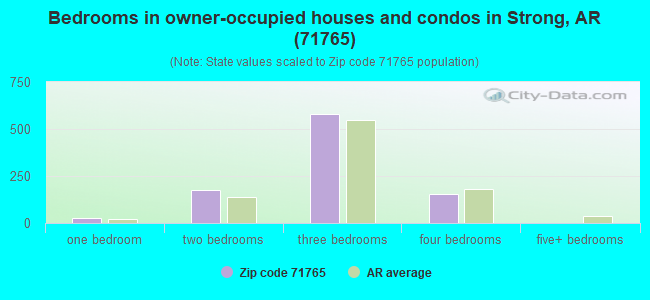
Median number of rooms in houses and condos:
Here:
5.2
State:
6.1
Median number of rooms in apartments:
Here:
4.9
State:
4.3
Notable locations in this zip code not listed on our city pages
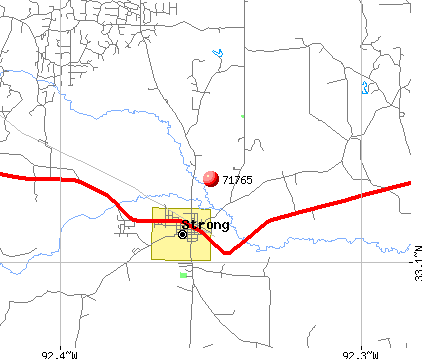
Notable locations in zip code 71765: Strong Pumping Station (A), Sandybend (B), Strong Volunteer Fire Department (C). Display/hide their locations on the map
Churches in zip code 71765 include: Ward Chapel (A), Cane Creek Church (B), First Baptist Church (C), Freehope Church (D), Knowles Baptist Church (E), Lapile Methodist Church (F), New London Baptist Church (G), Pine Grove Church (H), Pleasant Grove Methodist Church (I). Display/hide their locations on the map
Cemeteries: Cane Creek Cemetery (1), Center Point Cemetery (2), Ebenezer Cemetery (3), Forest Hill Cemetery (4), Free Hope Cemetery (5), Hillsboro Cemetery (6), New London Cemetery (7). Display/hide their locations on the map
Lakes and swamps: Eagle Lake (A), Hoop Lake (B), Fishtrap Lake (C), Blue Lake (D), Benjamin Lake (E), Jones Lake (F), Open Brake (G), Spice Pond (H). Display/hide their locations on the map
Streams, rivers, and creeks: Norris Branch (A), Long Branch (B), Horsehead Creek (C), Greenhaw Branch (D), Norris Creek (E), Williams Creek (F), Dry Creek (G), Arthur Branch (H), South Lapile Creek (I). Display/hide their locations on the map
Size of family households: 326 2-persons, 19 3-persons, 119 4-persons, 20 5-persons, 47 7-or-more-persons
Size of nonfamily households: 499 1-person, 18 2-persons
298 married couples with children.
325 single-parent households (325 women).
95.9% of residents of 71765 zip code speak English at home.
0.6% of residents speak Spanish at home (50% very well, 7% well, 43% not well).
0.3% of residents speak other Indo-European language at home (100% very well).
2.5% of residents speak Asian or Pacific Island language at home (53% very well, 47% well).
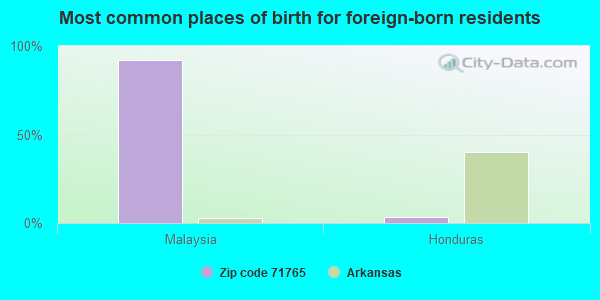
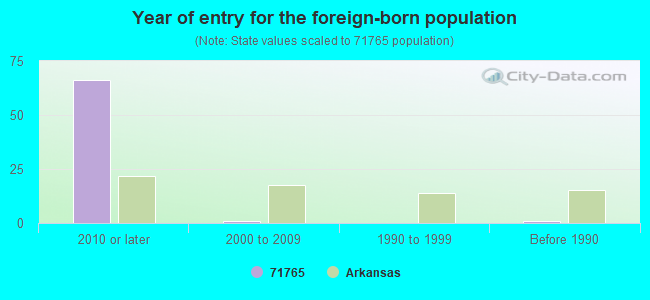
Foreign born population: 62 (2.6%) (5.1% of them are naturalized citizens)
This zip code:
2.6%
Whole state:
5.1%
92%Malaysia
3%Honduras
13%American
10%English
2%Italian
2%German
1%African
1%Irish
0%Scotch-Irish
Year of entry for the foreign-born population
662010 or later
12000 to 2009
01990 to 1999
1Before 1990
Facilities with environmental interests located in this zip code:
EBENEZER BAPTIST CHURCH (600 NORRIS CUTOFF in STRONG, AR)
National Pollutant Discharge Elimination System NON-MAJOR (Tracking pollutant discharge elimination systems) - permit STATE MASTER (PDS) - WATER-ARG550200, National Pollutant Discharge Elimination System Permit Business SIC classification: SEWERAGE SYSTEMS
GARDNER-STRONG ELEM. SCHOOL (P.O. BOX 735 in STRONG, AR)
(National Center for Education Statistics) - STATE ID-7009048
LION OIL CO (TOWNSHIP 18 RANGE 12 SECTION 6 in STRONG, AR)
(Resource Conservation and Recovery Act (tracking hazardous waste))
(Resource Conservation and Recovery Act (tracking hazardous waste)) Alternative names: NAPA AUTO SUPPLY
Housing units lacking complete plumbing facilities: 3.7% Housing units lacking complete kitchen facilities: 4.2%
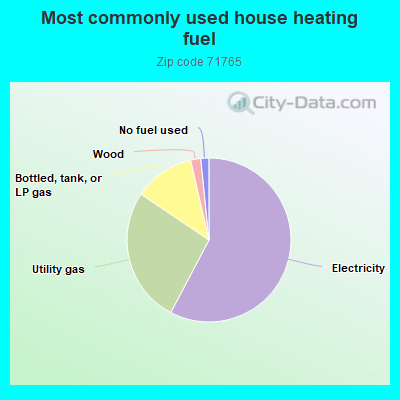
57.9%Electricity
26.8%Utility gas
12.0%Bottled, tank, or LP gas
2.0%Wood
1.6%No fuel used
Population in 1990: 2,738.
Place of birth for U.S.-born residents:
This state: 1,794
Northeast: 8
Midwest: 9
South: 459
West: 13
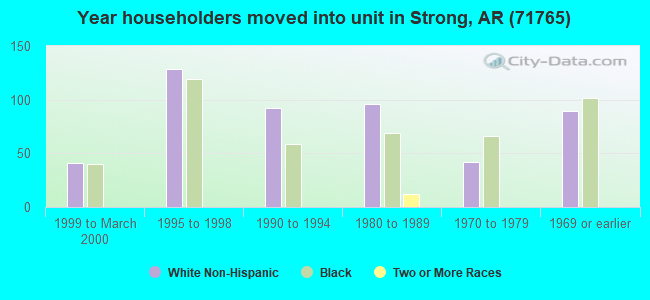
68% of the 71765 zip code residents lived in the same house 5 years ago. Out of people who lived in different houses, 77% lived in this county. Out of people who lived in different counties, 50% lived in Arkansas.
100% of the 71765 zip code residents lived in the same house 1 year ago.
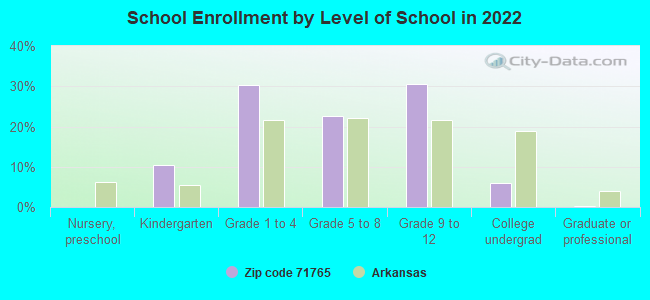
Private vs. public school enrollment:
Students in private schools in grades 1 to 8 (elementary and middle school): 57
Here:
15.6%
Arkansas:
10.5%
Students in private schools in grades 9 to 12 (high school):
Here:
0.0%
Arkansas:
8.7%
Students in private undergraduate colleges:
Here:
0.0%
Arkansas:
19.4%
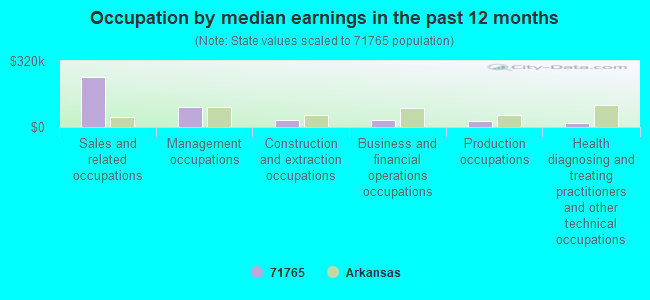
Occupation by median earnings in the past 12 months ($)
244,107Sales and related occupations
96,739Management occupations
35,507Construction and extraction occupations
34,367Business and financial operations occupations
30,312Production occupations
19,993Health diagnosing and treating practitioners and other technical occupations
Top industries in this zip code by the number of employees in 2005:
Accommodation and Food Services: Limited-Service Restaurants (10-19: 1)
Health Care and Social Assistance: All Other Outpatient Care Centers (10-19: 1)
Construction: Power and Communication Line and Related Structures Construction (10-19: 1)
Fatal accident statistics in 2013:
Fatal accident count: 1
Vehicles involved in fatal accidents: 1
Fatal accidents caused by drunken drivers: 0
Fatalities: 1
Persons involved in fatal accidents: 1
Pedestrians involved in fatal accidents: 0
Fatal accident statistics in 2010:
Fatal accident count: 2
Vehicles involved in fatal accidents: 2
Fatal accidents caused by drunken drivers: 0
Fatalities: 2
Persons involved in fatal accidents: 6
Pedestrians involved in fatal accidents: 0
2002 - 2018 National Fire Incident Reporting System (NFIRS) incidents
Based on the data from the years 2002 - 2018 the average number of fires per year is 9. The highest number of fire incidents - 25 took place in 2006, and the least - 0 in 2008. The data has a declining trend.
When looking into fire subcategories, the most incidents belonged to: Structure Fires (39.6%), and Outside Fires (32.5%).
Fire incident types reported to NFIRS in Zip Code 71765


 Nearest zip codes: 71747, 71651, 71260, 71724, 71277, 71730.


 Based on the data from the years 2002 - 2018 the average number of fires per year is 9. The highest number of fire incidents - 25 took place in 2006, and the least - 0 in 2008. The data has a declining trend.
 When looking into fire subcategories, the most incidents belonged to: Structure Fires (39.6%), and Outside Fires (32.5%).