Estimated zip code population in 2022: 4,855 Zip code population in 2010: 4,074 Zip code population in 2000: 2,761
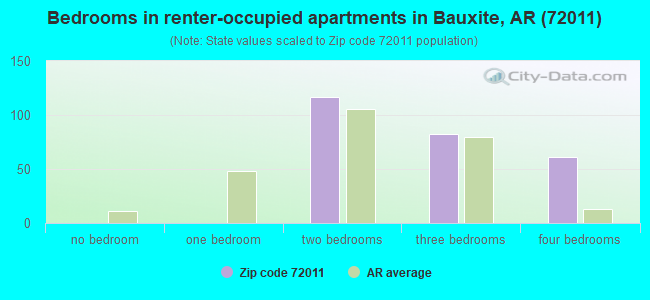
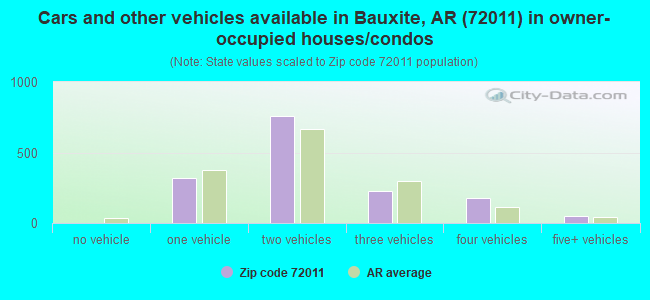
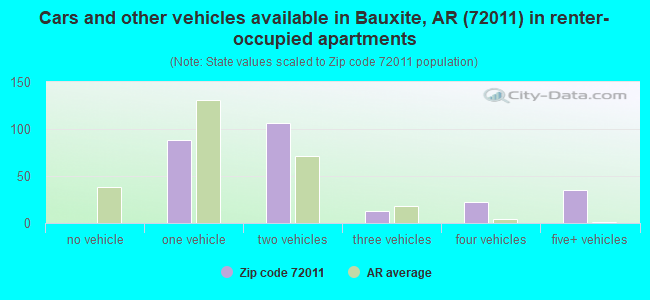
Houses and condos: 1,897 Renter-occupied apartments: 263
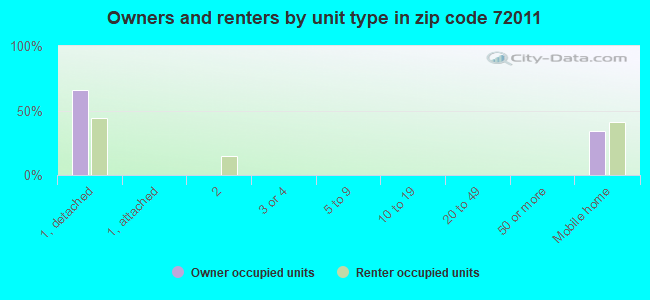
% of renters here:
15%
State:
34%
March 2022 cost of living index in zip code 72011: 78.8 (low, U.S. average is 100)
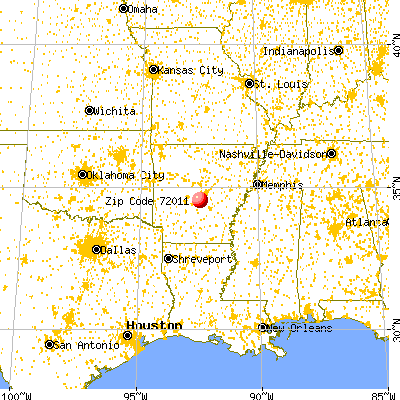
Land area: 56.3 sq. mi. Water area: 0.9 sq. mi.
Population density: 86 people per square mile
(very low).
OSM Map
General Map
Google Map
MSN Map
OSM Map
General Map
Google Map
MSN Map
OSM Map
General Map
Google Map
MSN Map
OSM Map
General Map
Google Map
MSN Map
Please wait while loading the map...
Real estate property taxes paid for housing units in 2022:
This zip code:
0.4% ($754)
Arkansas:
0.5% ($977)
Median real estate property taxes paid for housing units with mortgages in 2022: $634 (0.3%) Median real estate property taxes paid for housing units with no mortgage in 2022: $992 (0.6%)
Business Search- 14 Million verified businesses
Males: 2,520
(51.9%)
Females: 2,335
(48.1%)
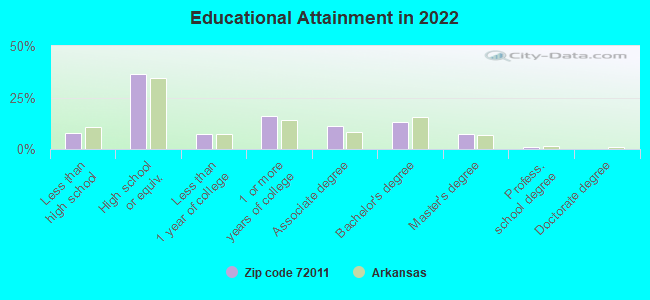
For population 25 years and over in 72011:
High school or higher: 92.7%
Bachelor's degree or higher: 21.7%
Graduate or professional degree: 8.4%
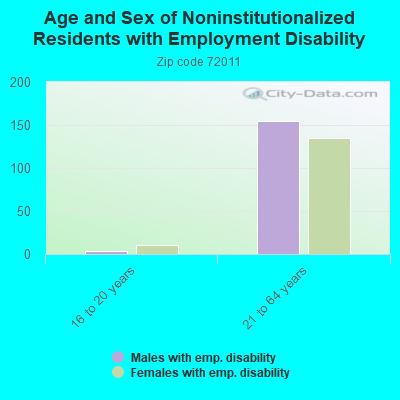
Unemployed: 3.2%
Mean travel time to work (commute): 28.7 minutes
For population 15 years and over in 72011:
Never married: 20.6%
Now married: 60.6%
Separated: 0.5%
Widowed: 5.5%
Divorced: 12.7%
Zip code 72011 compared to state average:
Black race population percentage significantly below state average.
Renting percentage significantly below state average.
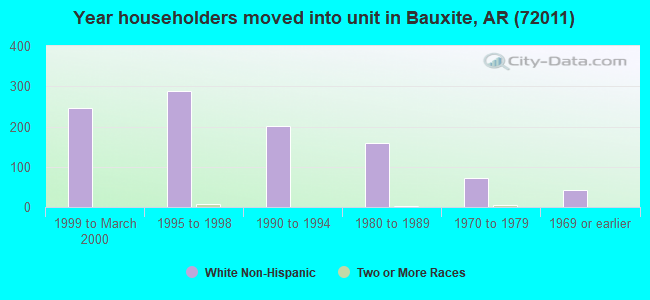
Length of stay since moving in significantly above state average.
Averages for the 2020 tax year for zip code 72011, filed in 2021:
Average Adjusted Gross Income (AGI) in 2020: $57,473 (Individual Income Tax Returns)
Here:
$57,473
State:
$64,872
Salary/wage: $54,836 (reported on 85.9% of returns)
Here:
$54,836
State:
$50,644
(% of AGI for various income ranges: 1169.6% for AGIs below $25k, 3767.4% for AGIs $25k-50k, 6764.4% for AGIs $50k-75k, 10233.1% for AGIs $75k-100k, 16875.9% for AGIs $100k-200k)
Taxable interest for individuals: $468 (reported on 17.8% of returns)
This zip code:
$468
Arkansas:
$1,857
(% of AGI for various income ranges: 6.1% for AGIs below $25k, 9.6% for AGIs $25k-50k, 7.6% for AGIs $50k-75k, 9.4% for AGIs $75k-100k, 15.5% for AGIs $100k-200k)
Ordinary dividends: $1,536 (reported on 6.6% of returns)
Here:
$1,536
State:
$21,681
(% of AGI for various income ranges: 2.9% for AGIs below $25k, 7.4% for AGIs $25k-50k, 17.2% for AGIs $50k-75k, 55.9% for AGIs $100k-200k)
Net capital gain/loss in AGI: +$7,292 (reported on 6.1% of returns)
Here:
+$7,292
State:
+$22,815
(% of AGI for various income ranges: 5.1% for AGIs below $25k, 6.8% for AGIs $50k-75k, 411.8% for AGIs $100k-200k)
Profit/loss from business: +$10,938 (reported on 15.0% of returns)
Here:
+$10,938
State:
+$9,743
(% of AGI for various income ranges: 154.5% for AGIs below $25k, 121.5% for AGIs $25k-50k, 156.0% for AGIs $50k-75k, 336.2% for AGIs $75k-100k, 565.5% for AGIs $100k-200k)
Taxable individual retirement arrangement distribution: $11,036 (reported on 5.2% of returns)
72011:
$11,036
Arkansas:
$18,502
(% of AGI for various income ranges: 28.6% for AGIs below $25k, 43.0% for AGIs $25k-50k, 154.0% for AGIs $50k-75k, 221.4% for AGIs $100k-200k)
Total itemized deductions: $30,562 (reported on 3.8% of returns)
Here:
$30,562
State:
$52,840
(% of AGI for various income ranges: 312.4% for AGIs $50k-75k, 756.4% for AGIs $100k-200k)
Charity contributions: $12,571 (reported on 3.3% of returns)
Here:
$12,571
State:
$35,735
(% of AGI for various income ranges: 53.2% for AGIs $50k-75k, 339.5% for AGIs $100k-200k)
Taxes paid: $7,575 (reported on 3.8% of returns)
72011:
$7,575
State:
$7,196
(% of AGI for various income ranges: 72.4% for AGIs $50k-75k, 193.2% for AGIs $100k-200k)
Earned income credit: $2,535 (reported on 17.4% of returns)
Here:
$2,535
State:
$2,546
(% of AGI for various income ranges: 118.4% for AGIs below $25k, 76.2% for AGIs $25k-50k)
Percentage of individuals using paid preparers for their 2020 taxes: 94.4%
Here:
94%
State:
94%
(% for various income ranges: 95.2% for AGIs below $25k, 94.8% for AGIs $25k-50k, 93.9% for AGIs $50k-75k, 95.5% for AGIs $75k-100k, 91.4% for AGIs $100k-200k, 100.0% for AGIs over 200k)
Averages for the 2012 tax year for zip code 72011, filed in 2013:
Average Adjusted Gross Income (AGI) in 2012: $45,071 (Individual Income Tax Returns)
Here:
$45,071
State:
$52,148
Salary/wage: $42,801 (reported on 88.5% of returns)
Here:
$42,801
State:
$41,669
(% of AGI for various income ranges: 76.9% for AGIs below $25k, 84.1% for AGIs $25k-50k, 84.7% for AGIs $50k-75k, 88.5% for AGIs $75k-100k, 83.0% for AGIs $100k-200k)
Taxable interest for individuals: $541 (reported on 18.6% of returns)
This zip code:
$541
Arkansas:
$1,648
(% of AGI for various income ranges: 0.4% for AGIs below $25k, 0.3% for AGIs $25k-50k, 0.1% for AGIs $50k-75k, 0.2% for AGIs $75k-100k, 0.2% for AGIs $100k-200k)
Ordinary dividends: $923 (reported on 7.1% of returns)
Here:
$923
State:
$20,675
(% of AGI for various income ranges: 0.3% for AGIs below $25k, 0.3% for AGIs $25k-50k, 0.2% for AGIs $100k-200k)
Net capital gain/loss in AGI: +$4,800 (reported on 4.4% of returns)
Here:
+$4,800
State:
+$15,222
(% of AGI for various income ranges: 0.1% for AGIs $50k-75k, 1.8% for AGIs $100k-200k)
Profit/loss from business: +$7,110 (reported on 15.8% of returns)
Here:
+$7,110
State:
+$9,665
(% of AGI for various income ranges: 9.0% for AGIs below $25k, 2.2% for AGIs $25k-50k, 2.6% for AGIs $50k-75k, 0.9% for AGIs $75k-100k, 1.1% for AGIs $100k-200k)
Taxable individual retirement arrangement distribution: $10,100 (reported on 5.5% of returns)
72011:
$10,100
Arkansas:
$13,644
(% of AGI for various income ranges: 1.3% for AGIs below $25k, 2.7% for AGIs $25k-50k, 2.4% for AGIs $75k-100k)
Total itemized deductions: $16,887 (21% of AGI, reported on 25.7% of returns)
Here:
$16,887
State:
$23,276
Here:
21.4% of AGI
State:
19.1% of AGI
(% of AGI for various income ranges: 5.0% for AGIs below $25k, 6.6% for AGIs $25k-50k, 9.1% for AGIs $50k-75k, 12.0% for AGIs $75k-100k, 12.8% for AGIs $100k-200k)
Charity contributions: $3,143 (reported on 19.1% of returns)
Here:
$3,143
State:
$5,996
(% of AGI for various income ranges: 1.0% for AGIs $25k-50k, 1.4% for AGIs $50k-75k, 1.5% for AGIs $75k-100k, 2.0% for AGIs $100k-200k)
Taxes paid: $5,336 (reported on 25.7% of returns)
72011:
$5,336
State:
$7,941
(% of AGI for various income ranges: 1.1% for AGIs below $25k, 1.2% for AGIs $25k-50k, 2.2% for AGIs $50k-75k, 4.0% for AGIs $75k-100k, 5.4% for AGIs $100k-200k)
Earned income credit: $2,446 (reported on 22.4% of returns)
Here:
$2,446
State:
$2,455
(% of AGI for various income ranges: 7.8% for AGIs below $25k, 1.6% for AGIs $25k-50k)
Percentage of individuals using paid preparers for their 2012 taxes: 59.6%
Here:
60%
State:
61%
(% for various income ranges: 57.1% for AGIs below $25k, 62.5% for AGIs $25k-50k, 58.6% for AGIs $50k-75k, 60.0% for AGIs $75k-100k, 62.5% for AGIs $100k-200k)
Averages for the 2004 tax year for zip code 72011, filed in 2005:
Average Adjusted Gross Income (AGI) in 2004: $36,008 (Individual Income Tax Returns)
Here:
$36,008
State:
$39,270
Salary/wage: $35,215 (reported on 89.2% of returns)
Here:
$35,215
State:
$34,079
(% of AGI for various income ranges: 99.0% for AGIs below $10k, 81.3% for AGIs $10k-25k, 85.8% for AGIs $25k-50k, 89.6% for AGIs $50k-75k, 88.5% for AGIs $75k-100k, 86.6% for AGIs over 100k)
Taxable interest for individuals: $634 (reported on 27.0% of returns)
This zip code:
$634
Arkansas:
$1,904
(% of AGI for various income ranges: 2.2% for AGIs below $10k, 0.8% for AGIs $10k-25k, 0.6% for AGIs $25k-50k, 0.3% for AGIs $50k-75k, 0.2% for AGIs $75k-100k, 0.3% for AGIs over 100k)
Taxable dividends: $478 (reported on 9.4% of returns)
Here:
$478
State:
$5,995
(% of AGI for various income ranges: 0.2% for AGIs below $10k, 0.4% for AGIs $10k-25k, 0.1% for AGIs $25k-50k, 0.1% for AGIs $50k-75k, 0.1% for AGIs $75k-100k)
Net capital gain/loss: +$314 (reported on 7.3% of returns)
Here:
+$314
State:
+$10,430
(% of AGI for various income ranges: -1.3% for AGIs below $10k, -0.1% for AGIs $10k-25k, -0.1% for AGIs $25k-50k, 0.1% for AGIs $50k-75k, -0.0% for AGIs $75k-100k, 1.0% for AGIs over 100k)
Profit/loss from business: +$5,671 (reported on 17.0% of returns)
Here:
+$5,671
State:
+$7,823
(% of AGI for various income ranges: 7.4% for AGIs below $10k, 5.3% for AGIs $10k-25k, 3.4% for AGIs $25k-50k, 0.2% for AGIs $50k-75k, 4.6% for AGIs $75k-100k)
IRA payment deduction: $2,333 (reported on 1.0% of returns)
72011:
$2,333
Arkansas:
$3,204
Total itemized deductions: $14,438 (23% of AGI, reported on 24.3% of returns)
Here:
$14,438
State:
$18,389
Here:
23.3% of AGI
State:
21.0% of AGI
(% of AGI for various income ranges: 7.2% for AGIs $10k-25k, 8.3% for AGIs $25k-50k, 9.8% for AGIs $50k-75k, 13.5% for AGIs $75k-100k, 13.3% for AGIs over 100k)
Charity contributions deductions: $2,769 (4% of AGI, reported on 18.9% of returns)
Here:
$2,769
State:
$4,725
Here:
4.3% of AGI
State:
5.1% of AGI
(% of AGI for various income ranges: 0.4% for AGIs $10k-25k, 1.2% for AGIs $25k-50k, 1.5% for AGIs $50k-75k, 2.2% for AGIs $75k-100k, 2.3% for AGIs over 100k)
Total tax: $3,877 (reported on 73.9% of returns)
72011:
$3,877
State:
$6,047
(% of AGI for various income ranges: 2.8% for AGIs below $10k, 3.9% for AGIs $10k-25k, 5.9% for AGIs $25k-50k, 8.2% for AGIs $50k-75k, 9.9% for AGIs $75k-100k, 16.3% for AGIs over 100k)
Earned income credit: $1,682 (reported on 19.6% of returns)
Here:
$1,682
State:
$1,909
Percentage of individuals using paid preparers for their 2004 taxes: 64.7%
Here:
65%
State:
67%
(% for various income ranges: 58.1% for AGIs below $10k, 68.9% for AGIs $10k-25k, 65.3% for AGIs $25k-50k, 62.5% for AGIs $50k-75k, 66.0% for AGIs $75k-100k, 76.3% for AGIs over 100k)
Likely homosexual households (counted as self-reported same-sex unmarried-partner households)
Lesbian couples: 0.4% of all households
Gay men: 0.0% of all households
Household received Food Stamps/SNAP in the past 12 months: 32 Household did not receive Food Stamps/SNAP in the past 12 months: 1,772
Women who had a birth in the past 12 months: 78 (28 now married, 48 unmarried) Women who did not have a birth in the past 12 months: 817 (572 now married, 248 unmarried)
Housing units in zip code 72011 with a mortgage: 724 (52 second mortgage, 41 both second mortgage and home equity loan) Houses without a mortgage: 20
Median monthly owner costs for units with a mortgage: $1,245 Median monthly owner costs for units without a mortgage: $383
Residents with income below the poverty level in 2022:
This zip code:
5.3%
Whole state:
16.8%
Residents with income below 50% of the poverty level in 2022:
This zip code:
1.6%
Whole state:
8.5%
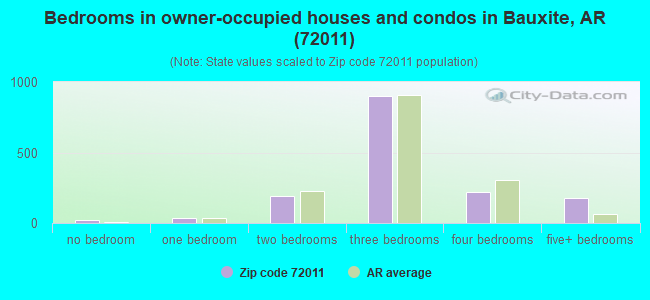
Median number of rooms in houses and condos:
Here:
5.9
State:
6.1
Median number of rooms in apartments:
Here:
5.5
State:
4.3
Notable locations in this zip code not listed on our city pages
Notable locations in zip code 72011: Sardis Volunteer Fire Department (A), Bauxite Police Department (B), Bauxite Volunteer Fire Department Station 1 (C), Bauxite Volunteer Fire Station 2 (D). Display/hide their locations on the map
Churches in zip code 72011 include: West Bauxite Missionary Baptist Church (A), Mars Hill Church (B), Mount Olive Church (C), Sardis United Methodist Church (D), Pleasant Hill Baptist Church (E), Plainview Church (F). Display/hide their locations on the map
Lakes and reservoirs: Dotty Lake (A), Old Brown Mud Lakes (B), Timber Lake (C), Holding Pond Number Two Reservoir (D). Display/hide their locations on the map
Streams, rivers, and creeks: Muddy Branch (A), Emory Branch (B), Blue Branch (C), Sanders Branch (D), Brier Lick Branch (E), Big Branch (F), Brushy Creek (G). Display/hide their locations on the map
Size of family households: 587 2-persons, 243 3-persons, 198 4-persons, 117 5-persons, 126 6-persons, 26 7-or-more-persons
Size of nonfamily households: 431 1-person, 64 2-persons
981 married couples with children.
59 single-parent households (33 men, 26 women).
96.3% of residents of 72011 zip code speak English at home.
3.1% of residents speak Spanish at home (48% very well, 52% well).
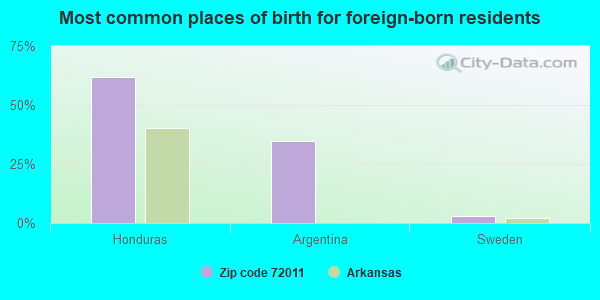
Foreign born population: 181 (3.7%) (51.4% of them are naturalized citizens)
This zip code:
3.7%
Whole state:
5.1%
62%Honduras
35%Argentina
3%Sweden
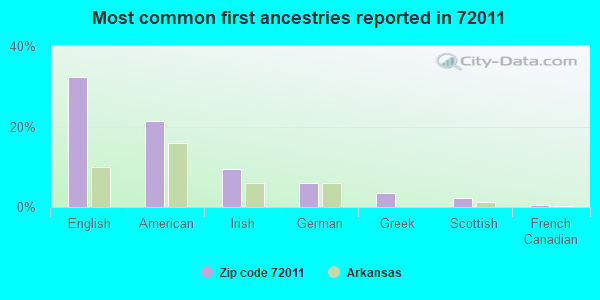
32%English
21%American
9%Irish
6%German
3%Greek
2%Scottish
1%French Canadian
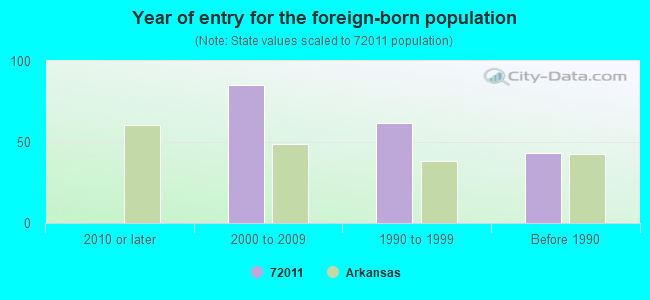
Year of entry for the foreign-born population
02010 or later
852000 to 2009
621990 to 1999
43Before 1990
Facilities with environmental interests located in this zip code:
ALCOA WORLD CHEMICALS (4701 ALCOA ROAD in BAUXITE, AR)
AIR MAJOR (AIRS/AFS) (Integrated Compliance Information System) - ICIS-06-1993-0173, FORMAL ENFORCEMENT ACTION, ICIS-06-1985-0066, CRITERIA AND HAZARDOUS AIR POLLUTANT INVENTORY (Inventory of air pollution sources) National Pollutant Discharge Elimination System MAJOR (Tracking pollutant discharge elimination systems) - permit National Pollutant Discharge Elimination System NON-MAJOR (Tracking pollutant discharge elimination systems) - permit National Pollutant Discharge Elimination System NON-MAJOR (Tracking pollutant discharge elimination systems) - permit STATE MASTER (PDS) - AIR-0328-A, AIR PROGRAM, AIR-0394-A, AIR-0417-A, AIR-0583-A, AIR-0606-A, AIR-0621-A, AIR-0626-A, AIR-0665-A, AIR-0666-A, AIR-0738-A, AIR-0861-AR-3, AIR-0861-AR-4, AIR-1325-A, AIR-1325-AR-1, AIR-1325-AR-2, AIR-1325-AR-3, AIR-1325-AR-4, AIR-1325-AR-5, AIR-1325-AR-6, AIR-1527-A, AIR-1527-AOP-R0, AIR MAJOR, AIR-1527-AOP-R1, AIR-1527-AOP-R2, AIR-1527-AOP-R3, AIR-1527-AOP-R4, AIR-1527-AOP-R5, SOLID WASTE-0204-S, REFUSE DISPOSAL, WATER-0023-W, NPDES STORMWATER PERMIT, WATER-1145-W, WATER-ARR00A196, National Pollutant Discharge Elimination System Permit, WATER-ARR00C256, NPDES STORMWATER PERMIT, WATER-2082-W, WATER-AR0000582-A, NPDES MAJOR, WATER-AR0000582-B, WATER-AR0050270, National Pollutant Discharge Elimination System Permit, WATER-AR0050270C, RST-63000010, FACILITY, RST-63001618, RST-63001660, HAZARDOUS WASTE BIENNIAL REPORTER (Resource Conservation and Recovery Act (tracking hazardous waste)) Small Quantity Generators, between 100 kg and 1000 kg of hazardous waste/month (Resource Conservation and Recovery Act (tracking hazardous waste)) - notification TRI REPORTER (Tracking of toxic chemicals releasing facilities) Business SIC classification: MISCELLANEOUS METAL ORES; INDUSTRIAL INORGANIC CHEMICALS; CHEMICALS AND CHEMICAL PREPARATIONS Business NAICS classification: ALL OTHER MISCELLANEOUS CHEMICAL PRODUCT AND PREPARATION MANUFACTURING. Organizations: EDWIN J BLACK (CONTACT/OPERATOR)
, ALOCA INC (CONTACT/OWNER)
, ALMATIS INC (CONTACT/OWNER)
Alternative names: ALCOA CO-BAUXITE, ALCOA ALUMINA & CHEMICALS L.L.C. ARKANSAS OPS., ALCOA ALUMINA & CHEMICALS LLC, ALCOA WORLD CHEMICALS ARKANSAS OPS., ALMATIS INC, ALMATIS INC BAUXITE ARKANSAS
BAUXITE HIGH SCHOOL (800 SCHOOL STREET in BAUXITE, AR)
(Geographic Names Information System) (National Center for Education Statistics) - STATE ID-6301002 STATE MASTER (PDS) - RST-63000015, FACILITY Organizations: BAUXITE SCHOOL DISTRICT #14 (CONTACT/GENERAL)
DRUMCO OF ARK, INC (3200 SOUTH REYNOLDS ROAD in BAUXITE, AR)
AIR SYNTHETIC MINOR (AIRS/AFS) STATE MASTER (PDS) - AIR-1416-AR-1, AIR PROGRAM, AIR-1416-A, AIR-1416-AR-2, AIR MINOR, AIR-1416-AR-3, AIR-1416-AR-4, AIR-1416-AR-5, AIR-1416-AR-6, HAZARDOUS WASTE BIENNIAL REPORTER (Resource Conservation and Recovery Act (tracking hazardous waste)) (Resource Conservation and Recovery Act (tracking hazardous waste)) Business SIC classification: REPAIR SHOPS AND RELATED SERVICES Organizations: DRUMCO OF ARKANSAS INC (CONTACT/OPERATOR)
, DAVID E WINGARD/D BARRY WINGARD (CONTACT/OWNER)
Alternative names: DRUMCO OF ARKANSAS INC, DRUMCO OF ARKANSAS, INCORPORATED
BAUXITE & NORTHERN RAILWAY (6232 CYANMID RD in BAUXITE, AR)
STATE MASTER (PDS) - WATER-4314-W, NPDES STORMWATER PERMIT, WATER-ARR00A959, RST-63000009, FACILITY Conditionally Exempt Small Quantity Generators, less than 100 kg/month of hazardous waste (Resource Conservation and Recovery Act (tracking hazardous waste)) - notification Organizations: BAUXITE & NORTHERN RAILWAY CO (CONTACT/GENERAL)
, ALUMINUM CO OF AMERICA (CONTACT/OWNER)
GRANITE MOUNTAIN QUARRIES #3 (2300 COUNTY ROAD 2 in BAUXITE, AR)
National Pollutant Discharge Elimination System NON-MAJOR (Tracking pollutant discharge elimination systems) - permit STATE MASTER (PDS) - WATER-ARG500009, National Pollutant Discharge Elimination System Permit Business SIC classification: CRUSHED AND BROKEN GRANITE Alternative names: MCGEORGE CONTRACTING CO., INC.
ARCH ST. SUPER SHELL STOP (21209 ARCH ST in BAUXITE, AR)
(Integrated Compliance Information System) - ICIS-06-1998-0464, FORMAL ENFORCEMENT ACTION Business SIC classification: GASOLINE SERVICE STATIONS
KITTY WHISKERS DIV ALCOA (P O BOX 300 in BAUXITE, AR)
(Integrated Compliance Information System) - ICIS-06-1989-0703, FORMAL ENFORCEMENT ACTION
BAUXITE NORTHERN RAILWAY (GIBBONS ROAD in BAUXITE, AR)
(Resource Conservation and Recovery Act (tracking hazardous waste)) Organizations: ALUMINUM CO AMERICA (CONTACT/OWNER)
BAUXITE WW TREATMENT FACILITY (201 PINE HAVEN RD in BAUXITE, AR)
National Pollutant Discharge Elimination System NON-MAJOR (Tracking pollutant discharge elimination systems) - permit Business SIC classification: SEWERAGE SYSTEMS Alternative names: BAUXITE, CITY OF
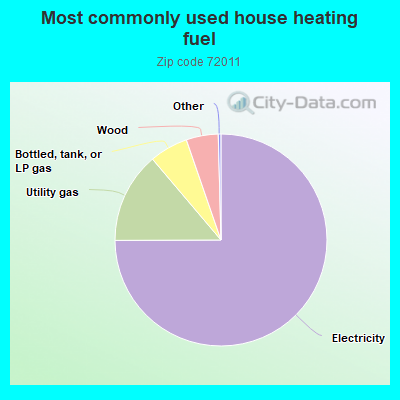
75.1%Electricity
13.9%Utility gas
5.9%Bottled, tank, or LP gas
4.9%Wood
Population in 1990: 6,956.
Place of birth for U.S.-born residents:
This state: 3,553
Northeast: 10
Midwest: 185
South: 688
West: 195
48% of the 72011 zip code residents lived in the same house 5 years ago. Out of people who lived in different houses, 57% lived in this county. Out of people who lived in different counties, 50% lived in Arkansas.
95% of the 72011 zip code residents lived in the same house 1 year ago. Out of people who lived in different houses, 63% moved from this county. Out of people who lived in different houses, 28% moved from different county within same state. Out of people who lived in different houses, 8% moved from different state.
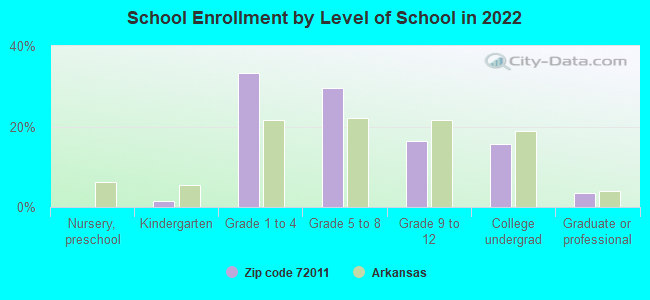
Private vs. public school enrollment:
Students in private schools in grades 1 to 8 (elementary and middle school): 10
Here:
1.3%
Arkansas:
10.5%
Students in private schools in grades 9 to 12 (high school): 8
Here:
4.2%
Arkansas:
8.7%
Students in private undergraduate colleges: 24
Here:
12.9%
Arkansas:
19.4%
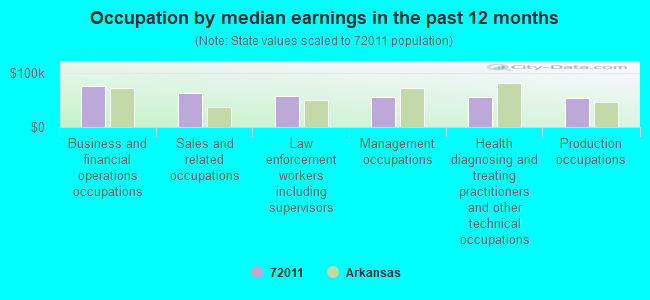
Occupation by median earnings in the past 12 months ($)
75,011Business and financial operations occupations
63,561Sales and related occupations
56,992Law enforcement workers including supervisors
55,753Management occupations
55,087Health diagnosing and treating practitioners and other technical occupations
53,322Production occupations
Companies with federal contracts located in this zip code:
MANITOWOC RE-MANUFACTURING INC (16013 W SARDIS RD in BAUXITE, AR; small business) : $89,927 in 11 contractsfrom 2003 to 2006
Contracts for Maintenance, Repair and Rebuilding of Equipment -- Materials Handling Equipment, Installation of Equipment -- Miscellaneous, Gears, Pulleys, Sprockets, and Transmission Chain, Maintenance, Repair and Rebuilding of Equipment -- Miscellaneous, and moreby U.S. Army Corps of Engineers - civil program financing only, Army Signed by year:2000: $0; 2001: $0; 2002: $0; 2003: $36,174; 2004: $16,654; 2005: $28,198; 2006: $8,901.
Biggest contracts:
$36,174 with U.S. Army Corps of Engineers - civil program financing only for Maintenance, Repair and Rebuilding of Equipment -- Materials Handling Equipment. Signed on 2003-07-18. Completion date: 2003-06-19.
$9,347 with U.S. Army Corps of Engineers - civil program financing only for Installation of Equipment -- Miscellaneous. Signed on 2005-04-21. Completion date: 2005-05-01.
$9,347 with Army for Installation of Equipment -- Miscellaneous. Signed on 2005-04-21. Completion date: 2005-05-01.
$8,901 with Army for Gears, Pulleys, Sprockets, and Transmission Chain. Signed on 2006-02-06. Completion date: 2006-02-20.
DRUMCO OF ARKANSAS INC (3200 S REYNOLDS RD in BAUXITE, AR; small business)
$10,206 with Army for Drums and Cans. Signed on 2004-05-14. Completion date: 2004-06-15.
Top industries in this zip code by the number of employees in 2005:
Construction: Poured Concrete Foundation and Structure Contractors (10-19 employees: 1 establishment)
Other Services (except Public Administration): Commercial and Industrial Machinery and Equipment (except Automotive and Electronic) Repair and Maintenance (10-19: 1)
Fatal accident statistics in 2013:
Fatal accident count: 1
Vehicles involved in fatal accidents: 2
Fatal accidents caused by drunken drivers: 0
Fatalities: 1
Persons involved in fatal accidents: 2
Pedestrians involved in fatal accidents: 0
Fatal accident statistics in 2012:
Fatal accident count: 1
Vehicles involved in fatal accidents: 2
Fatal accidents caused by drunken drivers: 0
Fatalities: 1
Persons involved in fatal accidents: 4
Pedestrians involved in fatal accidents: 0
Home Mortgage Disclosure Act Aggregated Statistics For Year 2009 (Based on 2 partial tracts)
A) FHA, FSA/RHS & VA Home Purchase Loans
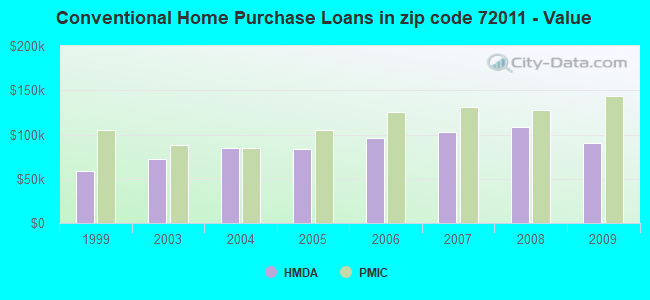
B) Conventional Home Purchase Loans
C) Refinancings
D) Home Improvement Loans
F) Non-occupant Loans on < 5 Family Dwellings (A B C & D)
G) Loans On Manufactured Home Dwelling (A B C & D)
Number
Average Value
Number
Average Value
Number
Average Value
Number
Average Value
Number
Average Value
Number
Average Value
LOANS ORIGINATED
36
$118,612
17
$90,845
111
$180,825
12
$32,718
12
$630,893
28
$54,536
APPLICATIONS APPROVED, NOT ACCEPTED
3
$75,280
3
$125,080
7
$76,933
0
$0
3
$145,347
5
$50,032
APPLICATIONS DENIED
19
$84,392
24
$50,596
33
$109,128
17
$13,182
0
$0
35
$48,890
APPLICATIONS WITHDRAWN
3
$195,147
5
$112,224
30
$136,660
2
$59,935
2
$34,745
0
$0
FILES CLOSED FOR INCOMPLETENESS
3
$116,393
0
$0
3
$150,557
0
$0
0
$0
0
$0
Aggregated Statistics For Year 2008 (Based on 2 partial tracts)
A) FHA, FSA/RHS & VA Home Purchase Loans
B) Conventional Home Purchase Loans
C) Refinancings
D) Home Improvement Loans
F) Non-occupant Loans on < 5 Family Dwellings (A B C & D)
G) Loans On Manufactured Home Dwelling (A B C & D)
Number
Average Value
Number
Average Value
Number
Average Value
Number
Average Value
Number
Average Value
Number
Average Value
LOANS ORIGINATED
50
$117,018
50
$108,992
90
$153,607
16
$21,389
28
$220,128
35
$64,773
APPLICATIONS APPROVED, NOT ACCEPTED
0
$0
5
$79,564
7
$130,041
2
$6,080
0
$0
3
$49,800
APPLICATIONS DENIED
21
$103,984
21
$62,787
56
$125,202
19
$17,189
7
$70,977
33
$61,065
APPLICATIONS WITHDRAWN
2
$112,050
3
$139,557
24
$134,633
0
$0
0
$0
2
$67,750
FILES CLOSED FOR INCOMPLETENESS
2
$116,390
3
$203,830
5
$180,668
0
$0
0
$0
0
$0
Aggregated Statistics For Year 2007 (Based on 2 partial tracts)
A) FHA, FSA/RHS & VA Home Purchase Loans
B) Conventional Home Purchase Loans
C) Refinancings
D) Home Improvement Loans
F) Non-occupant Loans on < 5 Family Dwellings (A B C & D)
G) Loans On Manufactured Home Dwelling (A B C & D)
Number
Average Value
Number
Average Value
Number
Average Value
Number
Average Value
Number
Average Value
Number
Average Value
LOANS ORIGINATED
21
$98,772
120
$102,698
80
$135,675
26
$41,693
14
$312,696
61
$72,877
APPLICATIONS APPROVED, NOT ACCEPTED
2
$85,990
12
$110,457
17
$123,341
2
$43,430
3
$143,610
7
$78,670
APPLICATIONS DENIED
5
$90,682
57
$76,071
38
$106,289
30
$15,519
16
$100,541
40
$61,974
APPLICATIONS WITHDRAWN
3
$74,120
7
$90,831
23
$134,142
0
$0
2
$44,300
5
$62,192
FILES CLOSED FOR INCOMPLETENESS
2
$94,675
0
$0
7
$184,391
2
$66,880
2
$105,970
0
$0
Aggregated Statistics For Year 2006 (Based on 2 partial tracts)
A) FHA, FSA/RHS & VA Home Purchase Loans
B) Conventional Home Purchase Loans
C) Refinancings
D) Home Improvement Loans
F) Non-occupant Loans on < 5 Family Dwellings (A B C & D)
G) Loans On Manufactured Home Dwelling (A B C & D)
Number
Average Value
Number
Average Value
Number
Average Value
Number
Average Value
Number
Average Value
Number
Average Value
LOANS ORIGINATED
35
$110,139
125
$95,588
92
$101,532
19
$57,511
24
$76,943
69
$60,651
APPLICATIONS APPROVED, NOT ACCEPTED
5
$66,708
35
$63,433
12
$116,682
5
$20,152
2
$99,890
24
$44,371
APPLICATIONS DENIED
7
$91,576
59
$74,729
73
$95,213
14
$20,226
17
$77,868
64
$43,701
APPLICATIONS WITHDRAWN
3
$111,760
21
$98,028
42
$105,059
0
$0
3
$92,070
7
$52,860
FILES CLOSED FOR INCOMPLETENESS
2
$99,020
0
$0
5
$138,976
0
$0
0
$0
2
$99,020
Aggregated Statistics For Year 2005 (Based on 2 partial tracts)
A) FHA, FSA/RHS & VA Home Purchase Loans
B) Conventional Home Purchase Loans
C) Refinancings
D) Home Improvement Loans
F) Non-occupant Loans on < 5 Family Dwellings (A B C & D)
G) Loans On Manufactured Home Dwelling (A B C & D)
Number
Average Value
Number
Average Value
Number
Average Value
Number
Average Value
Number
Average Value
Number
Average Value
LOANS ORIGINATED
26
$102,027
106
$83,320
64
$100,649
17
$35,051
9
$102,494
73
$55,638
APPLICATIONS APPROVED, NOT ACCEPTED
2
$99,020
23
$74,397
21
$84,213
7
$34,993
3
$123,340
24
$59,354
APPLICATIONS DENIED
7
$75,444
80
$66,665
89
$95,507
24
$12,740
3
$90,333
82
$46,396
APPLICATIONS WITHDRAWN
5
$77,826
17
$96,875
36
$115,862
3
$30,690
3
$130,870
7
$76,933
FILES CLOSED FOR INCOMPLETENESS
2
$92,940
2
$36,480
5
$165,728
0
$0
0
$0
2
$92,940
Aggregated Statistics For Year 2004 (Based on 2 partial tracts)
A) FHA, FSA/RHS & VA Home Purchase Loans
B) Conventional Home Purchase Loans
C) Refinancings
D) Home Improvement Loans
F) Non-occupant Loans on < 5 Family Dwellings (A B C & D)
G) Loans On Manufactured Home Dwelling (A B C & D)
Number
Average Value
Number
Average Value
Number
Average Value
Number
Average Value
Number
Average Value
Number
Average Value
LOANS ORIGINATED
42
$91,162
83
$85,102
109
$96,964
21
$39,459
7
$73,210
64
$51,736
APPLICATIONS APPROVED, NOT ACCEPTED
0
$0
16
$53,744
26
$79,978
2
$13,030
7
$18,364
19
$41,053
APPLICATIONS DENIED
10
$62,365
73
$58,113
96
$81,069
28
$10,920
7
$54,101
96
$47,176
APPLICATIONS WITHDRAWN
5
$144,536
5
$112,570
54
$92,072
5
$32,312
0
$0
16
$72,528
FILES CLOSED FOR INCOMPLETENESS
0
$0
5
$76,784
21
$85,702
2
$41,695
2
$41,695
9
$82,420
Aggregated Statistics For Year 2003 (Based on 2 partial tracts)
A) FHA, FSA/RHS & VA Home Purchase Loans
B) Conventional Home Purchase Loans
C) Refinancings
D) Home Improvement Loans
F) Non-occupant Loans on < 5 Family Dwellings (A B C & D)
Number
Average Value
Number
Average Value
Number
Average Value
Number
Average Value
Number
Average Value
LOANS ORIGINATED
19
$83,294
50
$71,920
151
$77,127
14
$26,058
16
$54,939
APPLICATIONS APPROVED, NOT ACCEPTED
2
$38,220
9
$47,677
19
$67,294
2
$39,955
0
$0
APPLICATIONS DENIED
3
$86,860
45
$50,572
76
$66,539
10
$4,169
2
$43,430
APPLICATIONS WITHDRAWN
3
$69,487
9
$55,590
30
$70,646
3
$20,267
2
$54,720
FILES CLOSED FOR INCOMPLETENESS
0
$0
0
$0
7
$114,656
0
$0
0
$0
Aggregated Statistics For Year 1999 (Based on 1 partial tract)
A) FHA, FSA/RHS & VA Home Purchase Loans
B) Conventional Home Purchase Loans
C) Refinancings
D) Home Improvement Loans
F) Non-occupant Loans on < 5 Family Dwellings (A B C & D)
Detailed PMIC statistics for the following Tracts:0104.07
2002 - 2018 National Fire Incident Reporting System (NFIRS) incidents
Based on the data from the years 2002 - 2018 the average number of fires per year is 32. The highest number of reported fires - 86 took place in 2015, and the least - 7 in 2002. The data has an increasing trend.
When looking into fire subcategories, the most incidents belonged to: Outside Fires (49.3%), and Structure Fires (34.6%).
Fire incident types reported to NFIRS in Zip Code 72011


 Nearest zip codes: 72022, 72103, 72015, 72002, 72065, 72129.


 Based on the data from the years 2002 - 2018 the average number of fires per year is 32. The highest number of reported fires - 86 took place in 2015, and the least - 7 in 2002. The data has an increasing trend.
 When looking into fire subcategories, the most incidents belonged to: Outside Fires (49.3%), and Structure Fires (34.6%).