Estimated zip code population in 2022: 3,538 Zip code population in 2010: 3,242 Zip code population in 2000: 2,975
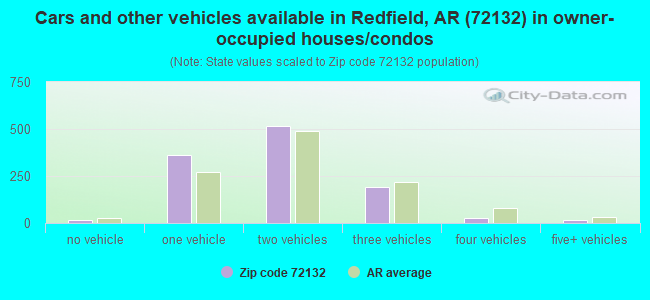
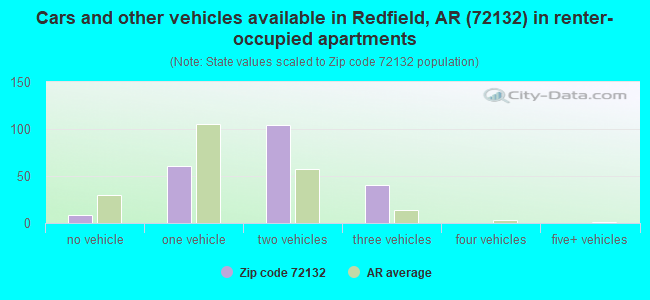
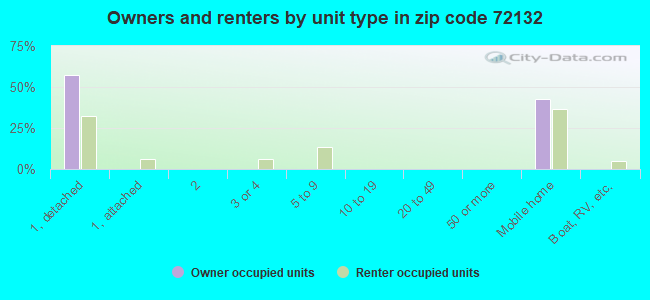
Houses and condos: 1,474 Renter-occupied apartments: 221
% of renters here:
16%
State:
34%
March 2022 cost of living index in zip code 72132: 78.9 (low, U.S. average is 100)
Land area: 60.9 sq. mi. Water area: 1.8 sq. mi.
Population density: 58 people per square mile
(very low).
OSM Map
General Map
Google Map
MSN Map
OSM Map
General Map
Google Map
MSN Map
OSM Map
General Map
Google Map
MSN Map
OSM Map
General Map
Google Map
MSN Map
Please wait while loading the map...
Real estate property taxes paid for housing units in 2022:
This zip code:
0.5% ($562)
Arkansas:
0.5% ($977)
Median real estate property taxes paid for housing units with mortgages in 2022: $742 (0.4%) Median real estate property taxes paid for housing units with no mortgage in 2022: $369 (0.4%)
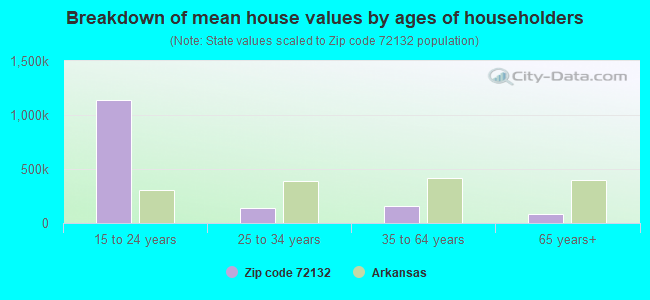
Estimated median house/condo value in 2022: $123,336
72132:
$123,336
Arkansas:
$179,800
According to our research of Arkansas and other state lists, there were 8 registered sex offenders living in 72132 zip code as of May 28, 2024. The ratio of all residents to sex offenders in zip code 72132 is 464 to 1. The ratio of registered sex offenders to all residents in this zip code is near the state average.
Median resident age:
This zip code:
38.9 years
Arkansas median age:
38.9 years
Average household size:
This zip code:
2.6 people
Arkansas:
2.4 people
Averages for the 2020 tax year for zip code 72132, filed in 2021:
Average Adjusted Gross Income (AGI) in 2020: $54,028 (Individual Income Tax Returns)
Here:
$54,028
State:
$64,872
Salary/wage: $50,161 (reported on 84.8% of returns)
Here:
$50,161
State:
$50,644
(% of AGI for various income ranges: 1197.4% for AGIs below $25k, 3442.9% for AGIs $25k-50k, 6662.4% for AGIs $50k-75k, 9990.0% for AGIs $75k-100k, 18951.5% for AGIs $100k-200k)
Taxable interest for individuals: $428 (reported on 18.4% of returns)
This zip code:
$428
Arkansas:
$1,857
(% of AGI for various income ranges: 4.5% for AGIs below $25k, 8.9% for AGIs $25k-50k, 3.3% for AGIs $50k-75k, 14.2% for AGIs $75k-100k, 40.0% for AGIs $100k-200k)
Ordinary dividends: $1,650 (reported on 7.6% of returns)
Here:
$1,650
State:
$21,681
(% of AGI for various income ranges: 12.3% for AGIs $25k-50k, 9.0% for AGIs $50k-75k, 104.6% for AGIs $100k-200k)
Net capital gain/loss in AGI: +$5,256 (reported on 5.7% of returns)
Here:
+$5,256
State:
+$22,815
(% of AGI for various income ranges: 7.1% for AGIs $50k-75k, 373.8% for AGIs $100k-200k)
Profit/loss from business: +$4,250 (reported on 13.9% of returns)
Here:
+$4,250
State:
+$9,743
(% of AGI for various income ranges: 68.4% for AGIs below $25k, 67.1% for AGIs $25k-50k, 8.3% for AGIs $75k-100k, 338.5% for AGIs $100k-200k)
Taxable individual retirement arrangement distribution: $13,550 (reported on 6.3% of returns)
72132:
$13,550
Arkansas:
$18,502
(% of AGI for various income ranges: 91.6% for AGIs below $25k, 199.5% for AGIs $50k-75k, 452.3% for AGIs $100k-200k)
Total itemized deductions: $29,500 (reported on 3.8% of returns)
Here:
$29,500
State:
$52,840
(% of AGI for various income ranges: 291.0% for AGIs $50k-75k, 891.5% for AGIs $100k-200k)
Charity contributions: $11,940 (reported on 3.2% of returns)
Here:
$11,940
State:
$35,735
(% of AGI for various income ranges: 71.4% for AGIs $50k-75k, 343.8% for AGIs $100k-200k)
Taxes paid: $5,850 (reported on 3.8% of returns)
72132:
$5,850
State:
$7,196
(% of AGI for various income ranges: 56.2% for AGIs $50k-75k, 179.2% for AGIs $100k-200k)
Earned income credit: $2,623 (reported on 19.6% of returns)
Here:
$2,623
State:
$2,546
(% of AGI for various income ranges: 131.1% for AGIs below $25k, 90.0% for AGIs $25k-50k)
Percentage of individuals using paid preparers for their 2020 taxes: 92.4%
Here:
92%
State:
94%
(% for various income ranges: 92.0% for AGIs below $25k, 90.2% for AGIs $25k-50k, 92.6% for AGIs $50k-75k, 100.0% for AGIs $75k-100k, 91.3% for AGIs $100k-200k)
Averages for the 2012 tax year for zip code 72132, filed in 2013:
Average Adjusted Gross Income (AGI) in 2012: $48,185 (Individual Income Tax Returns)
Here:
$48,185
State:
$52,148
Salary/wage: $45,106 (reported on 89.4% of returns)
Here:
$45,106
State:
$41,669
(% of AGI for various income ranges: 80.5% for AGIs below $25k, 83.3% for AGIs $25k-50k, 81.8% for AGIs $50k-75k, 89.3% for AGIs $75k-100k, 82.6% for AGIs $100k-200k)
Taxable interest for individuals: $627 (reported on 23.2% of returns)
This zip code:
$627
Arkansas:
$1,648
(% of AGI for various income ranges: 1.0% for AGIs below $25k, 0.3% for AGIs $25k-50k, 0.3% for AGIs $50k-75k, 0.2% for AGIs $100k-200k)
Ordinary dividends: $691 (reported on 7.7% of returns)
Here:
$691
State:
$20,675
(% of AGI for various income ranges: 0.1% for AGIs $25k-50k, 0.2% for AGIs $50k-75k, 0.2% for AGIs $100k-200k)
Net capital gain/loss in AGI: +$5,989 (reported on 6.3% of returns)
Here:
+$5,989
State:
+$15,222
(% of AGI for various income ranges: 2.9% for AGIs $100k-200k)
Profit/loss from business: +$5,359 (reported on 12.0% of returns)
Here:
+$5,359
State:
+$9,665
(% of AGI for various income ranges: 2.0% for AGIs below $25k, 1.5% for AGIs $25k-50k, 2.4% for AGIs $50k-75k, 1.4% for AGIs $75k-100k)
Taxable individual retirement arrangement distribution: $12,275 (reported on 5.6% of returns)
72132:
$12,275
Arkansas:
$13,644
(% of AGI for various income ranges: 1.7% for AGIs below $25k, 1.6% for AGIs $25k-50k, 1.6% for AGIs $50k-75k, 2.8% for AGIs $75k-100k)
Total itemized deductions: $17,503 (21% of AGI, reported on 25.4% of returns)
Here:
$17,503
State:
$23,276
Here:
20.5% of AGI
State:
19.1% of AGI
(% of AGI for various income ranges: 6.0% for AGIs below $25k, 5.8% for AGIs $25k-50k, 8.7% for AGIs $50k-75k, 11.1% for AGIs $75k-100k, 11.8% for AGIs $100k-200k)
Charity contributions: $4,232 (reported on 19.7% of returns)
Here:
$4,232
State:
$5,996
(% of AGI for various income ranges: 1.5% for AGIs $25k-50k, 1.4% for AGIs $50k-75k, 2.4% for AGIs $75k-100k, 2.2% for AGIs $100k-200k)
Taxes paid: $5,428 (reported on 25.4% of returns)
72132:
$5,428
State:
$7,941
(% of AGI for various income ranges: 0.4% for AGIs below $25k, 1.0% for AGIs $25k-50k, 2.4% for AGIs $50k-75k, 3.2% for AGIs $75k-100k, 5.2% for AGIs $100k-200k)
Earned income credit: $2,259 (reported on 20.4% of returns)
Here:
$2,259
State:
$2,455
(% of AGI for various income ranges: 7.1% for AGIs below $25k, 1.2% for AGIs $25k-50k)
Percentage of individuals using paid preparers for their 2012 taxes: 55.6%
Here:
56%
State:
61%
(% for various income ranges: 56.0% for AGIs below $25k, 54.1% for AGIs $25k-50k, 56.0% for AGIs $50k-75k, 50.0% for AGIs $75k-100k, 64.3% for AGIs $100k-200k)
Averages for the 2004 tax year for zip code 72132, filed in 2005:
Average Adjusted Gross Income (AGI) in 2004: $40,955 (Individual Income Tax Returns)
Here:
$40,955
State:
$39,270
Salary/wage: $39,347 (reported on 93.0% of returns)
Here:
$39,347
State:
$34,079
(% of AGI for various income ranges: 109.9% for AGIs below $10k, 86.5% for AGIs $10k-25k, 87.5% for AGIs $25k-50k, 92.2% for AGIs $50k-75k, 88.7% for AGIs $75k-100k, 87.8% for AGIs over 100k)
Taxable interest for individuals: $497 (reported on 34.4% of returns)
This zip code:
$497
Arkansas:
$1,904
(% of AGI for various income ranges: 0.8% for AGIs below $10k, 0.5% for AGIs $10k-25k, 0.5% for AGIs $25k-50k, 0.4% for AGIs $50k-75k, 0.4% for AGIs $75k-100k, 0.2% for AGIs over 100k)
Taxable dividends: $381 (reported on 9.6% of returns)
Here:
$381
State:
$5,995
(% of AGI for various income ranges: 0.3% for AGIs below $10k, 0.1% for AGIs $25k-50k, 0.1% for AGIs $50k-75k, 0.1% for AGIs $75k-100k, 0.2% for AGIs over 100k)
Net capital gain/loss: +$500 (reported on 7.5% of returns)
Here:
+$500
State:
+$10,430
(% of AGI for various income ranges: 0.6% for AGIs below $10k, 0.1% for AGIs $25k-50k, 0.2% for AGIs $50k-75k, 0.3% for AGIs $75k-100k, -0.2% for AGIs over 100k)
Profit/loss from business: +$4,567 (reported on 15.5% of returns)
Here:
+$4,567
State:
+$7,823
(% of AGI for various income ranges: 6.5% for AGIs below $10k, 2.5% for AGIs $10k-25k, 2.6% for AGIs $25k-50k, 1.5% for AGIs $50k-75k, 1.5% for AGIs $75k-100k, 0.1% for AGIs over 100k)
Total itemized deductions: $14,658 (20% of AGI, reported on 25.7% of returns)
Here:
$14,658
State:
$18,389
Here:
20.3% of AGI
State:
21.0% of AGI
(% of AGI for various income ranges: 3.7% for AGIs $10k-25k, 7.2% for AGIs $25k-50k, 9.5% for AGIs $50k-75k, 11.5% for AGIs $75k-100k, 13.3% for AGIs over 100k)
Charity contributions deductions: $3,486 (5% of AGI, reported on 21.7% of returns)
Here:
$3,486
State:
$4,725
Here:
4.8% of AGI
State:
5.1% of AGI
(% of AGI for various income ranges: 0.7% for AGIs $10k-25k, 1.4% for AGIs $25k-50k, 1.8% for AGIs $50k-75k, 2.0% for AGIs $75k-100k, 3.3% for AGIs over 100k)
Total tax: $4,647 (reported on 77.9% of returns)
72132:
$4,647
State:
$6,047
(% of AGI for various income ranges: 2.7% for AGIs below $10k, 4.0% for AGIs $10k-25k, 6.3% for AGIs $25k-50k, 8.4% for AGIs $50k-75k, 10.7% for AGIs $75k-100k, 14.8% for AGIs over 100k)
Earned income credit: $1,668 (reported on 16.2% of returns)
Here:
$1,668
State:
$1,909
Percentage of individuals using paid preparers for their 2004 taxes: 56.0%
Here:
56%
State:
67%
(% for various income ranges: 48.1% for AGIs below $10k, 57.4% for AGIs $10k-25k, 58.0% for AGIs $25k-50k, 57.2% for AGIs $50k-75k, 59.8% for AGIs $75k-100k, 53.0% for AGIs over 100k)
Household received Food Stamps/SNAP in the past 12 months: 121 Household did not receive Food Stamps/SNAP in the past 12 months: 1,226
Women who had a birth in the past 12 months: 72 (7 now married, 62 unmarried) Women who did not have a birth in the past 12 months: 593 (416 now married, 179 unmarried)
Housing units in zip code 72132 with a mortgage: 594 (10 second mortgage, 9 both second mortgage and home equity loan) Houses without a mortgage: 22
Median monthly owner costs for units with a mortgage: $1,154 Median monthly owner costs for units without a mortgage: $367
Residents with income below the poverty level in 2022:
This zip code:
11.6%
Whole state:
16.8%
Residents with income below 50% of the poverty level in 2022:
This zip code:
8.9%
Whole state:
8.5%
Median number of rooms in houses and condos:
Here:
6.1
State:
6.1
Median number of rooms in apartments:
Here:
5.1
State:
4.3
Notable locations in this zip code not listed on our city pages
Notable locations in zip code 72132: Redfield Police Department (A), White Bluff Power Plant (B), Redfield Volunteer Fire Department Station 1 (C), Redfield Volunteer Fire Department Station 2 (D). Display/hide their locations on the map
Churches in zip code 72132 include: Orion Church (A), Redfield First Southern Baptist Church (B), River Road Church (C). Display/hide their locations on the map
Reservoirs and swamps: Hardin Lake (A), Hardin Lake Number Two (B), Clear Water Holding Pond (C), Clean Water Holding Pond (D), Surge Pond (E), Pool Five (F), Grassy Lake (G), Shingle Mill Lake (H). Display/hide their locations on the map
Streams, rivers, and creeks: Love Creek (A), Lou Creek (B), Lipscomb Branch (C), Ledbetter Creek (D), Jerning Branch (E), Harris Bayou (F), Harrington Spring Branch (G), Weaver Creek (H), Watson Branch (I). Display/hide their locations on the map
Size of family households: 365 2-persons, 223 3-persons, 191 4-persons, 73 5-persons, 34 6-persons
Size of nonfamily households: 443 1-person, 7 2-persons, 4 5-persons
703 married couples with children.
116 single-parent households (43 men, 73 women).
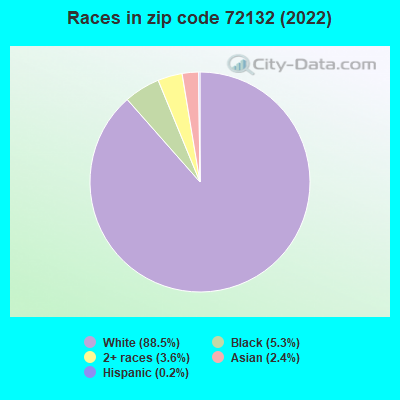
96.4% of residents of 72132 zip code speak English at home.
0.4% of residents speak Spanish at home (85% very well, 15% well).
4.0% of residents speak other Indo-European language at home (13% very well, 87% not well).
0.1% of residents speak Asian or Pacific Island language at home (100% well).
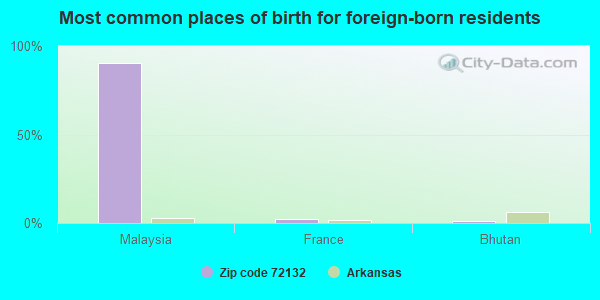
Foreign born population: 85 (2.4%) (92.9% of them are naturalized citizens)
This zip code:
2.4%
Whole state:
5.1%
90%Malaysia
2%France
1%Bhutan
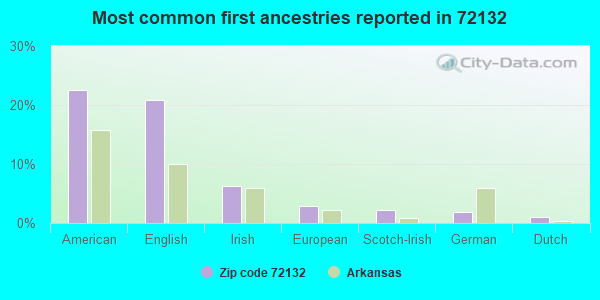
22%American
21%English
6%Irish
3%European
2%Scotch-Irish
2%German
1%Dutch
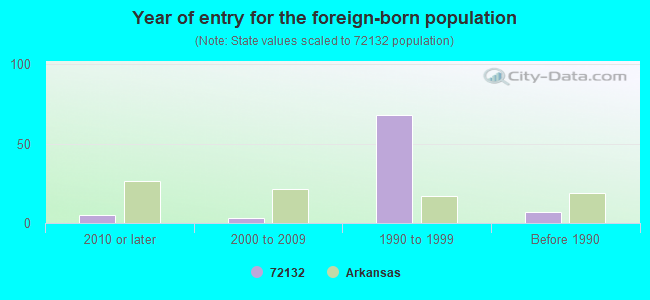
Year of entry for the foreign-born population
52010 or later
32000 to 2009
681990 to 1999
7Before 1990
Facilities with environmental interests located in this zip code:
ENTERGY/WHITE BLUFF LANDFILL (1100 WHITE BLUFF ROAD in REDFIELD, AR)
AIR MAJOR (AIRS/AFS) AIR PROGRAM (Clean Air Markets Division Business System) COMPLIANCE ACTIVITY (Tracking inspections of insecticide, fungicide, and rodenticide, and toxic substances) CRITERIA AND HAZARDOUS AIR POLLUTANT INVENTORY (Inventory of air pollution sources) National Pollutant Discharge Elimination System MAJOR (Tracking pollutant discharge elimination systems) - permit STATE MASTER (PDS) - AIR-0263-A, AIR PROGRAM, AIR-0263-AOP-R0, AIR MAJOR, AIR-0263-AOP-R1, AIR-0263-AOP-R2, SOLID WASTE-0199-S3N-R3, REFUSE DISPOSAL, SOLID WASTE-0199-SR-1, SOLID WASTE-0199-SR-2, WATER-2278-W, NPDES STORMWATER PERMIT, WATER-AR0036331, NPDES MAJOR, WATER-AR0036331C, National Pollutant Discharge Elimination System Permit, WATER-ARR00A690, NPDES STORMWATER PERMIT, WATER-ARR10C168, AIR-0263-AOP-R3, AIR MAJOR, AIR-0263-AOP-R4, AIR-0263-AR-1, AIR PROGRAM, RST-35000026, UNDERGROUND STORAGE TANK PROGRAM, SOLID WASTE-0199-S, REFUSE DISPOSAL STATE MASTER (PDS) - WATER-ARR10C294, NPDES STORMWATER PERMIT STATE MASTER (PDS) - WATER-ARR10C738, NPDES STORMWATER PERMIT STATE MASTER (PDS) - WATER-ARR150451, NPDES STORMWATER PERMIT HAZARDOUS WASTE BIENNIAL REPORTER (Resource Conservation and Recovery Act (tracking hazardous waste)) Large Quantity Generators, more that 1000 kg of hazardous waste/month (Resource Conservation and Recovery Act (tracking hazardous waste)) TSD (Resource Conservation and Recovery Act (tracking hazardous waste)) TRI REPORTER (Tracking of toxic chemicals releasing facilities) Business SIC classification: ELECTRIC SERVICES Business NAICS classification: FOSSIL FUEL ELECTRIC POWER GENERATION. Organizations: ENTERGY ARKANSAS - RICK MCCABE (CONTACT/GENERAL)
, ARK PWR & LIGHT, WHITE BLUFF (CONTACT/OPERATOR)
, ENTERGY CORP (CONTACT/OPERATOR)
, ENTERGY CORPORATION (CONTACT/OWNER)
, ARKANSAS ELECTRIC COOPERATIVE CORPORATION (CONTACT/OWNER)
, ENTERGY ARKANSAS, INC. (CONTACT/OWNER)
, CITY WATER & LIGHT OF JONESBORO (CONTACT/OWNER)
, CONWAY CORPORATION (CONTACT/OWNER)
, WEST MEMPHIS UTILITIES (CONTACT/OWNER)
, ARK ELECTRIC COOPERATIVE (CONTACT/OWNER)
, CITY OF JONESBORO (CONTACT/OWNER)
, CITY OF W MEMPHIS (CONTACT/OWNER)
, CONWAY CORPORATION (CONTACT/OWNER)
, ARKANSAS ELECTRIC COOPERATIVE CORPORATION (OWNER/OPERATOR)
, ENTERGY ARKANSAS, INC. (OWNER/OPERATOR)
, CITY WATER & LIGHT OF JONESBORO (OWNER/OPERATOR)
, CONWAY CORPORATION (OWNER/OPERATOR)
, WEST MEMPHIS UTILITIES (OWNER/OPERATOR)
Alternative names: ENTERGY INC, ENTERGY AR, INC-WHITE BLUFF PL, ENTERGY ARKANSAS-WHITE BLUFF, ENTERGY ARK-WHITE BLUFF, ENTERGY SERVICES, INC., ENTERGY WHITE BLUFF GENERATING PLANT, ENTERGY WHITE BLUFF PLANT, ENTERRY WHITE BLUFF GENERATING PLANT, LANDFILL CELL #1, WHITE BLUFF DP TRACK EXTENSION, WHITE BLUFF RD CONSTRUCTION
HARDIN ELEMENTARY SCHOOL (700 SCHOOLWOOD DRIVE in REDFIELD, AR)
(Geographic Names Information System) (National Center for Education Statistics) - STATE ID-3510078 Organizations: WHITE HALL (SCHOOL DISTRICT)
CHARLES RIVER REDFIELD LABORATORIES (100 EAST BOONE STREET in REDFIELD, AR)
HAZARDOUS WASTE BIENNIAL REPORTER (Resource Conservation and Recovery Act (tracking hazardous waste)) Small Quantity Generators, between 100 kg and 1000 kg of hazardous waste/month (Resource Conservation and Recovery Act (tracking hazardous waste)) - notification Business NAICS classification: MEDICAL LABORATORIES. Organizations: CHARLES RIVER LABORATORIES INC (CONTACT/OPERATOR)
, GENZYME TRANSGENICS CORP (CONTACT/OWNER)
Alternative names: TSI REDFIELD LABORATORIES
INTL PAPER PROPERTY (8520 GRANT CO RD 58 in REDFIELD, AR)
(Resource Conservation and Recovery Act (tracking hazardous waste))
Housing units lacking complete plumbing facilities: 3.2% Housing units lacking complete kitchen facilities: 3.3%
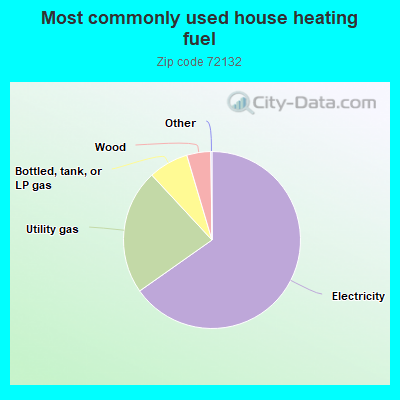
65.3%Electricity
22.9%Utility gas
7.3%Bottled, tank, or LP gas
4.4%Wood
Population in 1990: 1,888. Population change in the 1990s: +1,087 (+57.6%).
Place of birth for U.S.-born residents:
This state: 2,797
Northeast: 54
Midwest: 175
South: 292
West: 98
56% of the 72132 zip code residents lived in the same house 5 years ago. Out of people who lived in different houses, 47% lived in this county. Out of people who lived in different counties, 50% lived in Arkansas.
90% of the 72132 zip code residents lived in the same house 1 year ago. Out of people who lived in different houses, 63% moved from this county. Out of people who lived in different houses, 27% moved from different county within same state. Out of people who lived in different houses, 2% moved from different state.
Private vs. public school enrollment:
Students in private schools in grades 1 to 8 (elementary and middle school): 44
Here:
10.7%
Arkansas:
10.5%
Students in private schools in grades 9 to 12 (high school): 3
Here:
2.7%
Arkansas:
8.7%
Students in private undergraduate colleges: 48
Here:
60.4%
Arkansas:
19.4%
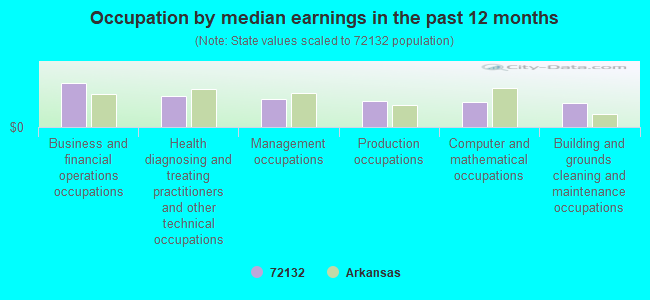
Occupation by median earnings in the past 12 months ($)
102,809Business and financial operations occupations
72,608Health diagnosing and treating practitioners and other technical occupations
64,768Management occupations
61,249Production occupations
58,937Computer and mathematical occupations
56,674Building and grounds cleaning and maintenance occupations
Companies with federal contracts located in this zip code (REDFIELD, AR):
SUPERIOR TOOL, INC (410 HWY 365 SOUTH; small business) : $556,966 in 19 contractsfrom 2002 to 2006
Contracts for Bending and Forming Machines, Miscellaneous Vehicular Components, Vehicular Cab, Body, and Frame Structural Components, Industrial Assembly Machines, and moreby Army Signed by year:2000: $0; 2001: $0; 2002: $9,800; 2003: $152,341; 2004: $124,144; 2005: $202,560; 2006: $68,121.
Biggest contracts:
$97,540 with Army for Bending and Forming Machines. Signed on 2005-09-30. Completion date: 2006-01-26.
$50,925 with Army for Miscellaneous Vehicular Components. Signed on 2004-08-05. Completion date: 2004-10-30.
$48,300 with Army for Vehicular Cab, Body, and Frame Structural Components. Signed on 2003-07-25. Completion date: 2003-09-19.
$46,400 with Army for Industrial Assembly Machines. Signed on 2005-05-02. Completion date: 2005-06-10.
DOBBINS, TODD (1804 RIVER RD; small business) : $211,450 in 11 contractsfrom 2004 to 2006
Contracts for Landscaping/Groundskeeping Services by Army, U.S. Army Corps of Engineers - civil program financing only Signed by year:2000: $0; 2001: $0; 2002: $0; 2003: $0; 2004: $110,650; 2005: $52,265; 2006: $48,535.
Biggest contracts:
$48,535 with Army for Landscaping/Groundskeeping Services. Signed on 2005-04-11. Completion date: 2005-09-30.
$44,805, same as above.Signed on 2004-05-04. Completion date: 2004-09-30.
$44,805 with U.S. Army Corps of Engineers - civil program financing only for Landscaping/Groundskeeping Services. Signed on 2004-05-04. Completion date: 2004-09-30.
$39,600 with Army for Landscaping/Groundskeeping Services. Signed on 2006-03-27. Completion date: 2006-09-30.
SYBLE WALTERS (1110 QUAPAWDR; small business) : $151,730 in 11 contractsfrom 2000 to 2003
Contracts for Landscaping/Groundskeeping Services, Trash/Garbage Collection Services - Including Portable Sanitation Services by U.S. Army Corps of Engineers - civil program financing only Signed by year:2000: $45,370; 2001: $0; 2002: $42,040; 2003: $64,320; 2004: $0; 2005: $0; 2006: $0.
Biggest contracts:
$46,140 with U.S. Army Corps of Engineers - civil program financing only for Landscaping/Groundskeeping Services. Signed on 2003-04-30. Completion date: 2003-10-31.
$45,370 with U.S. Army Corps of Engineers - civil program financing only for Trash/Garbage Collection Services - Including Portable Sanitation Services. Signed on 2000-03-01. Completion date: 2001-03-31.
$35,820 with U.S. Army Corps of Engineers - civil program financing only for Landscaping/Groundskeeping Services. Signed on 2002-04-26. Completion date: 2003-05-31.
$18,180, same as above.Signed on 2003-04-07. Completion date: 2003-05-31.
JRC CONSTRUCTION INC (1008 QUAPAW DR; small business) : $80,247 in 3 contractsfrom 2005 to 2006
$71,356 with Army for Maintenance, Repair or Alteration of Real Property -- Other Administrative Facilities and Service Buildings. Signed on 2005-11-22. Completion date: 2006-03-22.
$8,891, same as above.Signed on 2006-03-08. Completion date: 2006-06-07.
$0, same as above.Signed on 2006-05-04. Completion date: 2006-06-07.
MURDOCK CONSTRUCTION CO (511 LAKE ST; small business) : $35,960 in 2 contractsin 2002
$21,985 with U.S. Army Corps of Engineers - civil program financing only for Maintenance, Repair and Rebuilding of Equipment -- Recreational and Athletic Equipment. Signed on 2002-08-02. Completion date: 2002-10-01.
$13,975 with U.S. Army Corps of Engineers - civil program financing only for Other Non-Building Structures. Signed on 2002-08-02. Completion date: 2002-06-28.
P C CO (2701 N C T R RD; small business)
$21,499 with U.S. Army Corps of Engineers - civil program financing only for Construction of Structures and Facilities -- Office Buildings. Signed on 2002-03-26. Completion date: 2002-04-20.
ROCKS CONSTRUCTION INC (2021 RIVER ROAD; small business)
$4,000 with U.S. Army Corps of Engineers - civil program financing only for Construction of Structures and Facilities -- Office Buildings. Signed on 2003-03-12. Completion date: 2003-04-09.
CITY OF REDFIELD POLICE DEPART (509 SHERIDAN ROAD) : $1,020 in 3 contractsin 2002
$930 with U.S. Army Corps of Engineers - civil program financing only for Other Professional Services. Signed on 2002-12-03. Completion date: 2004-02-29.
$90, same as above.Signed on 2002-10-10. Completion date: 2002-10-04.
$0, same as above.Signed on 2002-12-03. Completion date: 2004-02-29.
Top industries in this zip code by the number of employees in 2005:
Utilities: Fossil Fuel Electric Power Generation (100-249 employees: 1 establishment)
Wholesale Trade: Drugs and Druggists' Sundries Merchant Wholesalers (50-99: 1)
Construction: Water and Sewer Line and Related Structures Construction (20-49: 1)
Utilities: Electric Power Distribution (10-19: 1)
Other Services (except Public Administration): Religious Organizations (5-9: 1, 1-4: 4)
Accommodation and Food Services: Limited-Service Restaurants (5-9: 1, 1-4: 2)
Construction: Site Preparation Contractors (5-9: 1, 1-4: 1)
Construction: Commercial and Institutional Building Construction (5-9: 1, 1-4: 1)
Fatal accident statistics in 2014:
Fatal accident count: 1
Vehicles involved in fatal accidents: 1
Fatal accidents caused by drunken drivers: 0
Fatalities: 1
Persons involved in fatal accidents: 3
Pedestrians involved in fatal accidents: 0
Fatal accident statistics in 2011:
Fatal accident count: 1
Vehicles involved in fatal accidents: 1
Fatal accidents caused by drunken drivers: 1
Fatalities: 2
Persons involved in fatal accidents: 2
Pedestrians involved in fatal accidents: 0
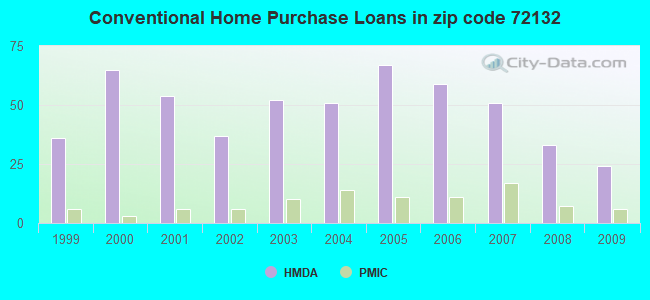
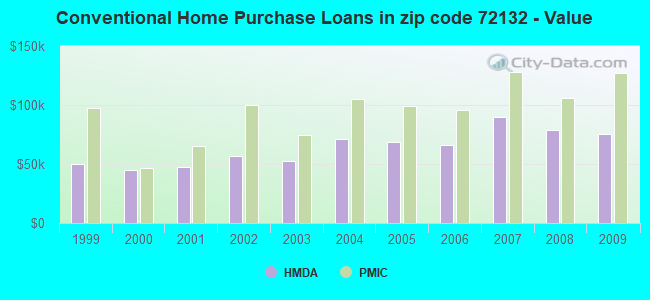
Home Mortgage Disclosure Act Aggregated Statistics For Year 2009 (Based on 4 partial tracts)
A) FHA, FSA/RHS & VA Home Purchase Loans
B) Conventional Home Purchase Loans
C) Refinancings
D) Home Improvement Loans
E) Loans on Dwellings For 5+ Families
F) Non-occupant Loans on < 5 Family Dwellings (A B C & D)
G) Loans On Manufactured Home Dwelling (A B C & D)
Number
Average Value
Number
Average Value
Number
Average Value
Number
Average Value
Number
Average Value
Number
Average Value
Number
Average Value
LOANS ORIGINATED
23
$114,955
24
$75,214
67
$101,461
11
$21,103
0
$0
7
$35,991
19
$55,161
APPLICATIONS APPROVED, NOT ACCEPTED
0
$0
8
$44,054
8
$127,386
1
$9,910
0
$0
1
$9,910
7
$49,539
APPLICATIONS DENIED
7
$95,439
14
$82,902
30
$106,916
10
$5,803
0
$0
4
$31,140
17
$71,769
APPLICATIONS WITHDRAWN
0
$0
0
$0
16
$117,171
0
$0
1
$127,390
0
$0
0
$0
FILES CLOSED FOR INCOMPLETENESS
0
$0
0
$0
1
$198,160
1
$56,620
0
$0
1
$56,620
0
$0
Aggregated Statistics For Year 2008 (Based on 4 partial tracts)
A) FHA, FSA/RHS & VA Home Purchase Loans
B) Conventional Home Purchase Loans
C) Refinancings
D) Home Improvement Loans
F) Non-occupant Loans on < 5 Family Dwellings (A B C & D)
G) Loans On Manufactured Home Dwelling (A B C & D)
Number
Average Value
Number
Average Value
Number
Average Value
Number
Average Value
Number
Average Value
Number
Average Value
LOANS ORIGINATED
40
$96,141
33
$78,748
37
$88,902
13
$33,432
7
$61,873
28
$62,783
APPLICATIONS APPROVED, NOT ACCEPTED
3
$38,687
8
$75,192
3
$131,160
4
$55,200
1
$79,260
10
$63,410
APPLICATIONS DENIED
3
$79,733
30
$86,430
23
$103,115
10
$26,043
1
$75,020
17
$58,857
APPLICATIONS WITHDRAWN
3
$120,780
4
$55,200
10
$73,817
0
$0
0
$0
1
$165,600
FILES CLOSED FOR INCOMPLETENESS
6
$94,360
1
$390,650
3
$49,540
0
$0
0
$0
0
$0
Aggregated Statistics For Year 2007 (Based on 4 partial tracts)
A) FHA, FSA/RHS & VA Home Purchase Loans
B) Conventional Home Purchase Loans
C) Refinancings
D) Home Improvement Loans
F) Non-occupant Loans on < 5 Family Dwellings (A B C & D)
G) Loans On Manufactured Home Dwelling (A B C & D)
Number
Average Value
Number
Average Value
Number
Average Value
Number
Average Value
Number
Average Value
Number
Average Value
LOANS ORIGINATED
33
$84,581
51
$89,503
47
$86,035
8
$21,408
6
$61,805
27
$67,725
APPLICATIONS APPROVED, NOT ACCEPTED
1
$77,850
16
$67,851
8
$102,616
1
$35,380
0
$0
14
$62,783
APPLICATIONS DENIED
8
$89,524
25
$63,410
30
$84,263
20
$23,496
6
$30,903
21
$50,482
APPLICATIONS WITHDRAWN
0
$0
3
$85,397
13
$104,304
0
$0
0
$0
3
$53,313
FILES CLOSED FOR INCOMPLETENESS
0
$0
7
$110,199
4
$107,218
0
$0
1
$83,510
0
$0
Aggregated Statistics For Year 2006 (Based on 4 partial tracts)
A) FHA, FSA/RHS & VA Home Purchase Loans
B) Conventional Home Purchase Loans
C) Refinancings
D) Home Improvement Loans
F) Non-occupant Loans on < 5 Family Dwellings (A B C & D)
G) Loans On Manufactured Home Dwelling (A B C & D)
Number
Average Value
Number
Average Value
Number
Average Value
Number
Average Value
Number
Average Value
Number
Average Value
LOANS ORIGINATED
18
$86,654
59
$66,092
42
$60,491
11
$34,355
3
$18,400
38
$43,244
APPLICATIONS APPROVED, NOT ACCEPTED
3
$45,293
28
$59,093
6
$67,232
0
$0
0
$0
31
$57,803
APPLICATIONS DENIED
11
$45,936
31
$46,595
25
$66,864
4
$99,078
1
$86,340
36
$40,596
APPLICATIONS WITHDRAWN
3
$130,217
6
$55,672
13
$125,682
1
$92,000
1
$140,120
3
$45,763
FILES CLOSED FOR INCOMPLETENESS
0
$0
4
$99,785
4
$60,508
0
$0
3
$52,370
0
$0
Aggregated Statistics For Year 2005 (Based on 4 partial tracts)
A) FHA, FSA/RHS & VA Home Purchase Loans
B) Conventional Home Purchase Loans
C) Refinancings
D) Home Improvement Loans
F) Non-occupant Loans on < 5 Family Dwellings (A B C & D)
G) Loans On Manufactured Home Dwelling (A B C & D)
Number
Average Value
Number
Average Value
Number
Average Value
Number
Average Value
Number
Average Value
Number
Average Value
LOANS ORIGINATED
13
$86,013
67
$68,700
52
$72,738
10
$31,139
16
$45,558
29
$49,497
APPLICATIONS APPROVED, NOT ACCEPTED
0
$0
20
$51,166
11
$89,942
1
$15,570
1
$118,890
21
$54,324
APPLICATIONS DENIED
1
$43,880
54
$54,100
46
$86,069
7
$10,919
6
$38,215
59
$51,914
APPLICATIONS WITHDRAWN
1
$150,030
3
$120,310
27
$73,496
3
$158,053
1
$261,850
4
$74,662
FILES CLOSED FOR INCOMPLETENESS
0
$0
4
$36,448
3
$50,953
1
$104,740
1
$73,600
0
$0
Aggregated Statistics For Year 2004 (Based on 4 partial tracts)
A) FHA, FSA/RHS & VA Home Purchase Loans
B) Conventional Home Purchase Loans
C) Refinancings
D) Home Improvement Loans
F) Non-occupant Loans on < 5 Family Dwellings (A B C & D)
G) Loans On Manufactured Home Dwelling (A B C & D)
Number
Average Value
Number
Average Value
Number
Average Value
Number
Average Value
Number
Average Value
Number
Average Value
LOANS ORIGINATED
23
$82,955
51
$71,184
58
$76,255
14
$34,071
3
$70,770
31
$51,453
APPLICATIONS APPROVED, NOT ACCEPTED
0
$0
17
$68,688
23
$70,032
1
$28,310
0
$0
16
$43,789
APPLICATIONS DENIED
3
$59,920
41
$57,125
44
$56,044
13
$33,643
3
$16,513
44
$37,862
APPLICATIONS WITHDRAWN
1
$227,880
7
$69,961
29
$73,822
0
$0
0
$0
3
$69,353
FILES CLOSED FOR INCOMPLETENESS
0
$0
3
$83,510
8
$78,909
0
$0
0
$0
1
$90,590
Aggregated Statistics For Year 2003 (Based on 4 partial tracts)
A) FHA, FSA/RHS & VA Home Purchase Loans
B) Conventional Home Purchase Loans
C) Refinancings
D) Home Improvement Loans
F) Non-occupant Loans on < 5 Family Dwellings (A B C & D)
Number
Average Value
Number
Average Value
Number
Average Value
Number
Average Value
Number
Average Value
LOANS ORIGINATED
20
$78,554
52
$52,724
89
$74,476
6
$21,938
6
$40,338
APPLICATIONS APPROVED, NOT ACCEPTED
7
$33,566
24
$63,221
16
$70,639
1
$7,080
0
$0
APPLICATIONS DENIED
11
$39,888
80
$38,957
41
$56,754
8
$17,542
1
$39,630
APPLICATIONS WITHDRAWN
3
$70,297
3
$82,563
27
$62,592
0
$0
0
$0
FILES CLOSED FOR INCOMPLETENESS
1
$59,450
0
$0
11
$71,156
0
$0
0
$0
Aggregated Statistics For Year 2002 (Based on 2 partial tracts)
A) FHA, FSA/RHS & VA Home Purchase Loans
B) Conventional Home Purchase Loans
C) Refinancings
D) Home Improvement Loans
F) Non-occupant Loans on < 5 Family Dwellings (A B C & D)
Number
Average Value
Number
Average Value
Number
Average Value
Number
Average Value
Number
Average Value
LOANS ORIGINATED
27
$80,206
37
$57,190
58
$84,582
6
$28,072
4
$38,922
APPLICATIONS APPROVED, NOT ACCEPTED
3
$69,353
33
$51,040
27
$49,959
4
$16,985
3
$28,780
APPLICATIONS DENIED
6
$33,733
54
$43,275
41
$49,401
3
$8,493
6
$43,170
APPLICATIONS WITHDRAWN
0
$0
3
$26,420
21
$53,179
0
$0
3
$50,953
FILES CLOSED FOR INCOMPLETENESS
0
$0
0
$0
10
$60,296
0
$0
0
$0
Aggregated Statistics For Year 2001 (Based on 2 partial tracts)
A) FHA, FSA/RHS & VA Home Purchase Loans
B) Conventional Home Purchase Loans
C) Refinancings
D) Home Improvement Loans
F) Non-occupant Loans on < 5 Family Dwellings (A B C & D)
Number
Average Value
Number
Average Value
Number
Average Value
Number
Average Value
Number
Average Value
LOANS ORIGINATED
13
$76,105
54
$47,154
48
$66,229
6
$34,205
1
$62,280
APPLICATIONS APPROVED, NOT ACCEPTED
0
$0
31
$43,512
8
$54,492
1
$11,320
1
$52,370
APPLICATIONS DENIED
1
$125,970
57
$39,184
64
$47,438
7
$9,503
3
$30,197
APPLICATIONS WITHDRAWN
0
$0
8
$37,508
23
$49,170
1
$5,660
0
$0
FILES CLOSED FOR INCOMPLETENESS
0
$0
1
$58,030
4
$70,062
0
$0
1
$58,030
Aggregated Statistics For Year 2000 (Based on 2 partial tracts)
A) FHA, FSA/RHS & VA Home Purchase Loans
B) Conventional Home Purchase Loans
C) Refinancings
D) Home Improvement Loans
F) Non-occupant Loans on < 5 Family Dwellings (A B C & D)
Number
Average Value
Number
Average Value
Number
Average Value
Number
Average Value
Number
Average Value
LOANS ORIGINATED
33
$69,226
65
$44,857
37
$51,911
8
$15,392
8
$35,385
APPLICATIONS APPROVED, NOT ACCEPTED
3
$49,067
33
$42,934
16
$61,658
4
$7,430
4
$46,000
APPLICATIONS DENIED
7
$57,424
76
$40,153
35
$52,006
7
$14,760
1
$21,230
APPLICATIONS WITHDRAWN
1
$168,430
3
$46,707
30
$41,660
3
$14,627
1
$96,250
FILES CLOSED FOR INCOMPLETENESS
1
$63,690
0
$0
4
$26,185
0
$0
0
$0
Aggregated Statistics For Year 1999 (Based on 2 partial tracts)
A) FHA, FSA/RHS & VA Home Purchase Loans
B) Conventional Home Purchase Loans
C) Refinancings
D) Home Improvement Loans
F) Non-occupant Loans on < 5 Family Dwellings (A B C & D)
Detailed PMIC statistics for the following Tracts:0002.00
, 0004.00
2002 - 2018 National Fire Incident Reporting System (NFIRS) incidents
Based on the data from the years 2002 - 2018 the average number of fire incidents per year is 16. The highest number of reported fire incidents - 27 took place in 2010, and the least - 6 in 2002. The data has an increasing trend.
When looking into fire subcategories, the most reports belonged to: Outside Fires (42.3%), and Structure Fires (31.9%).
Fire incident types reported to NFIRS in Zip Code 72132

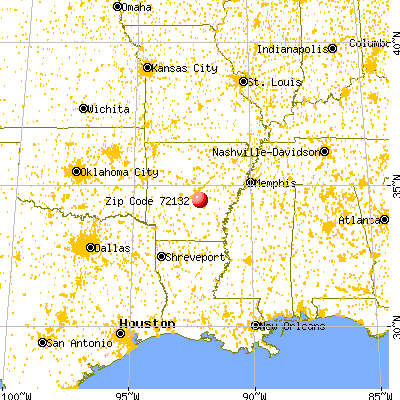


 Nearest zip codes: 72079, 72065, 72206, 71602, 72150, 72168.


 Based on the data from the years 2002 - 2018 the average number of fire incidents per year is 16. The highest number of reported fire incidents - 27 took place in 2010, and the least - 6 in 2002. The data has an increasing trend.
 When looking into fire subcategories, the most reports belonged to: Outside Fires (42.3%), and Structure Fires (31.9%).