Estimated zip code population in 2022: 8,791 Zip code population in 2010: 8,141 Zip code population in 2000: 5,364
Houses and condos: 3,445 Renter-occupied apartments: 1,011
% of renters here:
32%
State:
34%
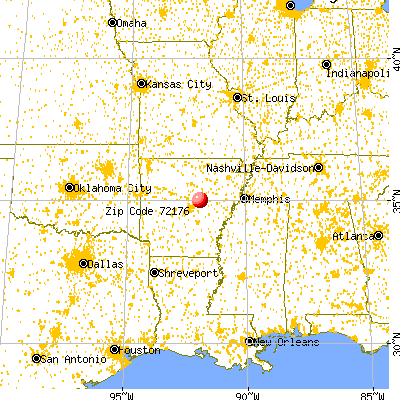
March 2022 cost of living index in zip code 72176: 79.5 (low, U.S. average is 100)
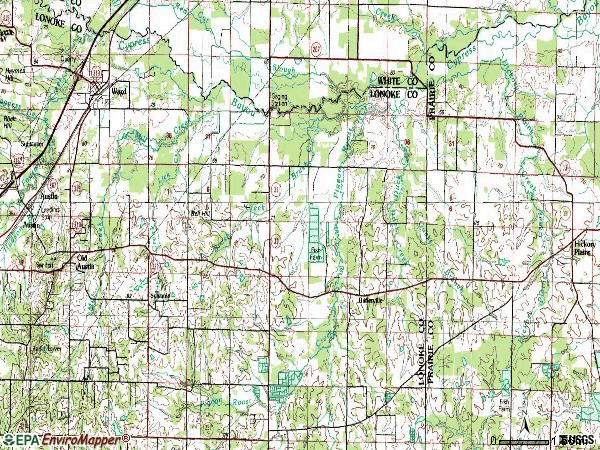
Land area: 79.3 sq. mi. Water area: 0.2 sq. mi.
Population density: 111 people per square mile
(very low).
OSM Map
General Map
Google Map
MSN Map
OSM Map
General Map
Google Map
MSN Map
OSM Map
General Map
Google Map
MSN Map
OSM Map
General Map
Google Map
MSN Map
Please wait while loading the map...
Real estate property taxes paid for housing units in 2022:
This zip code:
0.7% ($1,117)
Arkansas:
0.5% ($977)
Median real estate property taxes paid for housing units with mortgages in 2022: $1,181 (0.7%) Median real estate property taxes paid for housing units with no mortgage in 2022: $639 (0.4%)
Estimated median house/condo value in 2022: $167,068
72176:
$167,068
Arkansas:
$179,800
According to our research of Arkansas and other state lists, there were 23 registered sex offenders living in 72176 zip code as of May 28, 2024. The ratio of all residents to sex offenders in zip code 72176 is 411 to 1. The ratio of registered sex offenders to all residents in this zip code is near the state average.
Median resident age:
This zip code:
32.9 years
Arkansas median age:
38.9 years
Average household size:
This zip code:
2.8 people
Arkansas:
2.4 people
Averages for the 2020 tax year for zip code 72176, filed in 2021:
Average Adjusted Gross Income (AGI) in 2020: $52,097 (Individual Income Tax Returns)
Here:
$52,097
State:
$64,872
Salary/wage: $48,807 (reported on 87.1% of returns)
Here:
$48,807
State:
$50,644
(% of AGI for various income ranges: 1226.1% for AGIs below $25k, 3630.3% for AGIs $25k-50k, 6773.6% for AGIs $50k-75k, 10091.4% for AGIs $75k-100k, 17172.0% for AGIs $100k-200k, 47950.0% for AGIs over 200k)
Taxable interest for individuals: $432 (reported on 17.7% of returns)
This zip code:
$432
Arkansas:
$1,857
(% of AGI for various income ranges: 6.2% for AGIs below $25k, 5.2% for AGIs $25k-50k, 9.1% for AGIs $50k-75k, 16.8% for AGIs $75k-100k, 22.0% for AGIs $100k-200k, 170.0% for AGIs over 200k)
Ordinary dividends: $1,534 (reported on 9.0% of returns)
Here:
$1,534
State:
$21,681
(% of AGI for various income ranges: 5.7% for AGIs below $25k, 6.4% for AGIs $25k-50k, 9.3% for AGIs $50k-75k, 32.1% for AGIs $75k-100k, 71.6% for AGIs $100k-200k, 490.0% for AGIs over 200k)
Net capital gain/loss in AGI: +$6,049 (reported on 9.5% of returns)
Here:
+$6,049
State:
+$22,815
(% of AGI for various income ranges: 6.1% for AGIs below $25k, 22.6% for AGIs $25k-50k, 47.7% for AGIs $50k-75k, 44.6% for AGIs $75k-100k, 220.4% for AGIs $100k-200k, 5095.0% for AGIs over 200k)
Profit/loss from business: +$7,662 (reported on 13.6% of returns)
Here:
+$7,662
State:
+$9,743
(% of AGI for various income ranges: 123.3% for AGIs below $25k, 117.2% for AGIs $25k-50k, 64.5% for AGIs $50k-75k, 176.8% for AGIs $75k-100k, 343.6% for AGIs $100k-200k)
Taxable individual retirement arrangement distribution: $14,482 (reported on 4.4% of returns)
72176:
$14,482
Arkansas:
$18,502
(% of AGI for various income ranges: 12.8% for AGIs below $25k, 36.0% for AGIs $25k-50k, 135.7% for AGIs $50k-75k, 492.8% for AGIs $100k-200k)
Total itemized deductions: $28,523 (reported on 3.3% of returns)
Here:
$28,523
State:
$52,840
(% of AGI for various income ranges: 175.0% for AGIs $50k-75k, 656.4% for AGIs $100k-200k, 5435.0% for AGIs over 200k)
Charity contributions: $11,000 (reported on 2.6% of returns)
Here:
$11,000
State:
$35,735
(% of AGI for various income ranges: 54.5% for AGIs $50k-75k, 220.4% for AGIs $100k-200k, 1220.0% for AGIs over 200k)
Taxes paid: $6,515 (reported on 3.3% of returns)
72176:
$6,515
State:
$7,196
(% of AGI for various income ranges: 31.6% for AGIs $50k-75k, 171.2% for AGIs $100k-200k, 1210.0% for AGIs over 200k)
Earned income credit: $2,629 (reported on 21.1% of returns)
Here:
$2,629
State:
$2,546
(% of AGI for various income ranges: 130.1% for AGIs below $25k, 88.6% for AGIs $25k-50k, 2.3% for AGIs $50k-75k)
Percentage of individuals using paid preparers for their 2020 taxes: 95.6%
Here:
96%
State:
94%
(% for various income ranges: 95.0% for AGIs below $25k, 96.4% for AGIs $25k-50k, 95.8% for AGIs $50k-75k, 97.4% for AGIs $75k-100k, 95.0% for AGIs $100k-200k, 83.3% for AGIs over 200k)
Averages for the 2012 tax year for zip code 72176, filed in 2013:
Average Adjusted Gross Income (AGI) in 2012: $42,090 (Individual Income Tax Returns)
Here:
$42,090
State:
$52,148
Salary/wage: $39,816 (reported on 88.9% of returns)
Here:
$39,816
State:
$41,669
(% of AGI for various income ranges: 81.5% for AGIs below $25k, 88.5% for AGIs $25k-50k, 86.5% for AGIs $50k-75k, 88.0% for AGIs $75k-100k, 79.5% for AGIs $100k-200k, 60.5% for AGIs over 200k)
Taxable interest for individuals: $594 (reported on 18.8% of returns)
This zip code:
$594
Arkansas:
$1,648
(% of AGI for various income ranges: 0.5% for AGIs below $25k, 0.2% for AGIs $25k-50k, 0.1% for AGIs $50k-75k, 0.2% for AGIs $75k-100k, 0.5% for AGIs $100k-200k)
Ordinary dividends: $1,350 (reported on 6.5% of returns)
Here:
$1,350
State:
$20,675
(% of AGI for various income ranges: 0.1% for AGIs below $25k, 0.1% for AGIs $25k-50k, 0.2% for AGIs $50k-75k, 0.6% for AGIs $100k-200k)
Net capital gain/loss in AGI: +$5,167 (reported on 4.4% of returns)
Here:
+$5,167
State:
+$15,222
(% of AGI for various income ranges: 0.3% for AGIs $75k-100k, 3.0% for AGIs $100k-200k)
Profit/loss from business: +$7,032 (reported on 13.8% of returns)
Here:
+$7,032
State:
+$9,665
(% of AGI for various income ranges: 8.7% for AGIs below $25k, 1.1% for AGIs $25k-50k, 1.4% for AGIs $50k-75k, 2.0% for AGIs $75k-100k, 1.8% for AGIs $100k-200k)
Taxable individual retirement arrangement distribution: $9,220 (reported on 4.4% of returns)
72176:
$9,220
Arkansas:
$13,644
(% of AGI for various income ranges: 0.9% for AGIs below $25k, 0.8% for AGIs $25k-50k, 1.3% for AGIs $50k-75k, 2.1% for AGIs $100k-200k)
Total itemized deductions: $16,801 (22% of AGI, reported on 22.3% of returns)
Here:
$16,801
State:
$23,276
Here:
21.8% of AGI
State:
19.1% of AGI
(% of AGI for various income ranges: 5.3% for AGIs below $25k, 6.3% for AGIs $25k-50k, 8.2% for AGIs $50k-75k, 11.0% for AGIs $75k-100k, 13.5% for AGIs $100k-200k, 10.4% for AGIs over 200k)
Charity contributions: $3,733 (reported on 15.8% of returns)
Here:
$3,733
State:
$5,996
(% of AGI for various income ranges: 0.6% for AGIs below $25k, 0.9% for AGIs $25k-50k, 1.2% for AGIs $50k-75k, 1.9% for AGIs $75k-100k, 2.2% for AGIs $100k-200k, 2.2% for AGIs over 200k)
Taxes paid: $5,175 (reported on 22.3% of returns)
72176:
$5,175
State:
$7,941
(% of AGI for various income ranges: 0.7% for AGIs below $25k, 1.3% for AGIs $25k-50k, 2.3% for AGIs $50k-75k, 3.3% for AGIs $75k-100k, 5.2% for AGIs $100k-200k, 6.4% for AGIs over 200k)
Earned income credit: $2,353 (reported on 27.6% of returns)
Here:
$2,353
State:
$2,455
(% of AGI for various income ranges: 9.0% for AGIs below $25k, 1.8% for AGIs $25k-50k)
Percentage of individuals using paid preparers for their 2012 taxes: 54.8%
Here:
55%
State:
61%
(% for various income ranges: 53.2% for AGIs below $25k, 51.0% for AGIs $25k-50k, 57.4% for AGIs $50k-75k, 60.0% for AGIs $75k-100k, 78.9% for AGIs $100k-200k)
Averages for the 2004 tax year for zip code 72176, filed in 2005:
Average Adjusted Gross Income (AGI) in 2004: $34,553 (Individual Income Tax Returns)
Here:
$34,553
State:
$39,270
Salary/wage: $32,881 (reported on 88.7% of returns)
Here:
$32,881
State:
$34,079
(% of AGI for various income ranges: 95.9% for AGIs below $10k, 82.5% for AGIs $10k-25k, 87.8% for AGIs $25k-50k, 86.7% for AGIs $50k-75k, 87.1% for AGIs $75k-100k, 69.3% for AGIs over 100k)
Taxable interest for individuals: $983 (reported on 25.8% of returns)
This zip code:
$983
Arkansas:
$1,904
(% of AGI for various income ranges: 2.3% for AGIs below $10k, 1.3% for AGIs $10k-25k, 0.5% for AGIs $25k-50k, 0.7% for AGIs $50k-75k, 0.4% for AGIs $75k-100k, 0.8% for AGIs over 100k)
Taxable dividends: $1,065 (reported on 8.1% of returns)
Here:
$1,065
State:
$5,995
(% of AGI for various income ranges: 0.2% for AGIs below $10k, 0.2% for AGIs $10k-25k, 0.1% for AGIs $25k-50k, 0.1% for AGIs $50k-75k, 0.1% for AGIs $75k-100k, 1.0% for AGIs over 100k)
Net capital gain/loss: +$2,781 (reported on 8.0% of returns)
Here:
+$2,781
State:
+$10,430
(% of AGI for various income ranges: -0.5% for AGIs below $10k, 0.5% for AGIs $10k-25k, 0.6% for AGIs $25k-50k, 0.1% for AGIs $50k-75k, 0.7% for AGIs $75k-100k, 2.2% for AGIs over 100k)
Profit/loss from business: +$7,491 (reported on 15.1% of returns)
Here:
+$7,491
State:
+$7,823
(% of AGI for various income ranges: 15.3% for AGIs below $10k, 8.2% for AGIs $10k-25k, 2.5% for AGIs $25k-50k, 2.3% for AGIs $50k-75k, 2.6% for AGIs $75k-100k, 0.3% for AGIs over 100k)
IRA payment deduction: $1,294 (reported on 0.7% of returns)
72176:
$1,294
Arkansas:
$3,204
Total itemized deductions: $14,513 (22% of AGI, reported on 22.5% of returns)
Here:
$14,513
State:
$18,389
Here:
22.2% of AGI
State:
21.0% of AGI
(% of AGI for various income ranges: 6.4% for AGIs $10k-25k, 7.8% for AGIs $25k-50k, 10.2% for AGIs $50k-75k, 12.8% for AGIs $75k-100k, 13.3% for AGIs over 100k)
Charity contributions deductions: $3,201 (5% of AGI, reported on 17.8% of returns)
Here:
$3,201
State:
$4,725
Here:
4.9% of AGI
State:
5.1% of AGI
(% of AGI for various income ranges: 0.9% for AGIs $10k-25k, 1.3% for AGIs $25k-50k, 2.1% for AGIs $50k-75k, 2.5% for AGIs $75k-100k, 1.8% for AGIs over 100k)
Total tax: $3,939 (reported on 71.0% of returns)
72176:
$3,939
State:
$6,047
(% of AGI for various income ranges: 3.3% for AGIs below $10k, 4.1% for AGIs $10k-25k, 5.7% for AGIs $25k-50k, 7.6% for AGIs $50k-75k, 10.3% for AGIs $75k-100k, 17.3% for AGIs over 100k)
Earned income credit: $2,040 (reported on 23.6% of returns)
Here:
$2,040
State:
$1,909
Percentage of individuals using paid preparers for their 2004 taxes: 62.9%
Here:
63%
State:
67%
(% for various income ranges: 57.5% for AGIs below $10k, 63.9% for AGIs $10k-25k, 63.9% for AGIs $25k-50k, 66.9% for AGIs $50k-75k, 56.0% for AGIs $75k-100k, 73.2% for AGIs over 100k)
Household received Food Stamps/SNAP in the past 12 months: 620 Household did not receive Food Stamps/SNAP in the past 12 months: 2,477
Women who had a birth in the past 12 months: 108 (66 now married, 41 unmarried) Women who did not have a birth in the past 12 months: 2,154 (1,222 now married, 936 unmarried)
Housing units in zip code 72176 with a mortgage: 1,590 (84 second mortgage, 81 both second mortgage and home equity loan) Median monthly owner costs for units with a mortgage: $1,188 Median monthly owner costs for units without a mortgage: $500
Residents with income below the poverty level in 2022:
This zip code:
13.9%
Whole state:
16.8%
Residents with income below 50% of the poverty level in 2022:
This zip code:
4.4%
Whole state:
8.5%
Median number of rooms in houses and condos:
Here:
5.8
State:
6.1
Median number of rooms in apartments:
Here:
5.3
State:
4.3
Notable locations in this zip code not listed on our city pages
Notable locations in zip code 72176: Jackson Store (A), Ward Police Department (B), Butlerville Volunteer Fire Department (C), Ward Volunteer Fire Department Station 1 (D), Ward Volunteer Fire Department Station 2 (E), Allied Ambulance Service, Limited Liability Company (Advanced Life Support) (F). Display/hide their locations on the map
Churches in zip code 72176 include: Cocklebur Church (A), David Chapel (B), New Horizon Church (C), Sunnyside Church (D), Pleasant Ridge Church (E). Display/hide their locations on the map
Cemeteries: Bass Cemetery (1), Bryles Cemetery (2), Green Cemetery (3), Allison Cemetery (4), Monk Cemetery (5), Sylvania Cemetery (6), Butlerville Cemetery (7). Display/hide their locations on the map
Streams, rivers, and creeks: Mill Creek (A), Lick Creek (B), Webb Branch (C), Hickory Plains Creek (D), Guess Branch (E), Duck Creek (F), Brush Creek (G), Red Cut Slough (H), Cypress Bayou (I). Display/hide their locations on the map
Size of family households: 843 2-persons, 939 3-persons, 299 4-persons, 216 5-persons, 31 6-persons, 92 7-or-more-persons
Size of nonfamily households: 544 1-person, 69 2-persons, 35 3-persons
1,362 married couples with children.
838 single-parent households (152 men, 686 women).
96.7% of residents of 72176 zip code speak English at home.
1.3% of residents speak Spanish at home (100% very well).
1.0% of residents speak other Indo-European language at home (74% very well, 26% well).
0.7% of residents speak Asian or Pacific Island language at home (70% very well, 30% well).
Foreign born population: 122 (1.4%) (70.2% of them are naturalized citizens)
This zip code:
1.4%
Whole state:
5.1%
48%Ivory Coast
26%Malaysia
11%Japan
10%Azores Islands
23%English
22%American
12%Irish
9%German
3%Italian
2%Liberian
1%Scottish
Year of entry for the foreign-born population
622010 or later
02000 to 2009
1231990 to 1999
109Before 1990
Facilities with environmental interests located in this zip code:
HWY 31- 38 MART (170 SIMS LANE in WARD, AR)
(Integrated Compliance Information System) - ICIS-06-1998-0689, FORMAL ENFORCEMENT ACTION Business SIC classification: GROCERY STORES; GASOLINE SERVICE STATIONS
Housing units lacking complete plumbing facilities: 4.3% Housing units lacking complete kitchen facilities: 4.6%
72.6%Electricity
17.9%Utility gas
4.8%Wood
4.8%Bottled, tank, or LP gas
Population in 1990: 3,503. Population change in the 1990s: +1,861 (+53.1%).
Place of birth for U.S.-born residents:
This state: 5,681
Northeast: 315
Midwest: 586
South: 1,048
West: 853
49% of the 72176 zip code residents lived in the same house 5 years ago. Out of people who lived in different houses, 38% lived in this county. Out of people who lived in different counties, 50% lived in Arkansas.
87% of the 72176 zip code residents lived in the same house 1 year ago. Out of people who lived in different houses, 28% moved from this county. Out of people who lived in different houses, 35% moved from different county within same state. Out of people who lived in different houses, 34% moved from different state. Out of people who lived in different houses, 8% moved from abroad.
Private vs. public school enrollment:
Students in private schools in grades 1 to 8 (elementary and middle school): 65
Here:
6.5%
Arkansas:
10.5%
Students in private schools in grades 9 to 12 (high school): 38
Here:
7.7%
Arkansas:
8.7%
Students in private undergraduate colleges: 69
Here:
25.6%
Arkansas:
19.4%
Occupation by median earnings in the past 12 months ($)
91,135Architecture and engineering occupations
73,366Health diagnosing and treating practitioners and other technical occupations
56,253Installation, maintenance, and repair occupations
53,812Management occupations
52,998Production occupations
51,076Construction and extraction occupations
Top industries in this zip code by the number of employees in 2005:
Administrative and Support and Waste Management and Remediation Services: Security Guards and Patrol Services (20-49 employees: 1 establishment)
Construction: Electrical Contractors (10-19: 1)
Wholesale Trade: Service Establishment Equipment and Supplies Merchant Wholesalers (10-19: 1)
Other Services (except Public Administration): Religious Organizations (5-9: 1, 1-4: 2)
Construction: Other Building Finishing Contractors (5-9: 1, 1-4: 1)
Accommodation and Food Services: Full-Service Restaurants (5-9: 1)
Accommodation and Food Services: Limited-Service Restaurants (5-9: 1)
Finance and Insurance: Commercial Banking (5-9: 1)
Fatal accident statistics in 2014:
Fatal accident count: 2
Vehicles involved in fatal accidents: 2
Fatal accidents caused by drunken drivers: 0
Fatalities: 2
Persons involved in fatal accidents: 2
Pedestrians involved in fatal accidents: 0
Fatal accident statistics in 2013:
Fatal accident count: 1
Vehicles involved in fatal accidents: 1
Fatal accidents caused by drunken drivers: 1
Fatalities: 1
Persons involved in fatal accidents: 1
Pedestrians involved in fatal accidents: 0
Home Mortgage Disclosure Act Aggregated Statistics For Year 2009 (Based on 2 full and 4 partial tracts)
A) FHA, FSA/RHS & VA Home Purchase Loans
B) Conventional Home Purchase Loans
C) Refinancings
D) Home Improvement Loans
F) Non-occupant Loans on < 5 Family Dwellings (A B C & D)
G) Loans On Manufactured Home Dwelling (A B C & D)
Number
Average Value
Number
Average Value
Number
Average Value
Number
Average Value
Number
Average Value
Number
Average Value
LOANS ORIGINATED
370
$113,918
121
$106,920
237
$132,953
27
$26,129
72
$81,459
26
$47,375
APPLICATIONS APPROVED, NOT ACCEPTED
6
$138,165
11
$73,238
21
$125,282
3
$24,270
3
$59,533
11
$64,396
APPLICATIONS DENIED
45
$118,172
30
$83,406
93
$139,020
16
$23,232
3
$120,423
30
$59,065
APPLICATIONS WITHDRAWN
15
$112,590
4
$80,040
81
$133,039
1
$6,320
6
$89,970
5
$87,606
FILES CLOSED FOR INCOMPLETENESS
11
$141,437
3
$31,973
18
$138,474
0
$0
0
$0
3
$54,207
Aggregated Statistics For Year 2008 (Based on 2 full and 4 partial tracts)
A) FHA, FSA/RHS & VA Home Purchase Loans
B) Conventional Home Purchase Loans
C) Refinancings
D) Home Improvement Loans
E) Loans on Dwellings For 5+ Families
F) Non-occupant Loans on < 5 Family Dwellings (A B C & D)
G) Loans On Manufactured Home Dwelling (A B C & D)
Number
Average Value
Number
Average Value
Number
Average Value
Number
Average Value
Number
Average Value
Number
Average Value
Number
Average Value
LOANS ORIGINATED
294
$114,530
136
$103,106
225
$130,237
58
$23,206
4
$809,730
88
$114,030
35
$51,040
APPLICATIONS APPROVED, NOT ACCEPTED
7
$94,794
12
$86,458
26
$125,068
7
$40,213
0
$0
4
$88,598
14
$58,547
APPLICATIONS DENIED
34
$123,397
42
$82,506
97
$112,092
49
$19,331
0
$0
7
$58,166
29
$57,716
APPLICATIONS WITHDRAWN
24
$117,711
12
$102,248
66
$113,966
3
$36,403
0
$0
3
$43,267
7
$69,183
FILES CLOSED FOR INCOMPLETENESS
4
$121,190
4
$183,202
13
$129,071
1
$92,570
0
$0
2
$125,135
1
$39,100
Aggregated Statistics For Year 2007 (Based on 2 full and 4 partial tracts)
A) FHA, FSA/RHS & VA Home Purchase Loans
B) Conventional Home Purchase Loans
C) Refinancings
D) Home Improvement Loans
F) Non-occupant Loans on < 5 Family Dwellings (A B C & D)
G) Loans On Manufactured Home Dwelling (A B C & D)
Number
Average Value
Number
Average Value
Number
Average Value
Number
Average Value
Number
Average Value
Number
Average Value
LOANS ORIGINATED
177
$113,530
260
$103,430
255
$113,665
52
$29,804
131
$88,361
56
$55,125
APPLICATIONS APPROVED, NOT ACCEPTED
5
$112,172
24
$76,450
25
$103,459
4
$85,920
4
$100,448
11
$57,615
APPLICATIONS DENIED
24
$90,517
71
$84,824
106
$130,952
54
$23,425
22
$97,870
25
$42,297
APPLICATIONS WITHDRAWN
11
$111,046
20
$107,311
38
$125,769
4
$60,670
5
$83,892
4
$88,565
FILES CLOSED FOR INCOMPLETENESS
4
$127,198
6
$110,980
19
$124,882
1
$71,460
3
$57,950
0
$0
Aggregated Statistics For Year 2006 (Based on 2 full and 4 partial tracts)
A) FHA, FSA/RHS & VA Home Purchase Loans
B) Conventional Home Purchase Loans
C) Refinancings
D) Home Improvement Loans
E) Loans on Dwellings For 5+ Families
F) Non-occupant Loans on < 5 Family Dwellings (A B C & D)
G) Loans On Manufactured Home Dwelling (A B C & D)
Number
Average Value
Number
Average Value
Number
Average Value
Number
Average Value
Number
Average Value
Number
Average Value
Number
Average Value
LOANS ORIGINATED
178
$110,801
314
$99,360
170
$101,109
45
$38,131
6
$251,463
44
$87,040
41
$61,725
APPLICATIONS APPROVED, NOT ACCEPTED
3
$101,897
34
$97,622
29
$102,902
6
$25,870
0
$0
3
$65,697
12
$46,711
APPLICATIONS DENIED
29
$107,954
84
$94,291
120
$99,945
31
$29,015
0
$0
15
$149,023
54
$56,651
APPLICATIONS WITHDRAWN
9
$108,573
34
$105,804
102
$105,539
4
$121,208
0
$0
6
$78,390
1
$92,380
FILES CLOSED FOR INCOMPLETENESS
1
$102,990
13
$108,085
9
$128,923
3
$134,730
0
$0
0
$0
3
$75,620
Aggregated Statistics For Year 2005 (Based on 2 full and 4 partial tracts)
A) FHA, FSA/RHS & VA Home Purchase Loans
B) Conventional Home Purchase Loans
C) Refinancings
D) Home Improvement Loans
F) Non-occupant Loans on < 5 Family Dwellings (A B C & D)
G) Loans On Manufactured Home Dwelling (A B C & D)
Number
Average Value
Number
Average Value
Number
Average Value
Number
Average Value
Number
Average Value
Number
Average Value
LOANS ORIGINATED
166
$103,909
274
$95,866
187
$99,380
44
$40,127
55
$77,072
58
$46,523
APPLICATIONS APPROVED, NOT ACCEPTED
3
$78,050
33
$75,760
38
$111,647
11
$33,995
1
$47,860
18
$50,401
APPLICATIONS DENIED
19
$87,335
105
$62,023
181
$98,485
32
$23,606
10
$68,151
69
$46,087
APPLICATIONS WITHDRAWN
15
$118,635
29
$98,261
119
$105,440
5
$386,710
3
$52,053
4
$86,060
FILES CLOSED FOR INCOMPLETENESS
0
$0
15
$80,049
10
$133,914
1
$64,970
0
$0
0
$0
Aggregated Statistics For Year 2004 (Based on 2 full and 4 partial tracts)
A) FHA, FSA/RHS & VA Home Purchase Loans
B) Conventional Home Purchase Loans
C) Refinancings
D) Home Improvement Loans
E) Loans on Dwellings For 5+ Families
F) Non-occupant Loans on < 5 Family Dwellings (A B C & D)
G) Loans On Manufactured Home Dwelling (A B C & D)
Number
Average Value
Number
Average Value
Number
Average Value
Number
Average Value
Number
Average Value
Number
Average Value
Number
Average Value
LOANS ORIGINATED
207
$97,739
293
$85,709
265
$95,694
35
$39,621
0
$0
89
$78,685
71
$49,192
APPLICATIONS APPROVED, NOT ACCEPTED
1
$139,330
44
$55,235
45
$81,972
1
$36,040
0
$0
4
$54,782
21
$44,200
APPLICATIONS DENIED
29
$80,577
83
$73,137
133
$99,417
17
$15,128
2
$374,765
17
$108,667
59
$53,005
APPLICATIONS WITHDRAWN
17
$101,011
29
$93,907
80
$88,930
6
$65,492
0
$0
5
$51,628
13
$69,847
FILES CLOSED FOR INCOMPLETENESS
5
$83,658
4
$121,592
22
$141,454
0
$0
0
$0
0
$0
0
$0
Aggregated Statistics For Year 2003 (Based on 2 full and 4 partial tracts)
A) FHA, FSA/RHS & VA Home Purchase Loans
B) Conventional Home Purchase Loans
C) Refinancings
D) Home Improvement Loans
E) Loans on Dwellings For 5+ Families
F) Non-occupant Loans on < 5 Family Dwellings (A B C & D)
Number
Average Value
Number
Average Value
Number
Average Value
Number
Average Value
Number
Average Value
Number
Average Value
LOANS ORIGINATED
147
$92,162
133
$88,844
436
$95,741
37
$28,894
1
$80,570
44
$67,155
APPLICATIONS APPROVED, NOT ACCEPTED
3
$58,937
22
$78,457
49
$87,796
1
$28,750
0
$0
0
$0
APPLICATIONS DENIED
16
$95,379
86
$57,157
135
$82,267
12
$21,471
0
$0
17
$63,841
APPLICATIONS WITHDRAWN
16
$103,314
29
$79,749
94
$87,675
4
$36,895
0
$0
1
$36,800
FILES CLOSED FOR INCOMPLETENESS
5
$85,122
6
$77,412
17
$84,707
2
$48,545
0
$0
2
$43,690
Aggregated Statistics For Year 1999 (Based on 1 partial tract)
A) FHA, FSA/RHS & VA Home Purchase Loans
B) Conventional Home Purchase Loans
C) Refinancings
D) Home Improvement Loans
F) Non-occupant Loans on < 5 Family Dwellings (A B C & D)
2002 - 2018 National Fire Incident Reporting System (NFIRS) incidents
Based on the data from the years 2002 - 2018 the average number of fire incidents per year is 59. The highest number of fires - 98 took place in 2015, and the least - 29 in 2008. The data has a growing trend.
When looking into fire subcategories, the most reports belonged to: Outside Fires (53.0%), and Structure Fires (35.0%).
Fire incident types reported to NFIRS in Zip Code 72176


 Nearest zip codes: 72012, 72102, 72007, 72086, 72068, 72023.


 Based on the data from the years 2002 - 2018 the average number of fire incidents per year is 59. The highest number of fires - 98 took place in 2015, and the least - 29 in 2008. The data has a growing trend.
 When looking into fire subcategories, the most reports belonged to: Outside Fires (53.0%), and Structure Fires (35.0%).