Estimated zip code population in 2022: 1,282 Zip code population in 2010: 1,732 Zip code population in 2000: 1,965
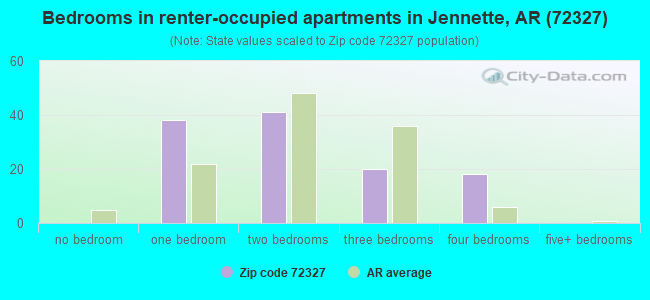
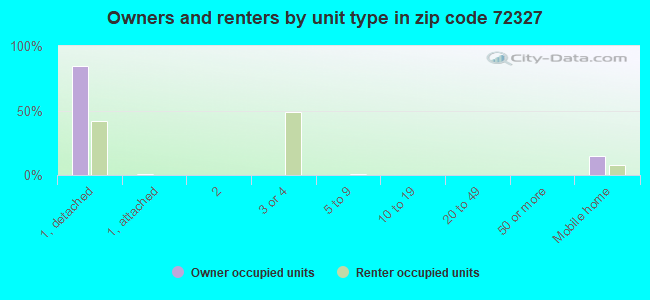
Houses and condos: 616 Renter-occupied apartments: 115
% of renters here:
22%
State:
34%
March 2022 cost of living index in zip code 72327: 77.9 (low, U.S. average is 100)
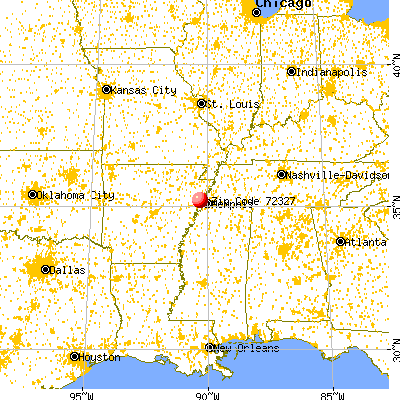
Land area: 102.0 sq. mi. Water area: 0.6 sq. mi.
Population density: 13 people per square mile
(very low).
OSM Map
General Map
Google Map
MSN Map
OSM Map
General Map
Google Map
MSN Map
OSM Map
General Map
Google Map
MSN Map
OSM Map
General Map
Google Map
MSN Map
Please wait while loading the map...
Real estate property taxes paid for housing units in 2022:
This zip code:
0.4% ($582)
Arkansas:
0.5% ($977)
Median real estate property taxes paid for housing units with mortgages in 2022: $1,193 (0.5%) Median real estate property taxes paid for housing units with no mortgage in 2022: $521 (0.5%)
Business Search- 14 Million verified businesses
Males: 598
(46.6%)
Females: 684
(53.4%)
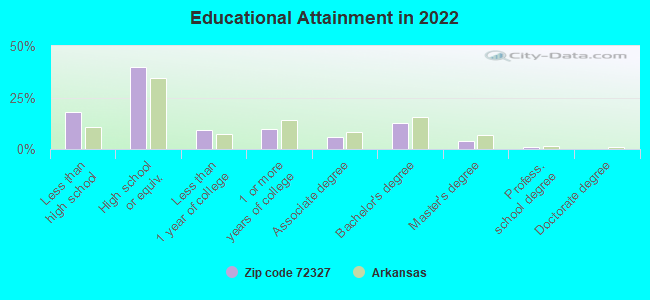
For population 25 years and over in 72327:
High school or higher: 81.4%
Bachelor's degree or higher: 17.7%
Graduate or professional degree: 5.0%
Unemployed: 3.7%
Mean travel time to work (commute): 24.7 minutes
For population 15 years and over in 72327:
Never married: 30.9%
Now married: 38.3%
Separated: 2.8%
Widowed: 8.9%
Divorced: 19.1%
Zip code 72327 compared to state average:
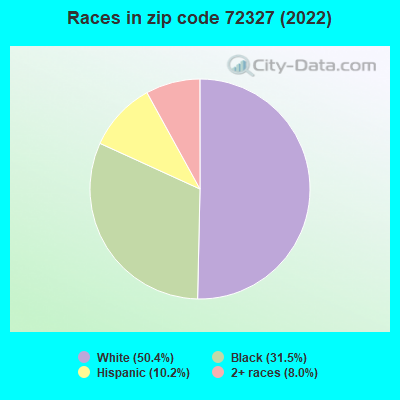
Black race population percentage above state average.
Median age above state average.
Foreign-born population percentage significantly below state average.
Renting percentage below state average.
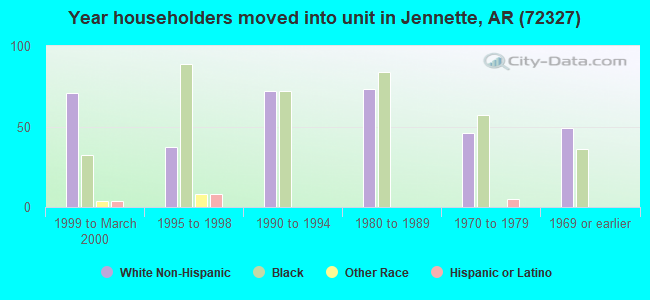
Length of stay since moving in significantly above state average.
Number of college students significantly below state average.
Averages for the 2020 tax year for zip code 72327, filed in 2021:
Average Adjusted Gross Income (AGI) in 2020: $50,777 (Individual Income Tax Returns)
Here:
$50,777
State:
$64,872
Salary/wage: $44,069 (reported on 87.1% of returns)
Here:
$44,069
State:
$50,644
(% of AGI for various income ranges: 1197.8% for AGIs below $25k, 4242.7% for AGIs $25k-50k, 7438.0% for AGIs $50k-75k, 11056.7% for AGIs $75k-100k, 27470.0% for AGIs $100k-200k)
Taxable interest for individuals: $300 (reported on 16.1% of returns)
This zip code:
$300
Arkansas:
$1,857
(% of AGI for various income ranges: 2.2% for AGIs below $25k, 8.0% for AGIs $50k-75k, 73.3% for AGIs $100k-200k)
Ordinary dividends: $675 (reported on 6.5% of returns)
Here:
$675
State:
$21,681
(% of AGI for various income ranges: 54.0% for AGIs $50k-75k)
Net capital gain/loss in AGI: +$2,100 (reported on 4.8% of returns)
Here:
+$2,100
State:
+$22,815
(% of AGI for various income ranges: 126.0% for AGIs $50k-75k)
Profit/loss from business: +$2,673 (reported on 17.7% of returns)
Here:
+$2,673
State:
+$9,743
(% of AGI for various income ranges: 121.7% for AGIs below $25k, 380.0% for AGIs $75k-100k)
Taxable individual retirement arrangement distribution: $8,300 (reported on 3.2% of returns)
72327:
$8,300
Arkansas:
$18,502
(% of AGI for various income ranges: 92.2% for AGIs below $25k)
Total itemized deductions: $28,800 (reported on 4.8% of returns)
Here:
$28,800
State:
$52,840
(% of AGI for various income ranges: 2880.0% for AGIs $75k-100k)
Charity contributions: $7,900 (reported on 4.8% of returns)
Here:
$7,900
State:
$35,735
(% of AGI for various income ranges: 474.0% for AGIs $50k-75k)
Taxes paid: $6,333 (reported on 4.8% of returns)
72327:
$6,333
State:
$7,196
(% of AGI for various income ranges: 633.3% for AGIs $75k-100k)
Earned income credit: $2,844 (reported on 25.8% of returns)
Here:
$2,844
State:
$2,546
(% of AGI for various income ranges: 168.9% for AGIs below $25k, 100.7% for AGIs $25k-50k)
Percentage of individuals using paid preparers for their 2020 taxes: 95.2%
Here:
95%
State:
94%
(% for various income ranges: 95.7% for AGIs below $25k, 94.7% for AGIs $25k-50k, 87.5% for AGIs $50k-75k, 100.0% for AGIs $75k-100k, 100.0% for AGIs $100k-200k)
Averages for the 2012 tax year for zip code 72327, filed in 2013:
Average Adjusted Gross Income (AGI) in 2012: $43,228 (Individual Income Tax Returns)
Here:
$43,228
State:
$52,148
Salary/wage: $34,695 (reported on 89.1% of returns)
Here:
$34,695
State:
$41,669
(% of AGI for various income ranges: 78.9% for AGIs below $25k, 89.2% for AGIs $25k-50k, 77.3% for AGIs $50k-75k, 75.1% for AGIs $75k-100k, 53.3% for AGIs $100k-200k)
Taxable interest for individuals: $309 (reported on 17.2% of returns)
This zip code:
$309
Arkansas:
$1,648
(% of AGI for various income ranges: 0.5% for AGIs below $25k, 0.1% for AGIs $50k-75k, 0.1% for AGIs $100k-200k)
Ordinary dividends: $650 (reported on 6.2% of returns)
Here:
$650
State:
$20,675
Net capital gain/loss in AGI: +$58,550 (reported on 3.1% of returns)
Here:
+$58,550
State:
+$15,222
Profit/loss from business: +$5,630 (reported on 15.6% of returns)
Here:
+$5,630
State:
+$9,665
Taxable individual retirement arrangement distribution: $4,450 (reported on 3.1% of returns)
72327:
$4,450
Arkansas:
$13,644
Total itemized deductions: $19,927 (22% of AGI, reported on 23.4% of returns)
Here:
$19,927
State:
$23,276
Here:
21.8% of AGI
State:
19.1% of AGI
(% of AGI for various income ranges: 7.3% for AGIs below $25k, 11.1% for AGIs $25k-50k, 12.2% for AGIs $50k-75k, 11.7% for AGIs $75k-100k, 11.1% for AGIs $100k-200k)
Charity contributions: $4,157 (reported on 21.9% of returns)
Here:
$4,157
State:
$5,996
(% of AGI for various income ranges: 3.4% for AGIs $25k-50k, 3.7% for AGIs $50k-75k, 2.1% for AGIs $100k-200k)
Taxes paid: $5,853 (reported on 23.4% of returns)
72327:
$5,853
State:
$7,941
(% of AGI for various income ranges: 0.8% for AGIs below $25k, 1.9% for AGIs $25k-50k, 2.6% for AGIs $50k-75k, 3.4% for AGIs $75k-100k, 5.1% for AGIs $100k-200k)
Earned income credit: $2,864 (reported on 34.4% of returns)
Here:
$2,864
State:
$2,455
(% of AGI for various income ranges: 12.8% for AGIs below $25k, 1.9% for AGIs $25k-50k)
Percentage of individuals using paid preparers for their 2012 taxes: 60.9%
Here:
61%
State:
61%
(% for various income ranges: 60.0% for AGIs below $25k, 55.6% for AGIs $25k-50k, 71.4% for AGIs $50k-75k, 50.0% for AGIs $75k-100k, 80.0% for AGIs $100k-200k)
Averages for the 2004 tax year for zip code 72327, filed in 2005:
Average Adjusted Gross Income (AGI) in 2004: $31,017 (Individual Income Tax Returns)
Here:
$31,017
State:
$39,270
Salary/wage: $26,014 (reported on 91.6% of returns)
Here:
$26,014
State:
$34,079
(% of AGI for various income ranges: 88.5% for AGIs below $10k, 87.6% for AGIs $10k-25k, 88.5% for AGIs $25k-50k, 82.4% for AGIs $50k-75k, 74.0% for AGIs $75k-100k, 51.0% for AGIs over 100k)
Taxable interest for individuals: $1,248 (reported on 18.1% of returns)
This zip code:
$1,248
Arkansas:
$1,904
(% of AGI for various income ranges: 0.5% for AGIs below $10k, 0.8% for AGIs $10k-25k, 0.3% for AGIs $25k-50k, 0.6% for AGIs $50k-75k, 0.1% for AGIs $75k-100k, 1.4% for AGIs over 100k)
Taxable dividends: $5,326 (reported on 6.7% of returns)
Here:
$5,326
State:
$5,995
(% of AGI for various income ranges: 0.2% for AGIs $10k-25k, 0.2% for AGIs $50k-75k, 4.5% for AGIs over 100k)
Net capital gain/loss: +$2,829 (reported on 5.1% of returns)
Here:
+$2,829
State:
+$10,430
Profit/loss from business: +$7,645 (reported on 11.0% of returns)
Here:
+$7,645
State:
+$7,823
(% of AGI for various income ranges: 4.1% for AGIs below $10k, 3.9% for AGIs $10k-25k, 0.2% for AGIs $50k-75k, 17.4% for AGIs $75k-100k)
Profit/loss from farming: +$364 (reported on 1.6% of returns)
Here:
+$364
State:
-$5,941
Total itemized deductions: $16,319 (21% of AGI, reported on 16.8% of returns)
Here:
$16,319
State:
$18,389
Here:
20.7% of AGI
State:
21.0% of AGI
(% of AGI for various income ranges: 5.0% for AGIs $10k-25k, 8.1% for AGIs $25k-50k, 9.3% for AGIs $50k-75k, 14.8% for AGIs $75k-100k, 11.6% for AGIs over 100k)
Charity contributions deductions: $4,612 (6% of AGI, reported on 14.9% of returns)
Here:
$4,612
State:
$4,725
Here:
5.7% of AGI
State:
5.1% of AGI
(% of AGI for various income ranges: 0.9% for AGIs $10k-25k, 1.8% for AGIs $25k-50k, 2.4% for AGIs $50k-75k, 3.0% for AGIs $75k-100k, 3.7% for AGIs over 100k)
Total tax: $5,231 (reported on 55.3% of returns)
72327:
$5,231
State:
$6,047
(% of AGI for various income ranges: 2.0% for AGIs below $10k, 2.6% for AGIs $10k-25k, 5.3% for AGIs $25k-50k, 8.4% for AGIs $50k-75k, 10.8% for AGIs $75k-100k, 20.4% for AGIs over 100k)
Earned income credit: $2,218 (reported on 39.9% of returns)
Here:
$2,218
State:
$1,909
Percentage of individuals using paid preparers for their 2004 taxes: 64.6%
Here:
65%
State:
67%
(% for various income ranges: 58.3% for AGIs below $10k, 70.0% for AGIs $10k-25k, 61.0% for AGIs $25k-50k, 59.6% for AGIs $50k-75k, 76.0% for AGIs $75k-100k, 75.0% for AGIs over 100k)
Likely homosexual households (counted as self-reported same-sex unmarried-partner households)
Lesbian couples: 0.0% of all households
Gay men: 1.5% of all households
Household received Food Stamps/SNAP in the past 12 months: 39 Household did not receive Food Stamps/SNAP in the past 12 months: 483
Women who had a birth in the past 12 months: 17 (12 now married, 5 unmarried) Women who did not have a birth in the past 12 months: 260 (68 now married, 191 unmarried)
Housing units in zip code 72327 with a mortgage: 148 (7 second mortgage, 4 home equity loan, 1 both second mortgage and home equity loan) Median monthly owner costs for units with a mortgage: $1,374 Median monthly owner costs for units without a mortgage: $428
Residents with income below the poverty level in 2022:
This zip code:
8.0%
Whole state:
16.8%
Residents with income below 50% of the poverty level in 2022:
This zip code:
6.2%
Whole state:
8.5%
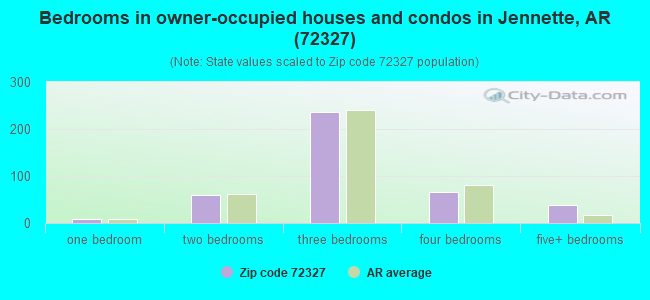
Median number of rooms in houses and condos:
Here:
6.2
State:
6.1
Median number of rooms in apartments:
Here:
4.2
State:
4.3
Notable locations in this zip code not listed on our city pages
Notable locations in zip code 72327: Crawfordsville Volunteer Fire Station (A), Jericho Police Department (B), Jericho Fire Department (C). Display/hide their locations on the map
Churches in zip code 72327 include: Wallace Chapel (A), Zion Field Church (B), Lake Grove Church (C), Corinthian Church (D), Ebenezer Church (E), Galilee Church (F), Mount Vernon Church (G), Mount Zion Church (H), New Bethlehem Church (I). Display/hide their locations on the map
Cemeteries: Trexler Cemetery (1), Shiloh Cemetery (2), Medley Cemetery (3), Pilgrim Rest Cemetery (4), Cruse Cemetery (5), Corinthian Cemetery (6), Saint Johns Cemetery (7). Display/hide their locations on the map
Size of family households: 158 2-persons, 59 3-persons, 72 4-persons, 13 5-persons, 9 6-persons, 6 7-or-more-persons
Size of nonfamily households: 189 1-person, 11 2-persons, 2 3-persons
164 married couples with children.
103 single-parent households (31 men, 72 women).
97.3% of residents of 72327 zip code speak English at home.
2.2% of residents speak Spanish at home (54% very well, 23% well, 23% not at all).
0.1% of residents speak other Indo-European language at home (100% very well).
Foreign born population: 27 (2.2%) (26.5% of them are naturalized citizens)
This zip code:
2.2%
Whole state:
5.1%
93%Honduras
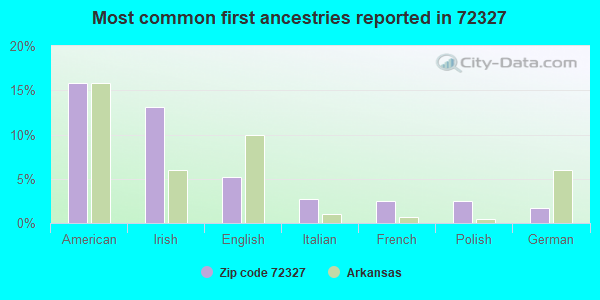
16%American
13%Irish
5%English
3%Italian
2%French
2%Polish
2%German
Year of entry for the foreign-born population
212010 or later
02000 to 2009
01990 to 1999
12Before 1990
Facilities with environmental interests located in this zip code:
AMERICAN TEL & TEL CO LONG LINES (6M SE CRAWSFORDSVILLE in CRAWFORDSVILLE, AR)
(Resource Conservation and Recovery Act (tracking hazardous waste))
FAST MARKET (6934 I-55 (JAMES MILL EXIT) in JERICHO, AR)
National Pollutant Discharge Elimination System NON-MAJOR (Tracking pollutant discharge elimination systems) - permit Business SIC classification: GASOLINE SERVICE STATIONS Alternative names: FLASH MARKET
GULF RICE ARKANSAS, INC. (403 SOUTH MAIN in CRAWFORDSVILLE, AR)
AIR MINOR (AIRS/AFS) Business SIC classification: GRAIN AND FIELD BEANS
Housing units lacking complete plumbing facilities: 12.6% Housing units lacking complete kitchen facilities: 6.3%
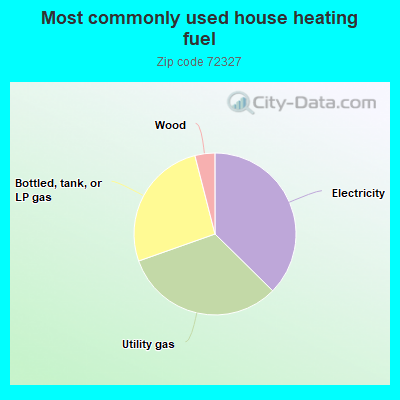
37.5%Electricity
32.3%Utility gas
26.5%Bottled, tank, or LP gas
4.0%Wood
Population in 1990: 1,834. Population change in the 1990s: +131 (+7.1%).
Place of birth for U.S.-born residents:
This state: 845
Northeast: 8
Midwest: 22
South: 360
West: 6
68% of the 72327 zip code residents lived in the same house 5 years ago. Out of people who lived in different houses, 69% lived in this county. Out of people who lived in different counties, 50% lived in Arkansas.
95% of the 72327 zip code residents lived in the same house 1 year ago. Out of people who lived in different houses, 66% moved from this county. Out of people who lived in different houses, 24% moved from different state. Out of people who lived in different houses, 7% moved from abroad.
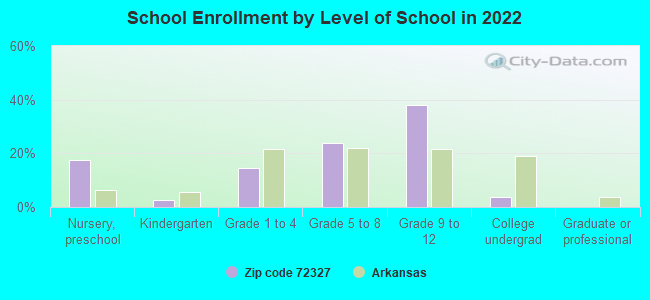
Private vs. public school enrollment:
Students in private schools in grades 1 to 8 (elementary and middle school): 23
Here:
20.2%
Arkansas:
10.5%
Students in private schools in grades 9 to 12 (high school):
Here:
0.8%
Arkansas:
8.7%
Students in private undergraduate colleges:
Here:
0.0%
Arkansas:
19.4%
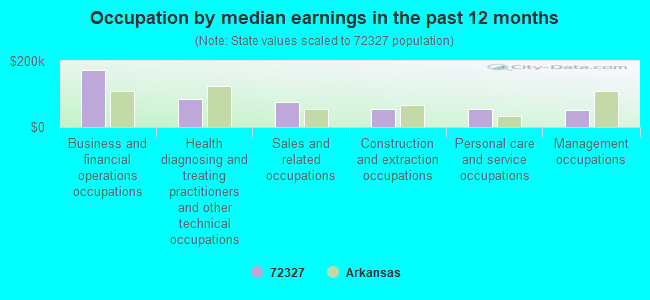
Occupation by median earnings in the past 12 months ($)
172,949Business and financial operations occupations
86,125Health diagnosing and treating practitioners and other technical occupations
76,893Sales and related occupations
54,430Construction and extraction occupations
53,676Personal care and service occupations
52,896Management occupations
Top industries in this zip code by the number of employees in 2005:
Wholesale Trade: Motor Vehicle Parts (Used) Merchant Wholesalers (10-19: 1)
Wholesale Trade: Petroleum Bulk Stations and Terminals (10-19: 1)
Other Services (except Public Administration): Commercial and Industrial Machinery and Equipment (except Automotive and Electronic) Repair and Maintenance (5-9: 1, 1-4: 1)
Wholesale Trade: Other Chemical and Allied Products Merchant Wholesalers (5-9: 1)
Construction: Residential Remodelers (5-9: 1)
Educational Services: Business and Secretarial Schools (5-9: 1)
Construction: Commercial and Institutional Building Construction (5-9: 1)
People in group quarters in 2000:
9 people in homes for the mentally ill
Fatal accident statistics in 2014:
Fatal accident count: 2
Vehicles involved in fatal accidents: 3
Fatal accidents caused by drunken drivers: 0
Fatalities: 2
Persons involved in fatal accidents: 4
Pedestrians involved in fatal accidents: 1
Fatal accident statistics in 2012:
Fatal accident count: 1
Vehicles involved in fatal accidents: 1
Fatal accidents caused by drunken drivers: 1
Fatalities: 1
Persons involved in fatal accidents: 3
Pedestrians involved in fatal accidents: 0
Home Mortgage Disclosure Act Aggregated Statistics For Year 2009 (Based on 6 partial tracts)
A) FHA, FSA/RHS & VA Home Purchase Loans
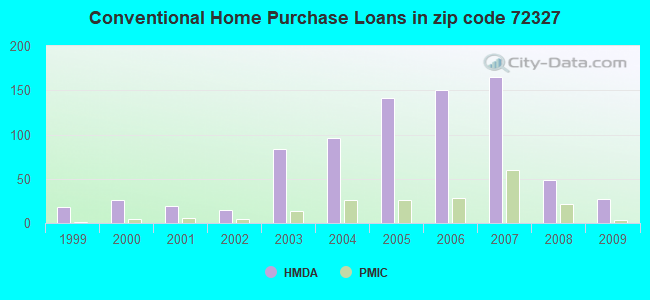
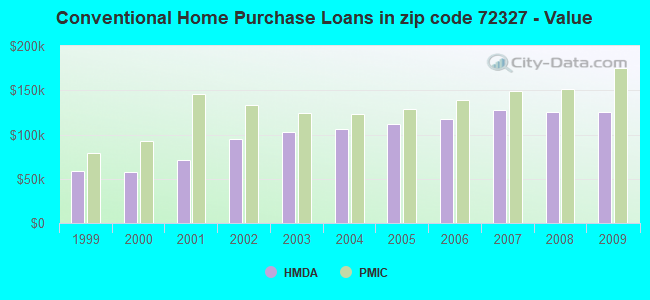
B) Conventional Home Purchase Loans
C) Refinancings
D) Home Improvement Loans
E) Loans on Dwellings For 5+ Families
F) Non-occupant Loans on < 5 Family Dwellings (A B C & D)
G) Loans On Manufactured Home Dwelling (A B C & D)
Number
Average Value
Number
Average Value
Number
Average Value
Number
Average Value
Number
Average Value
Number
Average Value
Number
Average Value
LOANS ORIGINATED
98
$132,234
27
$125,343
83
$121,843
12
$43,039
1
$8,336,250
11
$72,140
3
$33,527
APPLICATIONS APPROVED, NOT ACCEPTED
2
$224,740
2
$104,600
10
$137,875
1
$15,390
0
$0
1
$63,660
2
$52,260
APPLICATIONS DENIED
6
$119,777
9
$78,078
48
$123,322
8
$17,321
0
$0
5
$70,658
5
$39,218
APPLICATIONS WITHDRAWN
4
$153,008
5
$101,228
34
$136,875
0
$0
0
$0
1
$92,980
0
$0
FILES CLOSED FOR INCOMPLETENESS
2
$143,335
0
$0
3
$141,450
0
$0
0
$0
0
$0
0
$0
Aggregated Statistics For Year 2008 (Based on 6 partial tracts)
A) FHA, FSA/RHS & VA Home Purchase Loans
B) Conventional Home Purchase Loans
C) Refinancings
D) Home Improvement Loans
E) Loans on Dwellings For 5+ Families
F) Non-occupant Loans on < 5 Family Dwellings (A B C & D)
G) Loans On Manufactured Home Dwelling (A B C & D)
Number
Average Value
Number
Average Value
Number
Average Value
Number
Average Value
Number
Average Value
Number
Average Value
Number
Average Value
LOANS ORIGINATED
63
$137,498
49
$125,539
64
$117,204
24
$30,416
1
$256,280
26
$75,700
4
$58,430
APPLICATIONS APPROVED, NOT ACCEPTED
2
$146,660
6
$111,388
8
$133,284
3
$14,440
0
$0
2
$78,970
2
$41,025
APPLICATIONS DENIED
11
$139,330
18
$74,901
50
$129,431
13
$24,492
0
$0
4
$107,862
10
$55,909
APPLICATIONS WITHDRAWN
1
$199,660
4
$132,068
18
$127,259
0
$0
0
$0
2
$96,065
1
$6,180
FILES CLOSED FOR INCOMPLETENESS
2
$94,220
2
$102,885
5
$95,168
0
$0
0
$0
0
$0
0
$0
Aggregated Statistics For Year 2007 (Based on 6 partial tracts)
A) FHA, FSA/RHS & VA Home Purchase Loans
B) Conventional Home Purchase Loans
C) Refinancings
D) Home Improvement Loans
E) Loans on Dwellings For 5+ Families
F) Non-occupant Loans on < 5 Family Dwellings (A B C & D)
G) Loans On Manufactured Home Dwelling (A B C & D)
Number
Average Value
Number
Average Value
Number
Average Value
Number
Average Value
Number
Average Value
Number
Average Value
Number
Average Value
LOANS ORIGINATED
62
$128,374
165
$127,715
83
$119,259
22
$18,655
1
$8,940
46
$98,656
8
$56,080
APPLICATIONS APPROVED, NOT ACCEPTED
1
$194,300
16
$96,132
14
$110,092
1
$20,860
0
$0
3
$147,803
5
$49,484
APPLICATIONS DENIED
5
$114,528
41
$123,937
67
$129,367
26
$27,558
0
$0
11
$142,154
13
$39,878
APPLICATIONS WITHDRAWN
2
$168,670
11
$100,892
21
$125,335
0
$0
1
$1,132,400
4
$57,628
0
$0
FILES CLOSED FOR INCOMPLETENESS
1
$202,640
6
$142,992
5
$105,440
0
$0
0
$0
0
$0
0
$0
Aggregated Statistics For Year 2006 (Based on 6 partial tracts)
A) FHA, FSA/RHS & VA Home Purchase Loans
B) Conventional Home Purchase Loans
C) Refinancings
D) Home Improvement Loans
E) Loans on Dwellings For 5+ Families
F) Non-occupant Loans on < 5 Family Dwellings (A B C & D)
G) Loans On Manufactured Home Dwelling (A B C & D)
Number
Average Value
Number
Average Value
Number
Average Value
Number
Average Value
Number
Average Value
Number
Average Value
Number
Average Value
LOANS ORIGINATED
52
$127,899
150
$117,551
82
$104,029
19
$33,399
1
$13,110
28
$114,174
7
$36,673
APPLICATIONS APPROVED, NOT ACCEPTED
0
$0
16
$96,317
15
$70,240
0
$0
0
$0
5
$99,532
2
$30,275
APPLICATIONS DENIED
6
$108,632
58
$111,106
49
$106,326
19
$21,083
0
$0
6
$41,790
10
$44,075
APPLICATIONS WITHDRAWN
5
$120,396
23
$127,171
32
$99,527
1
$41,180
0
$0
6
$143,735
0
$0
FILES CLOSED FOR INCOMPLETENESS
1
$112,740
5
$101,058
12
$140,983
0
$0
0
$0
1
$48,280
0
$0
Aggregated Statistics For Year 2005 (Based on 6 partial tracts)
A) FHA, FSA/RHS & VA Home Purchase Loans
B) Conventional Home Purchase Loans
C) Refinancings
D) Home Improvement Loans
E) Loans on Dwellings For 5+ Families
F) Non-occupant Loans on < 5 Family Dwellings (A B C & D)
G) Loans On Manufactured Home Dwelling (A B C & D)
Number
Average Value
Number
Average Value
Number
Average Value
Number
Average Value
Number
Average Value
Number
Average Value
Number
Average Value
LOANS ORIGINATED
67
$121,360
141
$111,731
110
$97,768
13
$24,905
1
$61,390
21
$96,823
5
$39,240
APPLICATIONS APPROVED, NOT ACCEPTED
0
$0
18
$93,426
21
$88,951
2
$8,215
0
$0
1
$99,530
3
$64,913
APPLICATIONS DENIED
8
$93,471
50
$87,201
72
$99,247
21
$35,607
1
$5,960
8
$87,766
16
$36,633
APPLICATIONS WITHDRAWN
3
$120,450
23
$105,963
35
$120,183
3
$259,597
0
$0
2
$42,570
1
$37,550
FILES CLOSED FOR INCOMPLETENESS
1
$73,310
11
$137,906
13
$118,482
0
$0
0
$0
0
$0
0
$0
Aggregated Statistics For Year 2004 (Based on 6 partial tracts)
A) FHA, FSA/RHS & VA Home Purchase Loans
B) Conventional Home Purchase Loans
C) Refinancings
D) Home Improvement Loans
E) Loans on Dwellings For 5+ Families
F) Non-occupant Loans on < 5 Family Dwellings (A B C & D)
G) Loans On Manufactured Home Dwelling (A B C & D)
Number
Average Value
Number
Average Value
Number
Average Value
Number
Average Value
Number
Average Value
Number
Average Value
Number
Average Value
LOANS ORIGINATED
54
$111,901
96
$106,084
92
$99,707
14
$23,796
1
$221,710
12
$61,616
6
$43,683
APPLICATIONS APPROVED, NOT ACCEPTED
1
$46,850
11
$105,068
20
$97,893
2
$23,420
0
$0
2
$71,035
2
$28,830
APPLICATIONS DENIED
10
$116,368
35
$79,993
74
$86,723
12
$22,422
1
$8,940
6
$69,675
15
$41,623
APPLICATIONS WITHDRAWN
1
$87,020
5
$101,948
34
$95,024
1
$74,500
0
$0
2
$34,570
0
$0
FILES CLOSED FOR INCOMPLETENESS
0
$0
1
$90,600
20
$113,350
1
$44,700
0
$0
1
$74,130
0
$0
Aggregated Statistics For Year 2003 (Based on 6 partial tracts)
A) FHA, FSA/RHS & VA Home Purchase Loans
B) Conventional Home Purchase Loans
C) Refinancings
D) Home Improvement Loans
F) Non-occupant Loans on < 5 Family Dwellings (A B C & D)
Number
Average Value
Number
Average Value
Number
Average Value
Number
Average Value
Number
Average Value
LOANS ORIGINATED
65
$106,620
84
$103,040
200
$93,600
17
$18,706
15
$72,028
APPLICATIONS APPROVED, NOT ACCEPTED
2
$66,415
11
$94,550
30
$88,801
2
$19,235
1
$59,600
APPLICATIONS DENIED
2
$98,140
33
$74,665
84
$80,483
6
$8,235
5
$86,146
APPLICATIONS WITHDRAWN
4
$108,020
15
$104,867
48
$95,614
1
$2,220
3
$39,293
FILES CLOSED FOR INCOMPLETENESS
1
$85,230
1
$117,640
11
$97,100
0
$0
0
$0
Aggregated Statistics For Year 2002 (Based on 4 partial tracts)
A) FHA, FSA/RHS & VA Home Purchase Loans
B) Conventional Home Purchase Loans
C) Refinancings
D) Home Improvement Loans
F) Non-occupant Loans on < 5 Family Dwellings (A B C & D)
Number
Average Value
Number
Average Value
Number
Average Value
Number
Average Value
Number
Average Value
LOANS ORIGINATED
14
$88,140
15
$95,117
35
$86,319
5
$5,242
3
$26,770
APPLICATIONS APPROVED, NOT ACCEPTED
0
$0
4
$47,705
11
$79,489
0
$0
2
$67,440
APPLICATIONS DENIED
3
$74,990
20
$60,432
17
$71,405
9
$8,467
2
$49,165
APPLICATIONS WITHDRAWN
1
$118,920
3
$86,537
6
$72,490
0
$0
0
$0
FILES CLOSED FOR INCOMPLETENESS
0
$0
1
$71,560
2
$39,125
1
$5,150
0
$0
Aggregated Statistics For Year 2001 (Based on 4 partial tracts)
A) FHA, FSA/RHS & VA Home Purchase Loans
B) Conventional Home Purchase Loans
C) Refinancings
D) Home Improvement Loans
F) Non-occupant Loans on < 5 Family Dwellings (A B C & D)
Number
Average Value
Number
Average Value
Number
Average Value
Number
Average Value
Number
Average Value
LOANS ORIGINATED
18
$102,394
19
$71,197
35
$80,757
13
$8,532
6
$37,782
APPLICATIONS APPROVED, NOT ACCEPTED
0
$0
8
$53,476
3
$43,667
0
$0
1
$9,780
APPLICATIONS DENIED
1
$99,870
18
$36,162
14
$71,448
12
$12,065
4
$51,130
APPLICATIONS WITHDRAWN
1
$66,920
1
$48,910
14
$69,284
0
$0
0
$0
FILES CLOSED FOR INCOMPLETENESS
0
$0
0
$0
2
$78,515
1
$32,710
0
$0
Aggregated Statistics For Year 2000 (Based on 4 partial tracts)
A) FHA, FSA/RHS & VA Home Purchase Loans
B) Conventional Home Purchase Loans
C) Refinancings
D) Home Improvement Loans
F) Non-occupant Loans on < 5 Family Dwellings (A B C & D)
Number
Average Value
Number
Average Value
Number
Average Value
Number
Average Value
Number
Average Value
LOANS ORIGINATED
13
$88,385
26
$57,206
13
$76,274
11
$6,305
3
$50,467
APPLICATIONS APPROVED, NOT ACCEPTED
1
$60,230
4
$37,322
5
$47,310
2
$13,640
0
$0
APPLICATIONS DENIED
3
$72,547
15
$32,409
26
$44,281
8
$8,234
1
$10,300
APPLICATIONS WITHDRAWN
2
$81,505
5
$42,352
11
$77,645
1
$27,280
1
$89,110
FILES CLOSED FOR INCOMPLETENESS
0
$0
1
$68,980
1
$59,720
0
$0
0
$0
Aggregated Statistics For Year 1999 (Based on 2 partial tracts)
A) FHA, FSA/RHS & VA Home Purchase Loans
B) Conventional Home Purchase Loans
C) Refinancings
D) Home Improvement Loans
F) Non-occupant Loans on < 5 Family Dwellings (A B C & D)
2002 - 2018 National Fire Incident Reporting System (NFIRS) incidents
Based on the data from the years 2002 - 2018 the average number of fires per year is 12. The highest number of fire incidents - 38 took place in 2015, and the least - 0 in 2003. The data has an increasing trend.
When looking into fire subcategories, the most incidents belonged to: Outside Fires (49.5%), and Structure Fires (29.0%).
Fire incident types reported to NFIRS in Zip Code 72327


+$364
-$5,941
 Nearest zip codes: 72325, 72332, 72331, 72364, 72376, 72301.


 Based on the data from the years 2002 - 2018 the average number of fires per year is 12. The highest number of fire incidents - 38 took place in 2015, and the least - 0 in 2003. The data has an increasing trend.
 When looking into fire subcategories, the most incidents belonged to: Outside Fires (49.5%), and Structure Fires (29.0%).