Estimated zip code population in 2022: 5,347 Zip code population in 2010: 5,783 Zip code population in 2000: 4,998
Houses and condos: 2,421 Renter-occupied apartments: 460
% of renters here:
22%
State:
34%
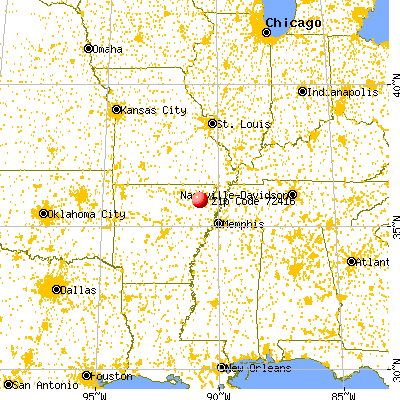
March 2022 cost of living index in zip code 72416: 78.8 (low, U.S. average is 100)
Land area: 92.9 sq. mi. Water area: 0.3 sq. mi.
Population density: 58 people per square mile
(very low).
OSM Map
General Map
Google Map
MSN Map
OSM Map
General Map
Google Map
MSN Map
OSM Map
General Map
Google Map
MSN Map
OSM Map
General Map
Google Map
MSN Map
Please wait while loading the map...
Real estate property taxes paid for housing units in 2022:
This zip code:
0.5% ($742)
Arkansas:
0.5% ($977)
Median real estate property taxes paid for housing units with mortgages in 2022: $723 (0.4%) Median real estate property taxes paid for housing units with no mortgage in 2022: $754 (0.4%)
Estimated median house/condo value in 2022: $163,746
72416:
$163,746
Arkansas:
$179,800
According to our research of Arkansas and other state lists, there were 4 registered sex offenders living in 72416 zip code as of June 07, 2024. The ratio of all residents to sex offenders in zip code 72416 is 1,503 to 1. The ratio of registered sex offenders to all residents in this zip code is much lower than the state average.
Median resident age:
This zip code:
36.7 years
Arkansas median age:
38.9 years
Average household size:
This zip code:
2.6 people
Arkansas:
2.4 people
Averages for the 2020 tax year for zip code 72416, filed in 2021:
Average Adjusted Gross Income (AGI) in 2020: $50,731 (Individual Income Tax Returns)
Here:
$50,731
State:
$64,872
Salary/wage: $46,253 (reported on 86.2% of returns)
Here:
$46,253
State:
$50,644
(% of AGI for various income ranges: 1304.3% for AGIs below $25k, 3837.5% for AGIs $25k-50k, 6346.7% for AGIs $50k-75k, 9212.4% for AGIs $75k-100k, 16469.4% for AGIs $100k-200k)
Taxable interest for individuals: $488 (reported on 20.2% of returns)
This zip code:
$488
Arkansas:
$1,857
(% of AGI for various income ranges: 2.6% for AGIs below $25k, 8.5% for AGIs $25k-50k, 15.2% for AGIs $50k-75k, 8.2% for AGIs $75k-100k, 57.5% for AGIs $100k-200k)
Ordinary dividends: $1,329 (reported on 5.7% of returns)
Here:
$1,329
State:
$21,681
(% of AGI for various income ranges: 4.7% for AGIs $25k-50k, 17.9% for AGIs $50k-75k, 17.1% for AGIs $75k-100k, 45.0% for AGIs $100k-200k)
Net capital gain/loss in AGI: +$6,200 (reported on 6.9% of returns)
Here:
+$6,200
State:
+$22,815
(% of AGI for various income ranges: 8.2% for AGIs $25k-50k, 13.3% for AGIs $50k-75k, 25.3% for AGIs $75k-100k, 576.2% for AGIs $100k-200k)
Profit/loss from business: +$8,350 (reported on 17.8% of returns)
Here:
+$8,350
State:
+$9,743
(% of AGI for various income ranges: 130.1% for AGIs below $25k, 132.0% for AGIs $25k-50k, 81.8% for AGIs $50k-75k, 242.4% for AGIs $75k-100k, 863.1% for AGIs $100k-200k)
Taxable individual retirement arrangement distribution: $15,250 (reported on 4.0% of returns)
72416:
$15,250
Arkansas:
$18,502
(% of AGI for various income ranges: 18.5% for AGIs below $25k, 33.3% for AGIs $25k-50k, 102.7% for AGIs $50k-75k, 515.9% for AGIs $75k-100k)
Total itemized deductions: $33,914 (reported on 2.8% of returns)
Here:
$33,914
State:
$52,840
(% of AGI for various income ranges: 239.4% for AGIs $50k-75k, 990.0% for AGIs $100k-200k)
Charity contributions: $9,383 (reported on 2.4% of returns)
Here:
$9,383
State:
$35,735
(% of AGI for various income ranges: 17.3% for AGIs $25k-50k, 292.5% for AGIs $100k-200k)
Taxes paid: $6,843 (reported on 2.8% of returns)
72416:
$6,843
State:
$7,196
(% of AGI for various income ranges: 33.0% for AGIs $50k-75k, 231.2% for AGIs $100k-200k)
Earned income credit: $2,562 (reported on 20.2% of returns)
Here:
$2,562
State:
$2,546
(% of AGI for various income ranges: 123.2% for AGIs below $25k, 80.5% for AGIs $25k-50k)
Percentage of individuals using paid preparers for their 2020 taxes: 95.5%
Here:
96%
State:
94%
(% for various income ranges: 95.3% for AGIs below $25k, 97.1% for AGIs $25k-50k, 95.1% for AGIs $50k-75k, 91.3% for AGIs $75k-100k, 96.2% for AGIs $100k-200k, 100.0% for AGIs over 200k)
Averages for the 2012 tax year for zip code 72416, filed in 2013:
Average Adjusted Gross Income (AGI) in 2012: $39,369 (Individual Income Tax Returns)
Here:
$39,369
State:
$52,148
Salary/wage: $36,306 (reported on 86.4% of returns)
Here:
$36,306
State:
$41,669
(% of AGI for various income ranges: 77.4% for AGIs below $25k, 86.6% for AGIs $25k-50k, 82.4% for AGIs $50k-75k, 81.0% for AGIs $75k-100k, 67.6% for AGIs $100k-200k)
Taxable interest for individuals: $671 (reported on 24.1% of returns)
This zip code:
$671
Arkansas:
$1,648
(% of AGI for various income ranges: 0.8% for AGIs below $25k, 0.4% for AGIs $25k-50k, 0.3% for AGIs $50k-75k, 0.2% for AGIs $75k-100k, 0.4% for AGIs $100k-200k)
Ordinary dividends: $1,000 (reported on 7.0% of returns)
Here:
$1,000
State:
$20,675
(% of AGI for various income ranges: 0.2% for AGIs below $25k, 0.3% for AGIs $25k-50k, 0.2% for AGIs $50k-75k, 0.1% for AGIs $100k-200k)
Net capital gain/loss in AGI: +$9,692 (reported on 5.7% of returns)
Here:
+$9,692
State:
+$15,222
(% of AGI for various income ranges: 0.1% for AGIs below $25k, 0.2% for AGIs $25k-50k, 1.1% for AGIs $50k-75k, 5.4% for AGIs $100k-200k)
Profit/loss from business: +$9,300 (reported on 16.7% of returns)
Here:
+$9,300
State:
+$9,665
(% of AGI for various income ranges: 10.7% for AGIs below $25k, 3.0% for AGIs $25k-50k, 1.9% for AGIs $50k-75k, 7.8% for AGIs $75k-100k)
Taxable individual retirement arrangement distribution: $12,258 (reported on 5.3% of returns)
72416:
$12,258
Arkansas:
$13,644
(% of AGI for various income ranges: 1.1% for AGIs below $25k, 0.9% for AGIs $25k-50k, 1.7% for AGIs $50k-75k, 5.5% for AGIs $75k-100k)
Total itemized deductions: $16,592 (21% of AGI, reported on 16.7% of returns)
Here:
$16,592
State:
$23,276
Here:
21.2% of AGI
State:
19.1% of AGI
(% of AGI for various income ranges: 3.7% for AGIs below $25k, 4.9% for AGIs $25k-50k, 6.6% for AGIs $50k-75k, 9.2% for AGIs $75k-100k, 11.1% for AGIs $100k-200k)
Charity contributions: $3,822 (reported on 11.8% of returns)
Here:
$3,822
State:
$5,996
(% of AGI for various income ranges: 0.8% for AGIs $25k-50k, 1.0% for AGIs $50k-75k, 1.7% for AGIs $75k-100k, 2.2% for AGIs $100k-200k)
Taxes paid: $4,897 (reported on 16.7% of returns)
72416:
$4,897
State:
$7,941
(% of AGI for various income ranges: 0.5% for AGIs below $25k, 0.9% for AGIs $25k-50k, 1.6% for AGIs $50k-75k, 2.8% for AGIs $75k-100k, 4.8% for AGIs $100k-200k)
Earned income credit: $2,392 (reported on 28.1% of returns)
Here:
$2,392
State:
$2,455
(% of AGI for various income ranges: 8.9% for AGIs below $25k, 1.7% for AGIs $25k-50k)
Percentage of individuals using paid preparers for their 2012 taxes: 65.4%
Here:
65%
State:
61%
(% for various income ranges: 63.9% for AGIs below $25k, 64.7% for AGIs $25k-50k, 68.6% for AGIs $50k-75k, 62.5% for AGIs $75k-100k, 75.0% for AGIs $100k-200k)
Averages for the 2004 tax year for zip code 72416, filed in 2005:
Average Adjusted Gross Income (AGI) in 2004: $31,326 (Individual Income Tax Returns)
Here:
$31,326
State:
$39,270
Salary/wage: $29,463 (reported on 87.3% of returns)
Here:
$29,463
State:
$34,079
(% of AGI for various income ranges: 108.0% for AGIs below $10k, 78.3% for AGIs $10k-25k, 84.7% for AGIs $25k-50k, 88.1% for AGIs $50k-75k, 74.2% for AGIs $75k-100k, 66.8% for AGIs over 100k)
Taxable interest for individuals: $841 (reported on 31.3% of returns)
This zip code:
$841
Arkansas:
$1,904
(% of AGI for various income ranges: 2.1% for AGIs below $10k, 1.0% for AGIs $10k-25k, 1.1% for AGIs $25k-50k, 0.4% for AGIs $50k-75k, 0.9% for AGIs $75k-100k, 0.5% for AGIs over 100k)
Taxable dividends: $1,155 (reported on 10.7% of returns)
Here:
$1,155
State:
$5,995
(% of AGI for various income ranges: 0.3% for AGIs below $10k, 0.4% for AGIs $10k-25k, 0.2% for AGIs $25k-50k, 0.2% for AGIs $50k-75k, 0.1% for AGIs $75k-100k, 1.9% for AGIs over 100k)
Net capital gain/loss: +$2,807 (reported on 8.4% of returns)
Here:
+$2,807
State:
+$10,430
(% of AGI for various income ranges: -0.7% for AGIs below $10k, 0.9% for AGIs $10k-25k, 0.6% for AGIs $25k-50k, 0.3% for AGIs $50k-75k, 1.0% for AGIs $75k-100k, 2.7% for AGIs over 100k)
Profit/loss from business: +$6,843 (reported on 18.0% of returns)
Here:
+$6,843
State:
+$7,823
(% of AGI for various income ranges: 21.4% for AGIs below $10k, 7.9% for AGIs $10k-25k, 3.1% for AGIs $25k-50k, 1.9% for AGIs $50k-75k, 4.1% for AGIs $75k-100k)
Profit/loss from farming: +$584 (reported on 3.8% of returns)
Here:
+$584
State:
-$5,941
(% of AGI for various income ranges: -13.6% for AGIs below $10k, 0.2% for AGIs $10k-25k, 0.2% for AGIs $25k-50k, 0.2% for AGIs $50k-75k, 1.9% for AGIs $75k-100k)
IRA payment deduction: $3,214 (reported on 2.7% of returns)
72416:
$3,214
Arkansas:
$3,204
Total itemized deductions: $14,367 (23% of AGI, reported on 18.0% of returns)
Here:
$14,367
State:
$18,389
Here:
23.3% of AGI
State:
21.0% of AGI
(% of AGI for various income ranges: 4.1% for AGIs $10k-25k, 6.2% for AGIs $25k-50k, 9.1% for AGIs $50k-75k, 14.0% for AGIs $75k-100k, 15.1% for AGIs over 100k)
Charity contributions deductions: $2,807 (4% of AGI, reported on 14.7% of returns)
Here:
$2,807
State:
$4,725
Here:
4.4% of AGI
State:
5.1% of AGI
(% of AGI for various income ranges: 0.7% for AGIs $10k-25k, 0.8% for AGIs $25k-50k, 1.4% for AGIs $50k-75k, 2.2% for AGIs $75k-100k, 3.1% for AGIs over 100k)
Total tax: $3,264 (reported on 71.6% of returns)
72416:
$3,264
State:
$6,047
(% of AGI for various income ranges: 4.7% for AGIs below $10k, 4.0% for AGIs $10k-25k, 5.5% for AGIs $25k-50k, 7.8% for AGIs $50k-75k, 11.4% for AGIs $75k-100k, 15.2% for AGIs over 100k)
Earned income credit: $1,762 (reported on 25.3% of returns)
Here:
$1,762
State:
$1,909
Percentage of individuals using paid preparers for their 2004 taxes: 67.9%
Here:
68%
State:
67%
(% for various income ranges: 58.0% for AGIs below $10k, 70.9% for AGIs $10k-25k, 71.7% for AGIs $25k-50k, 65.8% for AGIs $50k-75k, 66.3% for AGIs $75k-100k, 85.7% for AGIs over 100k)
Household received Food Stamps/SNAP in the past 12 months: 160 Household did not receive Food Stamps/SNAP in the past 12 months: 1,928
Women who had a birth in the past 12 months: 30 (31 now married, 0 unmarried) Women who did not have a birth in the past 12 months: 1,032 (606 now married, 428 unmarried)
Housing units in zip code 72416 with a mortgage: 966 (48 second mortgage, 46 both second mortgage and home equity loan) Houses without a mortgage: 33
Median monthly owner costs for units with a mortgage: $1,046 Median monthly owner costs for units without a mortgage: $381
Residents with income below the poverty level in 2022:
This zip code:
12.2%
Whole state:
16.8%
Residents with income below 50% of the poverty level in 2022:
This zip code:
6.3%
Whole state:
8.5%
Median number of rooms in houses and condos:
Here:
6.1
State:
6.1
Median number of rooms in apartments:
Here:
4.3
State:
4.3
Notable locations in this zip code not listed on our city pages
Notable locations in zip code 72416: Bono Fire Department Bono Station (A), Bono Fire Department Center Hill Station (B), Bono Police Department (C). Display/hide their locations on the map
Churches in zip code 72416 include: Bells Chapel Church (A), Bethel Church (B), Center Hill Church (C), Cross Road Church (D), Fontaine Baptist Church (E), Lorado Baptist Church (F), New Hope Church (G), Oak Ridge Church (H), Trinity Methodist Church (I). Display/hide their locations on the map
Cemeteries: Shady Grove Cemetery (1), Old Trinity Cemetery (2), Lorado Cemetery (3), Love Cemetery (4), Trinity Cemetery (5), New Hope Cemetery (6), Pleasant Hill Cemetery (7). Display/hide their locations on the map
Reservoirs: Big Creek Site 11 Reservoir (A), Big Creek Site 10 Reservoir (B), Big Creek Site Six Reservoir (C), Ralph Cox Pond (D), J L Craft Pond (E). Display/hide their locations on the map
Streams, rivers, and creeks: Negro Head Slough (A), Kirksey Creek (B), Cypress Slu (C), Trinity Branch (D), Davis Branch (E), Poplar Creek (F), Buffalo Head Slough (G), Rogers Branch (H), Rogers Bayou (I). Display/hide their locations on the map
Size of family households: 670 2-persons, 365 3-persons, 335 4-persons, 118 5-persons, 8 6-persons, 11 7-or-more-persons
Size of nonfamily households: 483 1-person, 67 2-persons
955 married couples with children.
449 single-parent households (262 men, 187 women).
97.8% of residents of 72416 zip code speak English at home.
0.6% of residents speak Spanish at home (93% very well, 7% not well).
1.3% of residents speak other Indo-European language at home (100% very well).
Foreign born population: 10 (0.2%) (70.7% of them are naturalized citizens)
This zip code:
0.2%
Whole state:
5.1%
90%Costa Rica
28%American
17%English
13%Irish
7%German
2%French
2%Scottish
1%European
Year of entry for the foreign-born population
32010 or later
72000 to 2009
01990 to 1999
31Before 1990
Facilities with environmental interests located in this zip code:
INBODEN BROTHERS, INC. (100 COTTON STREET in BONO, AR)
(Integrated Compliance Information System) - ICIS-06-1997-0481, FORMAL ENFORCEMENT ACTION COMPLIANCE ACTIVITY (Tracking inspections of insecticide, fungicide, and rodenticide, and toxic substances) STATE MASTER (PDS) - RST-16001671, FACILITY Business SIC classification: SOAP AND OTHER DETERGENTS, EXCEPT SPECIALTY CLEANERS; SPECIALTY CLEANING, POLISHING, AND SANITATION PREPARATIONS; CHEMICALS AND CHEMICAL PREPARATIONS Organizations: INBODEN, HOLLIS KIM (CONTACT/GENERAL)
Alternative names: BONO GIN, INC. D/B/A INBODEN BROS, INC., BONO GIN INCORPORATED DBA INBODEN BROTHERS INCORPORATED
SEMSTREAM L.P. (517 HIGHWAY 228 in BONO(LIGHT), AR)
(Integrated Compliance Information System) - ICIS-06-2006-3521, ENFORCEMENT/COMPLIANCE ACTIVITY FORMAL ENFORCEMENT ACTION (Integrated Compliance Information System) - ICIS-06-2006-3521, ENFORCEMENT/COMPLIANCE ACTIVITY
BONO, CITY OF (161 DOGPOUND RD (ALONG HWY 63) in BONO, AR)
National Pollutant Discharge Elimination System NON-MAJOR (Tracking pollutant discharge elimination systems) - permit STATE MASTER (PDS) - WATER-AR0020699, National Pollutant Discharge Elimination System Permit Business SIC classification: SEWERAGE SYSTEMS
C & L REFINERY (407 D GLENORE DRIVE in BONO, AR)
TRANSPORTER (Resource Conservation and Recovery Act (tracking hazardous waste)) - notification Organizations: JA LAMBERTH JR (CONTACT/OWNER)
JIMCO LAMP COMPANY (500 HWY 63 N in BONO, AR)
Conditionally Exempt Small Quantity Generators, less than 100 kg/month of hazardous waste (Resource Conservation and Recovery Act (tracking hazardous waste)) - notification Organizations: HUNT JAMES-D (CONTACT/OWNER)
Housing units lacking complete plumbing facilities: 8.4% Housing units lacking complete kitchen facilities: 8.1%
52.1%Electricity
32.5%Utility gas
6.9%Bottled, tank, or LP gas
5.2%Wood
3.4%No fuel used
Population in 1990: 3,030. Population change in the 1990s: +1,968 (+65.0%).
Place of birth for U.S.-born residents:
This state: 4,045
Northeast: 21
Midwest: 591
South: 473
West: 128
54% of the 72416 zip code residents lived in the same house 5 years ago. Out of people who lived in different houses, 66% lived in this county. Out of people who lived in different counties, 50% lived in Arkansas.
84% of the 72416 zip code residents lived in the same house 1 year ago. Out of people who lived in different houses, 50% moved from this county. Out of people who lived in different houses, 11% moved from different county within same state. Out of people who lived in different houses, 30% moved from different state. Out of people who lived in different houses, 6% moved from abroad.
Private vs. public school enrollment:
Students in private schools in grades 1 to 8 (elementary and middle school): 15
Here:
3.3%
Arkansas:
10.5%
Students in private schools in grades 9 to 12 (high school): 6
Here:
1.1%
Arkansas:
8.7%
Students in private undergraduate colleges: 14
Here:
11.0%
Arkansas:
19.4%
Occupation by median earnings in the past 12 months ($)
97,913Architecture and engineering occupations
89,308Production occupations
61,769Fire fighting and prevention, and other protective service workers including supervisors
58,717Business and financial operations occupations
56,619Health diagnosing and treating practitioners and other technical occupations
56,360Installation, maintenance, and repair occupations
Companies with federal contracts located in this zip code:
TOPO SOLUTIONS INC (5563 COUNTY ROAD 147 in BONO, AR; small business)
$3,800 with U.S. Army Corps of Engineers - civil program financing only for Drafting, Surveying, and Mapping Instruments. Signed on 2002-04-25. Completion date: 2002-05-14.
Top industries in this zip code by the number of employees in 2005:
Wholesale Trade: Home Furnishing Merchant Wholesalers (50-99 employees: 1 establishment)
Construction: Site Preparation Contractors (10-19: 1, 1-4: 1)
Construction: Other Heavy and Civil Engineering Construction (10-19: 1)
Other Services (except Public Administration): Religious Organizations (5-9: 1, 1-4: 1)
Construction: New Single-Family Housing Construction (except Operative Builders) (1-4: 4)
Fatal accident statistics in 2012:
Fatal accident count: 5
Vehicles involved in fatal accidents: 7
Fatal accidents caused by drunken drivers: 0
Fatalities: 5
Persons involved in fatal accidents: 8
Pedestrians involved in fatal accidents: 0
Fatal accident statistics in 2011:
Fatal accident count: 1
Vehicles involved in fatal accidents: 3
Fatal accidents caused by drunken drivers: 0
Fatalities: 2
Persons involved in fatal accidents: 4
Pedestrians involved in fatal accidents: 0
Home Mortgage Disclosure Act Aggregated Statistics For Year 2009 (Based on 4 partial tracts)
A) FHA, FSA/RHS & VA Home Purchase Loans
B) Conventional Home Purchase Loans
C) Refinancings
D) Home Improvement Loans
F) Non-occupant Loans on < 5 Family Dwellings (A B C & D)
G) Loans On Manufactured Home Dwelling (A B C & D)
Number
Average Value
Number
Average Value
Number
Average Value
Number
Average Value
Number
Average Value
Number
Average Value
LOANS ORIGINATED
39
$100,922
30
$95,473
75
$106,807
15
$29,669
27
$92,347
11
$33,315
APPLICATIONS APPROVED, NOT ACCEPTED
1
$105,580
1
$45,110
6
$72,250
1
$52,680
0
$0
2
$45,250
APPLICATIONS DENIED
4
$91,370
12
$65,115
31
$99,682
6
$18,043
5
$64,444
8
$39,860
APPLICATIONS WITHDRAWN
4
$95,048
3
$34,787
19
$110,298
1
$22,420
1
$75,620
1
$34,870
FILES CLOSED FOR INCOMPLETENESS
1
$129,900
1
$94,150
1
$195,120
0
$0
0
$0
0
$0
Aggregated Statistics For Year 2008 (Based on 4 partial tracts)
A) FHA, FSA/RHS & VA Home Purchase Loans
B) Conventional Home Purchase Loans
C) Refinancings
D) Home Improvement Loans
E) Loans on Dwellings For 5+ Families
F) Non-occupant Loans on < 5 Family Dwellings (A B C & D)
G) Loans On Manufactured Home Dwelling (A B C & D)
Number
Average Value
Number
Average Value
Number
Average Value
Number
Average Value
Number
Average Value
Number
Average Value
Number
Average Value
LOANS ORIGINATED
33
$99,021
26
$71,412
71
$89,280
13
$52,965
1
$310,920
32
$79,578
8
$43,252
APPLICATIONS APPROVED, NOT ACCEPTED
0
$0
2
$176,870
5
$75,900
1
$8,410
0
$0
1
$13,450
1
$78,930
APPLICATIONS DENIED
3
$97,183
12
$75,490
24
$112,705
13
$16,384
0
$0
4
$36,502
5
$43,814
APPLICATIONS WITHDRAWN
6
$87,340
4
$113,298
10
$131,893
1
$85,720
0
$0
1
$66,100
1
$61,400
FILES CLOSED FOR INCOMPLETENESS
1
$104,280
1
$41,010
2
$99,505
0
$0
0
$0
0
$0
0
$0
Aggregated Statistics For Year 2007 (Based on 4 partial tracts)
A) FHA, FSA/RHS & VA Home Purchase Loans
B) Conventional Home Purchase Loans
C) Refinancings
D) Home Improvement Loans
E) Loans on Dwellings For 5+ Families
F) Non-occupant Loans on < 5 Family Dwellings (A B C & D)
G) Loans On Manufactured Home Dwelling (A B C & D)
Number
Average Value
Number
Average Value
Number
Average Value
Number
Average Value
Number
Average Value
Number
Average Value
Number
Average Value
LOANS ORIGINATED
21
$96,656
56
$87,531
80
$98,088
14
$35,092
1
$629,530
31
$94,181
14
$44,843
APPLICATIONS APPROVED, NOT ACCEPTED
1
$101,170
4
$114,382
5
$91,850
1
$2,800
0
$0
0
$0
2
$54,505
APPLICATIONS DENIED
3
$81,797
18
$57,179
39
$90,185
10
$23,435
0
$0
3
$55,307
9
$32,517
APPLICATIONS WITHDRAWN
2
$104,115
6
$62,600
15
$89,949
2
$27,790
0
$0
1
$78,070
1
$97,690
FILES CLOSED FOR INCOMPLETENESS
0
$0
2
$101,815
3
$105,460
0
$0
0
$0
0
$0
0
$0
Aggregated Statistics For Year 2006 (Based on 4 partial tracts)
A) FHA, FSA/RHS & VA Home Purchase Loans
B) Conventional Home Purchase Loans
C) Refinancings
D) Home Improvement Loans
F) Non-occupant Loans on < 5 Family Dwellings (A B C & D)
G) Loans On Manufactured Home Dwelling (A B C & D)
Number
Average Value
Number
Average Value
Number
Average Value
Number
Average Value
Number
Average Value
Number
Average Value
LOANS ORIGINATED
17
$83,175
59
$80,063
78
$87,213
15
$29,594
38
$63,620
13
$33,653
APPLICATIONS APPROVED, NOT ACCEPTED
0
$0
6
$58,945
8
$79,915
1
$67,250
0
$0
3
$34,900
APPLICATIONS DENIED
2
$139,295
23
$57,389
34
$90,571
7
$22,067
5
$43,688
13
$44,250
APPLICATIONS WITHDRAWN
1
$90,910
7
$85,530
16
$108,454
2
$13,620
1
$62,200
2
$20,235
FILES CLOSED FOR INCOMPLETENESS
0
$0
0
$0
5
$113,354
1
$41,960
0
$0
0
$0
Aggregated Statistics For Year 2005 (Based on 4 partial tracts)
A) FHA, FSA/RHS & VA Home Purchase Loans
B) Conventional Home Purchase Loans
C) Refinancings
D) Home Improvement Loans
F) Non-occupant Loans on < 5 Family Dwellings (A B C & D)
G) Loans On Manufactured Home Dwelling (A B C & D)
Number
Average Value
Number
Average Value
Number
Average Value
Number
Average Value
Number
Average Value
Number
Average Value
LOANS ORIGINATED
17
$89,302
69
$73,016
85
$74,977
12
$19,166
27
$46,033
21
$43,467
APPLICATIONS APPROVED, NOT ACCEPTED
1
$50,700
7
$74,026
17
$85,580
1
$68,370
1
$50,770
3
$57,287
APPLICATIONS DENIED
2
$74,270
27
$63,689
51
$77,670
4
$39,788
2
$35,640
14
$35,299
APPLICATIONS WITHDRAWN
2
$112,955
9
$70,851
24
$97,879
1
$124,920
1
$30,820
2
$62,385
FILES CLOSED FOR INCOMPLETENESS
0
$0
0
$0
5
$97,500
0
$0
0
$0
0
$0
Aggregated Statistics For Year 2004 (Based on 4 partial tracts)
A) FHA, FSA/RHS & VA Home Purchase Loans
B) Conventional Home Purchase Loans
C) Refinancings
D) Home Improvement Loans
F) Non-occupant Loans on < 5 Family Dwellings (A B C & D)
G) Loans On Manufactured Home Dwelling (A B C & D)
Number
Average Value
Number
Average Value
Number
Average Value
Number
Average Value
Number
Average Value
Number
Average Value
LOANS ORIGINATED
32
$77,089
58
$77,889
108
$77,073
14
$28,710
25
$46,078
19
$47,330
APPLICATIONS APPROVED, NOT ACCEPTED
1
$53,240
7
$71,201
17
$72,691
0
$0
1
$57,160
4
$42,048
APPLICATIONS DENIED
3
$79,387
27
$59,571
51
$79,641
9
$36,298
3
$33,577
18
$35,146
APPLICATIONS WITHDRAWN
3
$67,303
6
$69,905
25
$95,396
1
$139,630
0
$0
1
$111,680
FILES CLOSED FOR INCOMPLETENESS
1
$67,250
1
$174,640
10
$81,337
0
$0
0
$0
1
$59,540
Aggregated Statistics For Year 2003 (Based on 4 partial tracts)
A) FHA, FSA/RHS & VA Home Purchase Loans
B) Conventional Home Purchase Loans
C) Refinancings
D) Home Improvement Loans
E) Loans on Dwellings For 5+ Families
F) Non-occupant Loans on < 5 Family Dwellings (A B C & D)
Number
Average Value
Number
Average Value
Number
Average Value
Number
Average Value
Number
Average Value
Number
Average Value
LOANS ORIGINATED
37
$84,202
58
$67,516
174
$81,415
15
$24,992
1
$782,320
30
$47,059
APPLICATIONS APPROVED, NOT ACCEPTED
1
$62,760
9
$71,066
19
$78,073
0
$0
0
$0
2
$22,975
APPLICATIONS DENIED
3
$64,870
23
$56,573
55
$69,360
4
$24,140
0
$0
2
$57,500
APPLICATIONS WITHDRAWN
3
$77,233
7
$71,750
22
$84,328
1
$4,850
0
$0
3
$53,227
FILES CLOSED FOR INCOMPLETENESS
0
$0
2
$71,125
5
$62,672
0
$0
0
$0
0
$0
Aggregated Statistics For Year 2002 (Based on 4 partial tracts)
A) FHA, FSA/RHS & VA Home Purchase Loans
B) Conventional Home Purchase Loans
C) Refinancings
D) Home Improvement Loans
F) Non-occupant Loans on < 5 Family Dwellings (A B C & D)
Number
Average Value
Number
Average Value
Number
Average Value
Number
Average Value
Number
Average Value
LOANS ORIGINATED
26
$66,751
59
$59,652
134
$81,090
10
$43,216
31
$47,337
APPLICATIONS APPROVED, NOT ACCEPTED
1
$21,300
6
$65,555
15
$62,744
2
$8,305
1
$25,770
APPLICATIONS DENIED
9
$62,032
17
$40,386
41
$66,403
5
$17,508
1
$19,610
APPLICATIONS WITHDRAWN
1
$100,070
6
$62,945
23
$84,246
0
$0
1
$19,040
FILES CLOSED FOR INCOMPLETENESS
1
$44,740
1
$29,140
8
$80,841
1
$5,600
1
$28,020
Aggregated Statistics For Year 2001 (Based on 4 partial tracts)
A) FHA, FSA/RHS & VA Home Purchase Loans
B) Conventional Home Purchase Loans
C) Refinancings
D) Home Improvement Loans
E) Loans on Dwellings For 5+ Families
F) Non-occupant Loans on < 5 Family Dwellings (A B C & D)
Number
Average Value
Number
Average Value
Number
Average Value
Number
Average Value
Number
Average Value
Number
Average Value
LOANS ORIGINATED
30
$72,660
64
$58,456
140
$68,126
23
$19,663
1
$825,360
29
$58,179
APPLICATIONS APPROVED, NOT ACCEPTED
1
$65,890
6
$36,315
9
$75,438
0
$0
0
$0
1
$49,320
APPLICATIONS DENIED
4
$64,585
22
$43,949
66
$56,025
7
$12,481
0
$0
5
$44,384
APPLICATIONS WITHDRAWN
1
$79,780
2
$60,055
29
$64,412
1
$14,000
0
$0
2
$78,980
FILES CLOSED FOR INCOMPLETENESS
0
$0
0
$0
4
$82,000
0
$0
0
$0
0
$0
Aggregated Statistics For Year 2000 (Based on 4 partial tracts)
A) FHA, FSA/RHS & VA Home Purchase Loans
B) Conventional Home Purchase Loans
C) Refinancings
D) Home Improvement Loans
F) Non-occupant Loans on < 5 Family Dwellings (A B C & D)
Number
Average Value
Number
Average Value
Number
Average Value
Number
Average Value
Number
Average Value
LOANS ORIGINATED
21
$64,207
70
$59,474
56
$50,028
38
$35,520
22
$41,684
APPLICATIONS APPROVED, NOT ACCEPTED
1
$29,450
8
$34,059
6
$56,598
3
$20,973
1
$33,980
APPLICATIONS DENIED
2
$72,520
35
$36,599
42
$46,529
12
$11,063
2
$30,610
APPLICATIONS WITHDRAWN
4
$63,785
6
$56,528
26
$63,439
1
$32,660
2
$83,285
FILES CLOSED FOR INCOMPLETENESS
1
$122,870
1
$43,690
5
$56,036
0
$0
0
$0
Aggregated Statistics For Year 1999 (Based on 2 partial tracts)
A) FHA, FSA/RHS & VA Home Purchase Loans
B) Conventional Home Purchase Loans
C) Refinancings
D) Home Improvement Loans
F) Non-occupant Loans on < 5 Family Dwellings (A B C & D)
Detailed PMIC statistics for the following Tracts:0007.00
, 0012.00
2004 - 2018 National Fire Incident Reporting System (NFIRS) incidents
According to the data from the years 2004 - 2018 the average number of fire incidents per year is 55. The highest number of reported fire incidents - 147 took place in 2010, and the least - 3 in 2004. The data has a growing trend.
When looking into fire subcategories, the most incidents belonged to: Outside Fires (57.4%), and Structure Fires (29.6%).
Fire incident types reported to NFIRS in Zip Code 72416


+$584
-$5,941
(% of AGI for various income ranges: -13.6% for AGIs below $10k, 0.2% for AGIs $10k-25k, 0.2% for AGIs $25k-50k, 0.2% for AGIs $50k-75k, 1.9% for AGIs $75k-100k)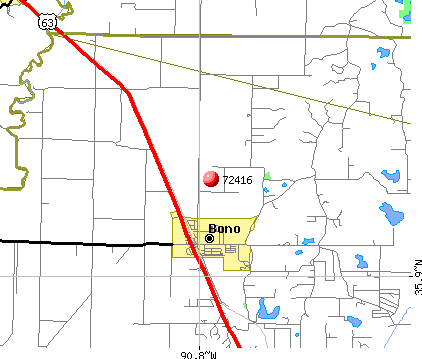 Nearest zip codes: 72476, 72401, 72427, 72467, 72412, 72404.


 According to the data from the years 2004 - 2018 the average number of fire incidents per year is 55. The highest number of reported fire incidents - 147 took place in 2010, and the least - 3 in 2004. The data has a growing trend.
 When looking into fire subcategories, the most incidents belonged to: Outside Fires (57.4%), and Structure Fires (29.6%).