Estimated zip code population in 2022: 508 Zip code population in 2010: 554 Zip code population in 2000: 553
Houses and condos: 209 Renter-occupied apartments: 60
% of renters here:
41%
State:
34%
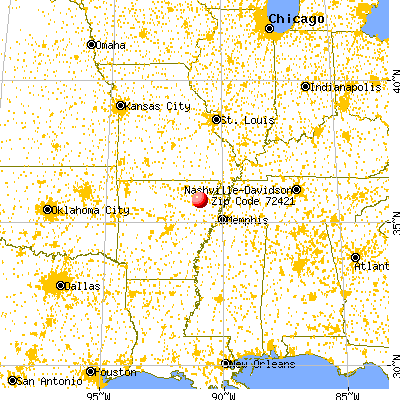
March 2022 cost of living index in zip code 72421: 77.5 (low, U.S. average is 100)
Land area: 76.0 sq. mi. Water area: 0.5 sq. mi.
Population density: 7 people per square mile
(very low).
OSM Map
General Map
Google Map
MSN Map
OSM Map
General Map
Google Map
MSN Map
OSM Map
General Map
Google Map
MSN Map
OSM Map
General Map
Google Map
MSN Map
Please wait while loading the map...
Real estate property taxes paid for housing units in 2022:
This zip code:
0.3% ($223)
Arkansas:
0.5% ($977)
Median real estate property taxes paid for housing units with mortgages in 2022: $312 (0.3%) Median real estate property taxes paid for housing units with no mortgage in 2022: $202 (0.3%)
Business Search- 14 Million verified businesses
Males: 306
(60.3%)
Females: 201
(39.7%)
For population 25 years and over in 72421:
High school or higher: 75.2%
Bachelor's degree or higher: 10.6%
Graduate or professional degree: 3.2%
Unemployed: 10.3%
Mean travel time to work (commute): 22.2 minutes
For population 15 years and over in 72421:
Never married: 35.1%
Now married: 50.1%
Separated: 2.6%
Widowed: 4.3%
Divorced: 7.8%
Zip code 72421 compared to state average:
Median household income below state average.
Median house value significantly below state average.
Unemployed percentage above state average.
Black race population percentage significantly below state average.
Hispanic race population percentage significantly below state average.
Median age below state average.
Foreign-born population percentage significantly below state average.
Length of stay since moving in significantly above state average.
Percentage of population with a bachelor's degree or higher significantly below state average.
Estimated median house/condo value in 2022: $64,436
72421:
$64,436
Arkansas:
$179,800
Median resident age:
This zip code:
32.3 years
Arkansas median age:
38.9 years
Average household size:
This zip code:
3.4 people
Arkansas:
2.4 people
Averages for the 2020 tax year for zip code 72421, filed in 2021:
Average Adjusted Gross Income (AGI) in 2020: $33,325 (Individual Income Tax Returns)
Here:
$33,325
State:
$64,872
Salary/wage: $31,737 (reported on 79.2% of returns)
Here:
$31,737
State:
$50,644
(% of AGI for various income ranges: 1257.1% for AGIs below $25k, 4843.3% for AGIs $25k-50k, 7480.0% for AGIs $50k-75k)
Taxable interest for individuals: $133 (reported on 12.5% of returns)
This zip code:
$133
Arkansas:
$1,857
(% of AGI for various income ranges: 5.7% for AGIs below $25k)
Profit/loss from business: +$1,833 (reported on 12.5% of returns)
Here:
+$1,833
State:
+$9,743
(% of AGI for various income ranges: 78.6% for AGIs below $25k)
Earned income credit: $2,550 (reported on 25.0% of returns)
Here:
$2,550
State:
$2,546
(% of AGI for various income ranges: 135.7% for AGIs below $25k, 96.7% for AGIs $25k-50k)
Percentage of individuals using paid preparers for their 2020 taxes: 91.7%
Here:
92%
State:
94%
(% for various income ranges: 90.9% for AGIs below $25k, 88.9% for AGIs $25k-50k, 100.0% for AGIs $50k-75k)
Averages for the 2012 tax year for zip code 72421, filed in 2013:
Average Adjusted Gross Income (AGI) in 2012: $40,750 (Individual Income Tax Returns)
Here:
$40,750
State:
$52,148
Salary/wage: $27,883 (reported on 81.8% of returns)
Here:
$27,883
State:
$41,669
(% of AGI for various income ranges: 78.3% for AGIs below $25k, 78.6% for AGIs $25k-50k, 141.4% for AGIs $50k-75k)
Taxable interest for individuals: $200 (reported on 22.7% of returns)
This zip code:
$200
Arkansas:
$1,648
Profit/loss from business: +$1,200 (reported on 13.6% of returns)
Here:
+$1,200
State:
+$9,665
Earned income credit: $2,429 (reported on 31.8% of returns)
Here:
$2,429
State:
$2,455
(% of AGI for various income ranges: 8.2% for AGIs below $25k, 2.2% for AGIs $25k-50k)
Percentage of individuals using paid preparers for their 2012 taxes: 86.4%
Here:
86%
State:
61%
(% for various income ranges: 81.8% for AGIs below $25k, 85.7% for AGIs $25k-50k, 200.0% for AGIs $50k-75k)
Averages for the 2004 tax year for zip code 72421, filed in 2005:
Average Adjusted Gross Income (AGI) in 2004: $27,266 (Individual Income Tax Returns)
Here:
$27,266
State:
$39,270
Salary/wage: $24,360 (reported on 78.4% of returns)
Here:
$24,360
State:
$34,079
(% of AGI for various income ranges: 256.3% for AGIs below $10k, 77.5% for AGIs $10k-25k, 80.3% for AGIs $25k-50k, 82.9% for AGIs $50k-75k)
Taxable interest for individuals: $705 (reported on 36.5% of returns)
This zip code:
$705
Arkansas:
$1,904
(% of AGI for various income ranges: 4.2% for AGIs below $10k, 2.1% for AGIs $10k-25k, 0.6% for AGIs $25k-50k, 1.0% for AGIs $50k-75k)
Taxable dividends: $222 (reported on 7.5% of returns)
Here:
$222
State:
$5,995
Net capital gain/loss: +$556 (reported on 7.5% of returns)
Here:
+$556
State:
+$10,430
Profit/loss from business: +$677 (reported on 12.9% of returns)
Here:
+$677
State:
+$7,823
Total itemized deductions: $11,969 (30% of AGI, reported on 13.3% of returns)
Here:
$11,969
State:
$18,389
Here:
29.7% of AGI
State:
21.0% of AGI
Charity contributions deductions: $1,091 (3% of AGI, reported on 9.1% of returns)
Here:
$1,091
State:
$4,725
Here:
2.5% of AGI
State:
5.1% of AGI
Total tax: $3,287 (reported on 68.0% of returns)
72421:
$3,287
State:
$6,047
(% of AGI for various income ranges: 8.5% for AGIs below $10k, 4.0% for AGIs $10k-25k, 6.9% for AGIs $25k-50k, 9.6% for AGIs $50k-75k, 15.8% for AGIs $75k-100k)
Earned income credit: $1,612 (reported on 20.3% of returns)
Here:
$1,612
State:
$1,909
Percentage of individuals using paid preparers for their 2004 taxes: 78.4%
Here:
78%
State:
67%
(% for various income ranges: 75.5% for AGIs below $10k, 78.3% for AGIs $10k-25k, 81.3% for AGIs $25k-50k, 108.3% for AGIs $50k-75k)
Household received Food Stamps/SNAP in the past 12 months: 29 Household did not receive Food Stamps/SNAP in the past 12 months: 119
Women who had a birth in the past 12 months: 2 (2 now married, 0 unmarried) Women who did not have a birth in the past 12 months: 99 (61 now married, 38 unmarried)
Housing units in zip code 72421 with a mortgage: 32 Median monthly owner costs for units with a mortgage: $710 Median monthly owner costs for units without a mortgage: $388
Residents with income below the poverty level in 2022:
This zip code:
31.9%
Whole state:
16.8%
Residents with income below 50% of the poverty level in 2022:
This zip code:
20.8%
Whole state:
8.5%
Median number of rooms in houses and condos:
Here:
6.1
State:
6.1
Median number of rooms in apartments:
Here:
6.5
State:
4.3
Notable locations in this zip code not listed on our city pages
Churches in zip code 72421 include: Chilson Chapel (A), Chilson Church (B), Earnest Chapel (C), Hickory Ridge Church (D), Little Texas Church (E), Red Church (F). Display/hide their locations on the map
Size of family households: 33 2-persons, 10 3-persons, 27 4-persons, 6 5-persons, 16 6-persons, 6 7-or-more-persons
Size of nonfamily households: 49 1-person
64 married couples with children.
52 single-parent households (45 men, 7 women).
98.4% of residents of 72421 zip code speak English at home.
0.8% of residents speak Asian or Pacific Island language at home (100% very well).
Foreign born population: 0 (0.0%)
:
0.0%
Whole state:
5.1%
35%American
13%Irish
4%English
4%German
Facilities with environmental interests located in this zip code:
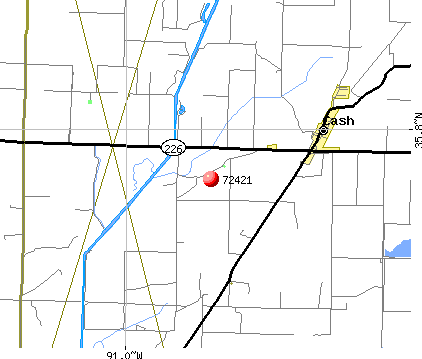
CASH, CITY OF-STP (1500FT W OF CHURCH OF CHRIST in CASH, AR)
National Pollutant Discharge Elimination System NON-MAJOR (Tracking pollutant discharge elimination systems) - permit Business SIC classification: SEWERAGE SYSTEMS Alternative names: CASH, CITY OF-WATER WORKS
Housing units lacking complete plumbing facilities: 3.9% Housing units lacking complete kitchen facilities: 2.5%
54.0%Utility gas
39.3%Electricity
7.0%Wood
0.7%No fuel used
Population in 1990: 628.
Place of birth for U.S.-born residents:
This state: 407
Northeast: 11
Midwest: 71
South: 12
65% of the 72421 zip code residents lived in the same house 5 years ago. Out of people who lived in different houses, 68% lived in this county. Out of people who lived in different counties, 50% lived in Arkansas.
88% of the 72421 zip code residents lived in the same house 1 year ago. Out of people who lived in different houses, 44% moved from this county. Out of people who lived in different houses, 51% moved from different county within same state.
Private vs. public school enrollment:
Students in private schools in grades 1 to 8 (elementary and middle school):
Here:
0.0%
Arkansas:
10.5%
Students in private schools in grades 9 to 12 (high school):
Here:
0.0%
Arkansas:
8.7%
Students in private undergraduate colleges: 2
Here:
10.8%
Arkansas:
19.4%
Occupation by median earnings in the past 12 months ($)
47,550Material moving occupations
45,155Construction and extraction occupations
37,358Education, training, and library occupations
34,191Office and administrative support occupations
27,580Production occupations
25,783Sales and related occupations
Companies with federal contracts located in this zip code:
FARLEY FISH FARM (OFF HWY 18 E in CASH, AR; small business)
$2,100 with Army for Forage and Feed. Taking place in KY. Signed on 2005-04-22. Completion date: 2005-04-27.
Top industries in this zip code by the number of employees in 2005:
Wholesale Trade: Grain and Field Bean Merchant Wholesalers (20-49 employees: 1 establishment)
Fatal accident statistics in 2012:
Fatal accident count: 1
Vehicles involved in fatal accidents: 3
Fatal accidents caused by drunken drivers: 0
Fatalities: 2
Persons involved in fatal accidents: 6
Pedestrians involved in fatal accidents: 0
Home Mortgage Disclosure Act Aggregated Statistics For Year 2009 (Based on 2 partial tracts)
A) FHA, FSA/RHS & VA Home Purchase Loans
B) Conventional Home Purchase Loans
C) Refinancings
D) Home Improvement Loans
F) Non-occupant Loans on < 5 Family Dwellings (A B C & D)
G) Loans On Manufactured Home Dwelling (A B C & D)
Number
Average Value
Number
Average Value
Number
Average Value
Number
Average Value
Number
Average Value
Number
Average Value
LOANS ORIGINATED
28
$101,459
19
$119,374
32
$100,955
8
$33,110
9
$111,329
6
$59,055
APPLICATIONS APPROVED, NOT ACCEPTED
1
$131,750
1
$83,900
1
$50,620
0
$0
1
$15,250
1
$83,900
APPLICATIONS DENIED
6
$93,840
6
$54,085
17
$109,394
2
$38,135
3
$111,177
4
$38,310
APPLICATIONS WITHDRAWN
3
$92,917
1
$51,310
11
$121,345
0
$0
1
$29,120
1
$51,310
FILES CLOSED FOR INCOMPLETENESS
1
$93,610
0
$0
1
$76,270
0
$0
0
$0
0
$0
Aggregated Statistics For Year 2008 (Based on 2 partial tracts)
A) FHA, FSA/RHS & VA Home Purchase Loans
B) Conventional Home Purchase Loans
C) Refinancings
D) Home Improvement Loans
E) Loans on Dwellings For 5+ Families
F) Non-occupant Loans on < 5 Family Dwellings (A B C & D)
G) Loans On Manufactured Home Dwelling (A B C & D)
Number
Average Value
Number
Average Value
Number
Average Value
Number
Average Value
Number
Average Value
Number
Average Value
Number
Average Value
LOANS ORIGINATED
28
$86,848
21
$80,567
38
$88,609
9
$35,287
1
$578,300
21
$67,557
3
$35,593
APPLICATIONS APPROVED, NOT ACCEPTED
1
$58,940
1
$49,230
1
$67,950
0
$0
0
$0
0
$0
1
$76,970
APPLICATIONS DENIED
4
$89,968
8
$71,334
10
$75,858
10
$12,620
0
$0
1
$54,780
6
$33,515
APPLICATIONS WITHDRAWN
3
$88,293
2
$157,750
6
$117,185
1
$20,800
0
$0
1
$20,800
1
$52,700
FILES CLOSED FOR INCOMPLETENESS
1
$122,040
1
$76,270
1
$105,400
0
$0
0
$0
0
$0
0
$0
Aggregated Statistics For Year 2007 (Based on 2 partial tracts)
A) FHA, FSA/RHS & VA Home Purchase Loans
B) Conventional Home Purchase Loans
C) Refinancings
D) Home Improvement Loans
E) Loans on Dwellings For 5+ Families
F) Non-occupant Loans on < 5 Family Dwellings (A B C & D)
G) Loans On Manufactured Home Dwelling (A B C & D)
Number
Average Value
Number
Average Value
Number
Average Value
Number
Average Value
Number
Average Value
Number
Average Value
Number
Average Value
LOANS ORIGINATED
18
$89,526
34
$102,358
40
$109,696
6
$52,583
1
$794,640
19
$123,316
6
$59,632
APPLICATIONS APPROVED, NOT ACCEPTED
1
$69,340
3
$146,770
3
$81,127
0
$0
0
$0
0
$0
1
$69,340
APPLICATIONS DENIED
2
$108,865
11
$47,907
18
$73,038
3
$25,423
0
$0
3
$42,760
6
$36,172
APPLICATIONS WITHDRAWN
1
$48,540
4
$93,090
8
$83,468
1
$78,350
0
$0
1
$7,630
1
$7,630
FILES CLOSED FOR INCOMPLETENESS
1
$55,470
2
$71,075
1
$52,700
0
$0
0
$0
0
$0
0
$0
Aggregated Statistics For Year 2006 (Based on 2 partial tracts)
A) FHA, FSA/RHS & VA Home Purchase Loans
B) Conventional Home Purchase Loans
C) Refinancings
D) Home Improvement Loans
F) Non-occupant Loans on < 5 Family Dwellings (A B C & D)
G) Loans On Manufactured Home Dwelling (A B C & D)
Number
Average Value
Number
Average Value
Number
Average Value
Number
Average Value
Number
Average Value
Number
Average Value
LOANS ORIGINATED
15
$81,035
33
$80,266
49
$84,382
6
$16,873
24
$87,426
6
$26,697
APPLICATIONS APPROVED, NOT ACCEPTED
0
$0
6
$45,187
6
$67,375
0
$0
1
$20,800
3
$28,430
APPLICATIONS DENIED
1
$97,080
16
$49,925
21
$107,312
6
$28,430
3
$33,283
11
$37,192
APPLICATIONS WITHDRAWN
1
$51,310
4
$78,528
10
$155,668
2
$14,910
1
$2,080
2
$27,735
FILES CLOSED FOR INCOMPLETENESS
0
$0
1
$28,430
2
$154,975
1
$62,410
0
$0
0
$0
Aggregated Statistics For Year 2005 (Based on 2 partial tracts)
A) FHA, FSA/RHS & VA Home Purchase Loans
B) Conventional Home Purchase Loans
C) Refinancings
D) Home Improvement Loans
F) Non-occupant Loans on < 5 Family Dwellings (A B C & D)
G) Loans On Manufactured Home Dwelling (A B C & D)
Number
Average Value
Number
Average Value
Number
Average Value
Number
Average Value
Number
Average Value
Number
Average Value
LOANS ORIGINATED
15
$85,889
34
$73,582
40
$65,388
7
$18,524
13
$43,364
9
$25,579
APPLICATIONS APPROVED, NOT ACCEPTED
1
$94,300
8
$61,452
10
$75,373
0
$0
1
$31,900
6
$53,277
APPLICATIONS DENIED
2
$66,220
17
$61,835
28
$72,832
0
$0
1
$70,030
7
$34,373
APPLICATIONS WITHDRAWN
1
$101,240
3
$74,657
12
$88,755
1
$41,600
0
$0
1
$11,090
FILES CLOSED FOR INCOMPLETENESS
0
$0
1
$22,880
1
$41,600
0
$0
0
$0
0
$0
Aggregated Statistics For Year 2004 (Based on 2 partial tracts)
A) FHA, FSA/RHS & VA Home Purchase Loans
B) Conventional Home Purchase Loans
C) Refinancings
D) Home Improvement Loans
F) Non-occupant Loans on < 5 Family Dwellings (A B C & D)
G) Loans On Manufactured Home Dwelling (A B C & D)
Number
Average Value
Number
Average Value
Number
Average Value
Number
Average Value
Number
Average Value
Number
Average Value
LOANS ORIGINATED
26
$69,873
31
$77,750
58
$71,229
9
$41,604
18
$46,535
10
$46,874
APPLICATIONS APPROVED, NOT ACCEPTED
0
$0
3
$101,237
9
$83,054
0
$0
0
$0
2
$51,660
APPLICATIONS DENIED
2
$84,940
15
$60,326
22
$90,867
6
$32,475
3
$40,217
12
$31,954
APPLICATIONS WITHDRAWN
1
$20,110
2
$51,310
12
$78,932
1
$84,590
0
$0
1
$22,190
FILES CLOSED FOR INCOMPLETENESS
0
$0
1
$174,740
4
$70,728
0
$0
0
$0
1
$45,070
Aggregated Statistics For Year 2003 (Based on 2 partial tracts)
A) FHA, FSA/RHS & VA Home Purchase Loans
B) Conventional Home Purchase Loans
C) Refinancings
D) Home Improvement Loans
F) Non-occupant Loans on < 5 Family Dwellings (A B C & D)
Number
Average Value
Number
Average Value
Number
Average Value
Number
Average Value
Number
Average Value
LOANS ORIGINATED
39
$86,871
27
$64,229
94
$80,434
6
$30,393
15
$46,504
APPLICATIONS APPROVED, NOT ACCEPTED
0
$0
3
$111,637
9
$71,806
0
$0
0
$0
APPLICATIONS DENIED
3
$63,330
15
$36,473
26
$69,447
1
$15,950
1
$59,630
APPLICATIONS WITHDRAWN
3
$87,370
6
$62,407
11
$80,308
1
$6,930
2
$14,560
FILES CLOSED FOR INCOMPLETENESS
0
$0
1
$79,050
1
$74,190
0
$0
0
$0
Aggregated Statistics For Year 2002 (Based on 2 partial tracts)
A) FHA, FSA/RHS & VA Home Purchase Loans
B) Conventional Home Purchase Loans
C) Refinancings
D) Home Improvement Loans
E) Loans on Dwellings For 5+ Families
F) Non-occupant Loans on < 5 Family Dwellings (A B C & D)
Number
Average Value
Number
Average Value
Number
Average Value
Number
Average Value
Number
Average Value
Number
Average Value
LOANS ORIGINATED
15
$67,121
34
$68,096
53
$69,732
3
$27,503
1
$6,930
15
$45,903
APPLICATIONS APPROVED, NOT ACCEPTED
0
$0
1
$58,250
10
$59,563
1
$11,090
0
$0
1
$6,240
APPLICATIONS DENIED
3
$69,570
9
$28,276
21
$57,486
3
$20,570
0
$0
0
$0
APPLICATIONS WITHDRAWN
1
$46,460
4
$90,142
14
$70,925
0
$0
0
$0
1
$8,320
FILES CLOSED FOR INCOMPLETENESS
1
$83,210
0
$0
6
$49,693
0
$0
0
$0
0
$0
Aggregated Statistics For Year 2001 (Based on 2 partial tracts)
A) FHA, FSA/RHS & VA Home Purchase Loans
B) Conventional Home Purchase Loans
C) Refinancings
D) Home Improvement Loans
E) Loans on Dwellings For 5+ Families
F) Non-occupant Loans on < 5 Family Dwellings (A B C & D)
Number
Average Value
Number
Average Value
Number
Average Value
Number
Average Value
Number
Average Value
Number
Average Value
LOANS ORIGINATED
18
$70,342
32
$66,675
72
$67,597
10
$15,532
1
$901,420
19
$67,734
APPLICATIONS APPROVED, NOT ACCEPTED
1
$46,460
2
$45,765
3
$76,967
0
$0
0
$0
0
$0
APPLICATIONS DENIED
0
$0
8
$39,784
30
$44,794
4
$11,960
0
$0
0
$0
APPLICATIONS WITHDRAWN
2
$74,195
3
$53,623
17
$69,544
1
$10,400
0
$0
1
$66,570
FILES CLOSED FOR INCOMPLETENESS
0
$0
0
$0
3
$113,717
0
$0
0
$0
0
$0
Aggregated Statistics For Year 2000 (Based on 2 partial tracts)
A) FHA, FSA/RHS & VA Home Purchase Loans
B) Conventional Home Purchase Loans
C) Refinancings
D) Home Improvement Loans
E) Loans on Dwellings For 5+ Families
F) Non-occupant Loans on < 5 Family Dwellings (A B C & D)
Number
Average Value
Number
Average Value
Number
Average Value
Number
Average Value
Number
Average Value
Number
Average Value
LOANS ORIGINATED
12
$65,931
44
$62,705
24
$42,702
22
$23,954
1
$42,990
15
$40,541
APPLICATIONS APPROVED, NOT ACCEPTED
1
$54,780
5
$44,238
3
$56,627
2
$12,135
0
$0
1
$13,170
APPLICATIONS DENIED
1
$91,530
29
$37,013
18
$39,216
6
$7,973
0
$0
2
$23,575
APPLICATIONS WITHDRAWN
3
$61,943
6
$62,407
9
$56,551
1
$24,270
0
$0
1
$49,230
FILES CLOSED FOR INCOMPLETENESS
1
$40,910
1
$20,800
3
$60,787
0
$0
0
$0
1
$4,160
Aggregated Statistics For Year 1999 (Based on 1 partial tract)
A) FHA, FSA/RHS & VA Home Purchase Loans
B) Conventional Home Purchase Loans
C) Refinancings
D) Home Improvement Loans
F) Non-occupant Loans on < 5 Family Dwellings (A B C & D)
Detailed PMIC statistics for the following Tracts:0012.00
2002 - 2018 National Fire Incident Reporting System (NFIRS) incidents
According to the data from the years 2002 - 2018 the average number of fire incidents per year is 15. The highest number of reported fire incidents - 40 took place in 2006, and the least - 0 in 2003. The data has a growing trend.
When looking into fire subcategories, the most incidents belonged to: Outside Fires (63.9%), and Structure Fires (21.0%).
Fire incident types reported to NFIRS in Zip Code 72421


 Nearest zip codes: 72427, 72471, 72479, 72431, 72404, 72410.


 According to the data from the years 2002 - 2018 the average number of fire incidents per year is 15. The highest number of reported fire incidents - 40 took place in 2006, and the least - 0 in 2003. The data has a growing trend.
 When looking into fire subcategories, the most incidents belonged to: Outside Fires (63.9%), and Structure Fires (21.0%).