Estimated zip code population in 2022: 2,444 Zip code population in 2010: 2,234 Zip code population in 2000: 2,350
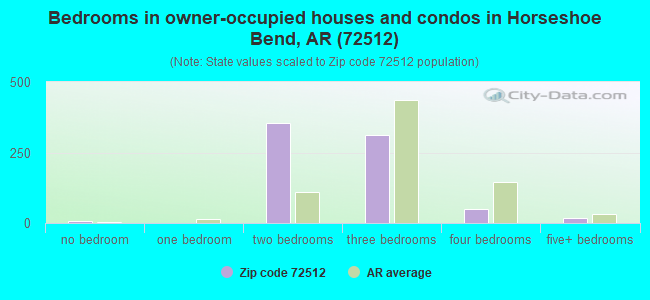
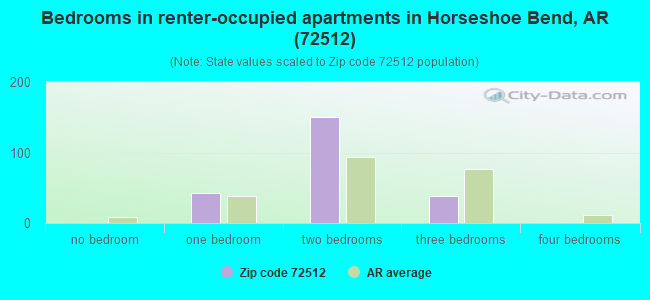
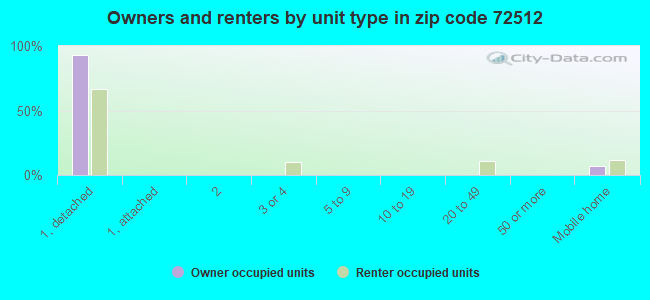
Houses and condos: 1,191 Renter-occupied apartments: 189
% of renters here:
20%
State:
34%
March 2022 cost of living index in zip code 72512: 78.3 (low, U.S. average is 100)
Land area: 21.9 sq. mi. Water area: 1.3 sq. mi.
Population density: 112 people per square mile
(very low).
OSM Map
General Map
Google Map
MSN Map
OSM Map
General Map
Google Map
MSN Map
OSM Map
General Map
Google Map
MSN Map
OSM Map
General Map
Google Map
MSN Map
Please wait while loading the map...
Real estate property taxes paid for housing units in 2022:
This zip code:
0.5% ($596)
Arkansas:
0.5% ($977)
Median real estate property taxes paid for housing units with mortgages in 2022: $582 (0.5%) Median real estate property taxes paid for housing units with no mortgage in 2022: $620 (0.5%)
Averages for the 2020 tax year for zip code 72512, filed in 2021:
Average Adjusted Gross Income (AGI) in 2020: $37,602 (Individual Income Tax Returns)
Here:
$37,602
State:
$64,872
Salary/wage: $30,962 (reported on 67.4% of returns)
Here:
$30,962
State:
$50,644
(% of AGI for various income ranges: 944.4% for AGIs below $25k, 2789.4% for AGIs $25k-50k, 5161.7% for AGIs $50k-75k, 7485.0% for AGIs $75k-100k, 12746.7% for AGIs $100k-200k)
Taxable interest for individuals: $1,361 (reported on 26.7% of returns)
This zip code:
$1,361
Arkansas:
$1,857
(% of AGI for various income ranges: 16.9% for AGIs below $25k, 77.2% for AGIs $25k-50k, 61.7% for AGIs $50k-75k, 47.5% for AGIs $75k-100k, 213.3% for AGIs $100k-200k)
Ordinary dividends: $2,545 (reported on 12.8% of returns)
Here:
$2,545
State:
$21,681
(% of AGI for various income ranges: 17.5% for AGIs below $25k, 86.7% for AGIs $25k-50k, 170.0% for AGIs $75k-100k)
Net capital gain/loss in AGI: +$2,600 (reported on 11.6% of returns)
Here:
+$2,600
State:
+$22,815
(% of AGI for various income ranges: 13.4% for AGIs below $25k, 100.6% for AGIs $25k-50k, 90.0% for AGIs $75k-100k)
Profit/loss from business: +$7,870 (reported on 11.6% of returns)
Here:
+$7,870
State:
+$9,743
(% of AGI for various income ranges: 120.6% for AGIs below $25k, 222.8% for AGIs $25k-50k)
Taxable individual retirement arrangement distribution: $10,918 (reported on 12.8% of returns)
72512:
$10,918
Arkansas:
$18,502
(% of AGI for various income ranges: 84.1% for AGIs below $25k, 306.7% for AGIs $25k-50k, 950.0% for AGIs $75k-100k)
Earned income credit: $2,559 (reported on 25.6% of returns)
Here:
$2,559
State:
$2,546
(% of AGI for various income ranges: 114.1% for AGIs below $25k, 110.0% for AGIs $25k-50k)
Percentage of individuals using paid preparers for their 2020 taxes: 91.9%
Here:
92%
State:
94%
(% for various income ranges: 90.5% for AGIs below $25k, 91.7% for AGIs $25k-50k, 88.9% for AGIs $50k-75k, 100.0% for AGIs $75k-100k, 100.0% for AGIs $100k-200k)
Averages for the 2012 tax year for zip code 72512, filed in 2013:
Average Adjusted Gross Income (AGI) in 2012: $33,469 (Individual Income Tax Returns)
Here:
$33,469
State:
$52,148
Salary/wage: $23,521 (reported on 62.7% of returns)
Here:
$23,521
State:
$41,669
(% of AGI for various income ranges: 57.2% for AGIs below $25k, 48.1% for AGIs $25k-50k, 57.3% for AGIs $50k-75k, 37.6% for AGIs $100k-200k)
Taxable interest for individuals: $1,379 (reported on 37.3% of returns)
This zip code:
$1,379
Arkansas:
$1,648
(% of AGI for various income ranges: 2.3% for AGIs below $25k, 1.9% for AGIs $25k-50k, 1.8% for AGIs $50k-75k, 0.8% for AGIs $75k-100k, 0.5% for AGIs $100k-200k)
Ordinary dividends: $3,135 (reported on 22.7% of returns)
Here:
$3,135
State:
$20,675
(% of AGI for various income ranges: 2.8% for AGIs below $25k, 1.1% for AGIs $25k-50k, 3.8% for AGIs $50k-75k, 4.4% for AGIs $75k-100k)
Net capital gain/loss in AGI: +$320 (reported on 13.3% of returns)
Here:
+$320
State:
+$15,222
(% of AGI for various income ranges: 0.3% for AGIs $50k-75k, 2.0% for AGIs $75k-100k)
Profit/loss from business: +$5,140 (reported on 13.3% of returns)
Here:
+$5,140
State:
+$9,665
Taxable individual retirement arrangement distribution: $11,119 (reported on 21.3% of returns)
72512:
$11,119
Arkansas:
$13,644
(% of AGI for various income ranges: 6.3% for AGIs below $25k, 6.3% for AGIs $25k-50k, 6.9% for AGIs $50k-75k, 23.9% for AGIs $75k-100k)
Total itemized deductions: $17,362 (29% of AGI, reported on 17.3% of returns)
Here:
$17,362
State:
$23,276
Here:
29.0% of AGI
State:
19.1% of AGI
(% of AGI for various income ranges: 8.8% for AGIs below $25k, 9.3% for AGIs $25k-50k, 11.4% for AGIs $50k-75k, 11.4% for AGIs $100k-200k)
Charity contributions: $3,620 (reported on 13.3% of returns)
Here:
$3,620
State:
$5,996
(% of AGI for various income ranges: 2.1% for AGIs $25k-50k, 1.9% for AGIs $50k-75k, 2.4% for AGIs $100k-200k)
Taxes paid: $3,731 (reported on 17.3% of returns)
72512:
$3,731
State:
$7,941
(% of AGI for various income ranges: 0.8% for AGIs below $25k, 1.5% for AGIs $25k-50k, 2.4% for AGIs $50k-75k, 4.2% for AGIs $100k-200k)
Earned income credit: $2,240 (reported on 26.7% of returns)
Here:
$2,240
State:
$2,455
(% of AGI for various income ranges: 7.1% for AGIs below $25k, 1.1% for AGIs $25k-50k)
Percentage of individuals using paid preparers for their 2012 taxes: 58.7%
Here:
59%
State:
61%
(% for various income ranges: 51.2% for AGIs below $25k, 63.2% for AGIs $25k-50k, 62.5% for AGIs $50k-75k, 100.0% for AGIs $75k-100k, 75.0% for AGIs $100k-200k)
Averages for the 2004 tax year for zip code 72512, filed in 2005:
Average Adjusted Gross Income (AGI) in 2004: $27,079 (Individual Income Tax Returns)
Here:
$27,079
State:
$39,270
Salary/wage: $21,282 (reported on 56.1% of returns)
Here:
$21,282
State:
$34,079
(% of AGI for various income ranges: 82.4% for AGIs below $10k, 39.9% for AGIs $10k-25k, 44.1% for AGIs $25k-50k, 40.9% for AGIs $50k-75k, 49.1% for AGIs $75k-100k, 42.6% for AGIs over 100k)
Taxable interest for individuals: $2,332 (reported on 53.3% of returns)
This zip code:
$2,332
Arkansas:
$1,904
(% of AGI for various income ranges: 9.3% for AGIs below $10k, 6.3% for AGIs $10k-25k, 5.0% for AGIs $25k-50k, 3.5% for AGIs $50k-75k, 1.8% for AGIs $75k-100k, 3.0% for AGIs over 100k)
Taxable dividends: $3,186 (reported on 31.1% of returns)
Here:
$3,186
State:
$5,995
(% of AGI for various income ranges: 4.8% for AGIs below $10k, 3.6% for AGIs $10k-25k, 3.2% for AGIs $25k-50k, 4.0% for AGIs $50k-75k, 1.2% for AGIs $75k-100k, 5.6% for AGIs over 100k)
Net capital gain/loss: +$2,145 (reported on 24.6% of returns)
Here:
+$2,145
State:
+$10,430
(% of AGI for various income ranges: -0.9% for AGIs below $10k, 0.7% for AGIs $10k-25k, 1.8% for AGIs $25k-50k, 0.4% for AGIs $50k-75k, 13.0% for AGIs $75k-100k)
Profit/loss from business: +$3,179 (reported on 15.1% of returns)
Here:
+$3,179
State:
+$7,823
(% of AGI for various income ranges: 10.9% for AGIs below $10k, 2.5% for AGIs $10k-25k, 1.6% for AGIs $25k-50k, 1.5% for AGIs $50k-75k)
Profit/loss from farming: +$2,455 (reported on 1.4% of returns)
Here:
+$2,455
State:
-$5,941
IRA payment deduction: $2,273 (reported on 1.4% of returns)
72512:
$2,273
Arkansas:
$3,204
Total itemized deductions: $14,056 (27% of AGI, reported on 17.6% of returns)
Here:
$14,056
State:
$18,389
Here:
26.8% of AGI
State:
21.0% of AGI
(% of AGI for various income ranges: 7.8% for AGIs $10k-25k, 10.1% for AGIs $25k-50k, 10.5% for AGIs $50k-75k, 8.8% for AGIs $75k-100k, 9.6% for AGIs over 100k)
Charity contributions deductions: $3,395 (6% of AGI, reported on 15.2% of returns)
Here:
$3,395
State:
$4,725
Here:
6.3% of AGI
State:
5.1% of AGI
(% of AGI for various income ranges: 1.7% for AGIs $10k-25k, 1.9% for AGIs $25k-50k, 2.7% for AGIs $50k-75k, 2.9% for AGIs over 100k)
Total tax: $2,991 (reported on 67.4% of returns)
72512:
$2,991
State:
$6,047
(% of AGI for various income ranges: 2.6% for AGIs below $10k, 2.8% for AGIs $10k-25k, 5.8% for AGIs $25k-50k, 8.9% for AGIs $50k-75k, 10.9% for AGIs $75k-100k, 15.8% for AGIs over 100k)
Earned income credit: $1,550 (reported on 19.7% of returns)
Here:
$1,550
State:
$1,909
Percentage of individuals using paid preparers for their 2004 taxes: 66.7%
Here:
67%
State:
67%
(% for various income ranges: 61.7% for AGIs below $10k, 63.9% for AGIs $10k-25k, 72.3% for AGIs $25k-50k, 66.2% for AGIs $50k-75k, 95.7% for AGIs $75k-100k, 75.0% for AGIs over 100k)
Household received Food Stamps/SNAP in the past 12 months: 135 Household did not receive Food Stamps/SNAP in the past 12 months: 800
Women who had a birth in the past 12 months: 27 (28 now married, 0 unmarried) Women who did not have a birth in the past 12 months: 398 (164 now married, 234 unmarried)
Housing units in zip code 72512 with a mortgage: 346 (21 second mortgage, 20 both second mortgage and home equity loan) Houses without a mortgage: 7
Median monthly owner costs for units with a mortgage: $751 Median monthly owner costs for units without a mortgage: $448
Residents with income below the poverty level in 2022:
This zip code:
24.4%
Whole state:
16.8%
Residents with income below 50% of the poverty level in 2022:
This zip code:
17.3%
Whole state:
8.5%
Median number of rooms in houses and condos:
Here:
6.1
State:
6.1
Median number of rooms in apartments:
Here:
4.1
State:
4.3
Notable locations in this zip code not listed on our city pages
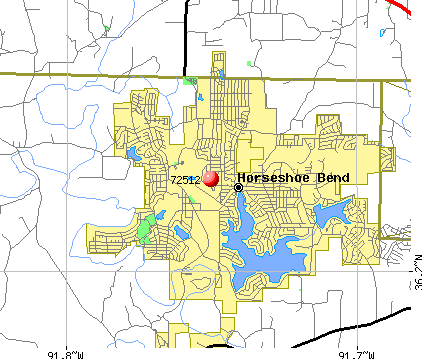
Notable locations in zip code 72512: Horseshoe Bend Volunteer Fire Department (A), Horseshoe Bend Police Department (B), Arkansas Emergency Transport - Horse Shoe Bend (C). Display/hide their locations on the map
Reservoirs: Bass Lake (A), North Lake (B), Lodge Lake (C), Crown Lake (D), White Oak Lake (E), Cedar Glade Lake (F), Lake Pioneer (G), Diamond Lake (H). Display/hide their locations on the map
In group quarters: 37 (-1 institutionalized population)
Size of family households: 368 2-persons, 95 3-persons, 90 4-persons, 29 5-persons
Size of nonfamily households: 320 1-person, 39 2-persons
247 married couples with children.
71 single-parent households (71 women).
98.7% of residents of 72512 zip code speak English at home.
0.8% of residents speak Spanish at home (72% very well, 28% well).
0.2% of residents speak other Indo-European language at home (50% very well, 50% well).
0.2% of residents speak Asian or Pacific Island language at home (100% very well).
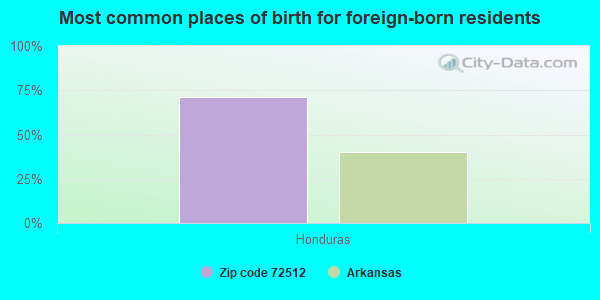
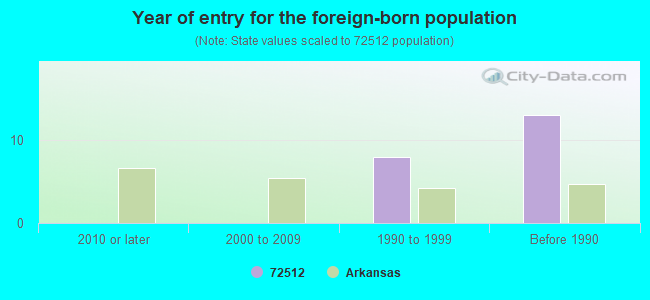
Foreign born population: 7 (0.3%) (14.7% of them are naturalized citizens)
This zip code:
0.3%
Whole state:
5.1%
71%Honduras
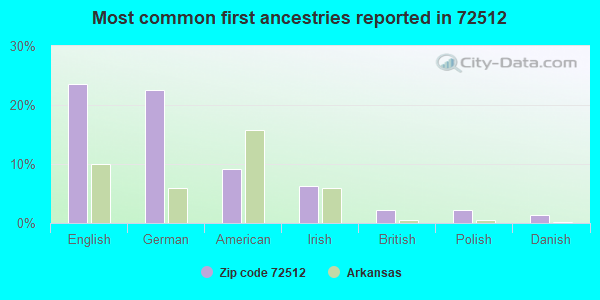
24%English
23%German
9%American
6%Irish
2%British
2%Polish
1%Danish
Year of entry for the foreign-born population
02010 or later
02000 to 2009
81990 to 1999
13Before 1990
Facilities with environmental interests located in this zip code:
GENE WILLIAMS ENTERPRISES (W & W BUILDING in HORSESHOE BEND, AR)
(Resource Conservation and Recovery Act (tracking hazardous waste)) Business NAICS classification: MOTION PICTURE THEATERS (EXCEPT DRIVE-INS).
ACE PARTNERSHIP (HIGHWAY 65 WEST in MYRON, AR)
AIR MINOR (AIRS/AFS) Business SIC classification: ASPHALT PAVING MIXTURES AND BLOCKS Alternative names: ACE PARTNERSHIP - MARK H LAMBERTH
Housing units lacking complete plumbing facilities: 0.3% Housing units lacking complete kitchen facilities: 2.7%
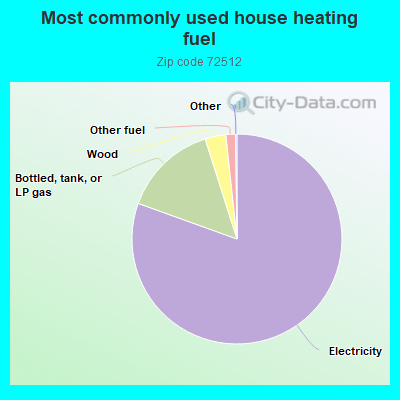
80.6%Electricity
14.6%Bottled, tank, or LP gas
3.2%Wood
1.5%Other fuel
Population in 1990: 3,088.
Place of birth for U.S.-born residents:
This state: 827
Northeast: 75
Midwest: 628
South: 620
West: 293
51% of the 72512 zip code residents lived in the same house 5 years ago. Out of people who lived in different houses, 29% lived in this county. Out of people who lived in different counties, 50% lived in Arkansas.
83% of the 72512 zip code residents lived in the same house 1 year ago. Out of people who lived in different houses, 21% moved from this county. Out of people who lived in different houses, 33% moved from different county within same state. Out of people who lived in different houses, 54% moved from different state.
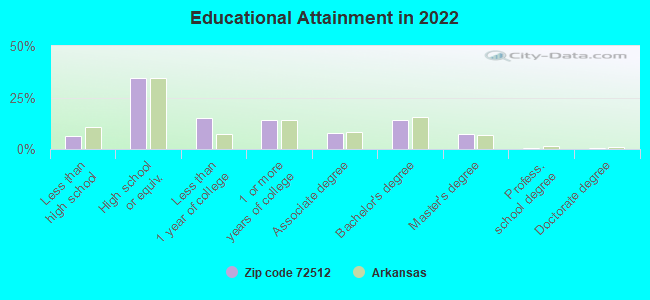
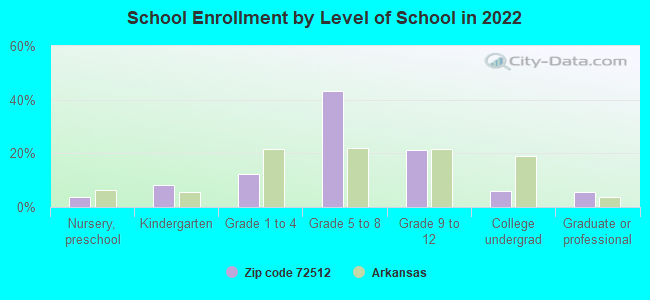
Private vs. public school enrollment:
Students in private schools in grades 1 to 8 (elementary and middle school): 52
Here:
30.7%
Arkansas:
10.5%
Students in private schools in grades 9 to 12 (high school):
Here:
0.0%
Arkansas:
8.7%
Students in private undergraduate colleges:
Here:
0.0%
Arkansas:
19.4%
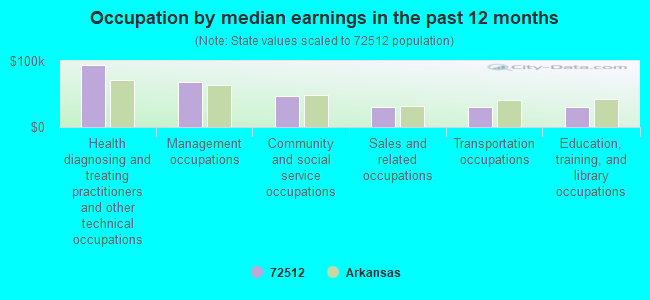
Occupation by median earnings in the past 12 months ($)
93,701Health diagnosing and treating practitioners and other technical occupations
67,822Management occupations
47,550Community and social service occupations
30,513Sales and related occupations
30,346Transportation occupations
29,963Education, training, and library occupations
Companies with federal contracts located in this zip code:
CORBIN, CHESTER R (1412 RANCHVIEW LN in HORSESHOE BEND, AR; small business) : $17,610 in 3 contractsfrom 2005 to 2006
$6,300 with Army for Operation of Government-Owned Facilities -- Recreation Facilities (Non-Building). Signed on 2006-02-10. Completion date: 2005-11-01.
$5,655, same as above.Signed on 2005-02-01. Completion date: 2005-11-01.
$5,655 with U.S. Army Corps of Engineers - civil program financing only for Operation of Government-Owned Facilities -- Recreation Facilities (Non-Building). Signed on 2005-02-01. Completion date: 2005-11-01.
Top industries in this zip code by the number of employees in 2005:
Health Care and Social Assistance: Continuing Care Retirement Communities (50-99 employees: 1 establishment)
Real Estate and Rental and Leasing: Offices of Real Estate Agents and Brokers (20-49: 1)
Other Services (except Public Administration): Civic and Social Organizations (10-19: 1, 5-9: 1)
Other Services (except Public Administration): Religious Organizations (5-9: 1, 1-4: 6)
Accommodation and Food Services: Hotels (except Casino Hotels) and Motels (10-19: 1)
Accommodation and Food Services: Full-Service Restaurants (5-9: 1, 1-4: 2)
Finance and Insurance: Commercial Banking (5-9: 1, 1-4: 1)
People in group quarters in 2010:
42 people in nursing facilities/skilled-nursing facilities
People in group quarters in 2000:
51 people in nursing homes
Fatal accident statistics in 2013:
Fatal accident count: 1
Vehicles involved in fatal accidents: 2
Fatal accidents caused by drunken drivers: 0
Fatalities: 1
Persons involved in fatal accidents: 4
Pedestrians involved in fatal accidents: 0
Fatal accident statistics in 2011:
Fatal accident count: 1
Vehicles involved in fatal accidents: 1
Fatal accidents caused by drunken drivers: 0
Fatalities: 1
Persons involved in fatal accidents: 2
Pedestrians involved in fatal accidents: 0
2004 - 2018 National Fire Incident Reporting System (NFIRS) incidents
Based on the data from the years 2004 - 2018 the average number of fires per year is 27. The highest number of reported fire incidents - 51 took place in 2016, and the least - 11 in 2008. The data has an increasing trend.
When looking into fire subcategories, the most reports belonged to: Outside Fires (45.7%), and Other (31.1%).
Fire incident types reported to NFIRS in Zip Code 72512


+$2,455
-$5,941
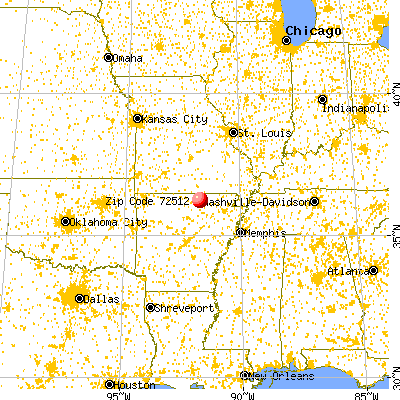
 Nearest zip codes: 72587, 72536, 72513, 72539, 72584, 72573.


 Based on the data from the years 2004 - 2018 the average number of fires per year is 27. The highest number of reported fire incidents - 51 took place in 2016, and the least - 11 in 2008. The data has an increasing trend.
 When looking into fire subcategories, the most reports belonged to: Outside Fires (45.7%), and Other (31.1%).