Estimated zip code population in 2022: 1,796 Zip code population in 2010: 1,936 Zip code population in 2000: 2,000
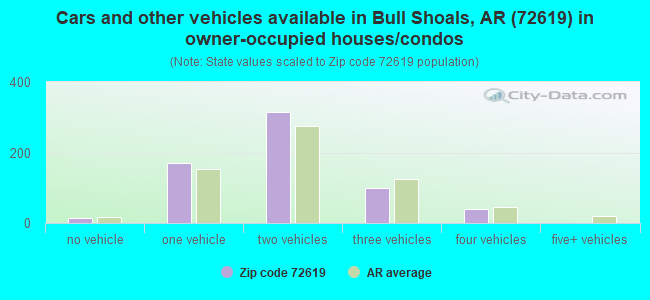
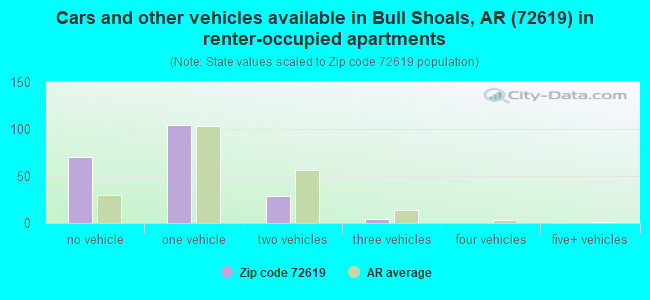
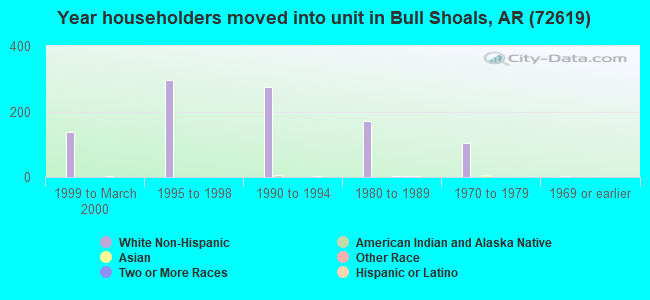
Houses and condos: 1,247 Renter-occupied apartments: 199
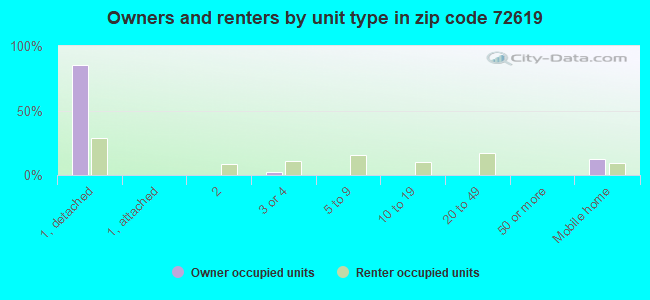
% of renters here:
24%
State:
34%
March 2022 cost of living index in zip code 72619: 78.9 (low, U.S. average is 100)
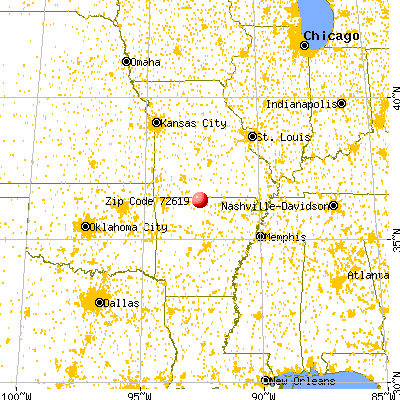
Land area: 4.6 sq. mi. Water area: 2.2 sq. mi.
Population density: 387 people per square mile
(very low).
OSM Map
General Map
Google Map
MSN Map
OSM Map
General Map
Google Map
MSN Map
OSM Map
General Map
Google Map
MSN Map
OSM Map
General Map
Google Map
MSN Map
Please wait while loading the map...
Real estate property taxes paid for housing units in 2022:
This zip code:
0.7% ($1,131)
Arkansas:
0.5% ($977)
Median real estate property taxes paid for housing units with mortgages in 2022: $1,372 (0.7%) Median real estate property taxes paid for housing units with no mortgage in 2022: $823 (0.6%)
Averages for the 2020 tax year for zip code 72619, filed in 2021:
Average Adjusted Gross Income (AGI) in 2020: $42,900 (Individual Income Tax Returns)
Here:
$42,900
State:
$64,872
Salary/wage: $33,565 (reported on 63.5% of returns)
Here:
$33,565
State:
$50,644
(% of AGI for various income ranges: 1103.8% for AGIs below $25k, 3061.3% for AGIs $25k-50k, 5290.0% for AGIs $50k-75k, 5787.5% for AGIs $75k-100k, 12935.0% for AGIs $100k-200k)
Taxable interest for individuals: $1,080 (reported on 35.3% of returns)
This zip code:
$1,080
Arkansas:
$1,857
(% of AGI for various income ranges: 29.6% for AGIs below $25k, 50.0% for AGIs $25k-50k, 68.3% for AGIs $50k-75k, 37.5% for AGIs $75k-100k, 290.0% for AGIs $100k-200k)
Ordinary dividends: $3,050 (reported on 21.2% of returns)
Here:
$3,050
State:
$21,681
(% of AGI for various income ranges: 31.9% for AGIs below $25k, 115.3% for AGIs $25k-50k, 132.5% for AGIs $75k-100k, 600.0% for AGIs $100k-200k)
Net capital gain/loss in AGI: +$3,894 (reported on 18.8% of returns)
Here:
+$3,894
State:
+$22,815
(% of AGI for various income ranges: 116.7% for AGIs $25k-50k, 252.5% for AGIs $75k-100k, 902.5% for AGIs $100k-200k)
Profit/loss from business: +$3,450 (reported on 11.8% of returns)
Here:
+$3,450
State:
+$9,743
(% of AGI for various income ranges: 123.8% for AGIs below $25k, 38.3% for AGIs $50k-75k)
Taxable individual retirement arrangement distribution: $15,447 (reported on 17.6% of returns)
72619:
$15,447
Arkansas:
$18,502
(% of AGI for various income ranges: 154.2% for AGIs below $25k, 268.7% for AGIs $25k-50k, 811.7% for AGIs $50k-75k, 2565.0% for AGIs $100k-200k)
Earned income credit: $2,079 (reported on 22.4% of returns)
Here:
$2,079
State:
$2,546
(% of AGI for various income ranges: 107.3% for AGIs below $25k, 77.3% for AGIs $25k-50k)
Percentage of individuals using paid preparers for their 2020 taxes: 90.6%
Here:
91%
State:
94%
(% for various income ranges: 89.5% for AGIs below $25k, 90.9% for AGIs $25k-50k, 90.0% for AGIs $50k-75k, 100.0% for AGIs $75k-100k, 88.9% for AGIs $100k-200k)
Averages for the 2012 tax year for zip code 72619, filed in 2013:
Average Adjusted Gross Income (AGI) in 2012: $36,131 (Individual Income Tax Returns)
Here:
$36,131
State:
$52,148
Salary/wage: $25,290 (reported on 60.0% of returns)
Here:
$25,290
State:
$41,669
(% of AGI for various income ranges: 56.1% for AGIs below $25k, 45.8% for AGIs $25k-50k, 48.1% for AGIs $50k-75k, 34.5% for AGIs $75k-100k, 24.9% for AGIs $100k-200k)
Taxable interest for individuals: $1,150 (reported on 45.0% of returns)
This zip code:
$1,150
Arkansas:
$1,648
(% of AGI for various income ranges: 3.1% for AGIs below $25k, 1.2% for AGIs $25k-50k, 1.3% for AGIs $50k-75k, 0.9% for AGIs $75k-100k, 0.8% for AGIs $100k-200k)
Ordinary dividends: $2,682 (reported on 27.5% of returns)
Here:
$2,682
State:
$20,675
(% of AGI for various income ranges: 1.9% for AGIs below $25k, 2.1% for AGIs $25k-50k, 1.9% for AGIs $50k-75k, 1.8% for AGIs $75k-100k, 2.3% for AGIs $100k-200k)
Net capital gain/loss in AGI: +$2,088 (reported on 21.2% of returns)
Here:
+$2,088
State:
+$15,222
(% of AGI for various income ranges: 0.5% for AGIs $50k-75k, 6.4% for AGIs $100k-200k)
Profit/loss from business: +$4,342 (reported on 15.0% of returns)
Here:
+$4,342
State:
+$9,665
(% of AGI for various income ranges: 6.9% for AGIs below $25k, 0.6% for AGIs $25k-50k, 2.0% for AGIs $50k-75k)
Taxable individual retirement arrangement distribution: $12,220 (reported on 25.0% of returns)
72619:
$12,220
Arkansas:
$13,644
(% of AGI for various income ranges: 7.0% for AGIs below $25k, 7.8% for AGIs $25k-50k, 6.5% for AGIs $50k-75k, 26.8% for AGIs $75k-100k)
Total itemized deductions: $18,918 (31% of AGI, reported on 21.2% of returns)
Here:
$18,918
State:
$23,276
Here:
30.7% of AGI
State:
19.1% of AGI
(% of AGI for various income ranges: 11.9% for AGIs below $25k, 10.2% for AGIs $25k-50k, 17.1% for AGIs $50k-75k, 13.2% for AGIs $100k-200k)
Charity contributions: $2,923 (reported on 16.2% of returns)
Here:
$2,923
State:
$5,996
(% of AGI for various income ranges: 1.0% for AGIs below $25k, 1.3% for AGIs $25k-50k, 2.0% for AGIs $50k-75k, 1.8% for AGIs $100k-200k)
Taxes paid: $4,119 (reported on 20.0% of returns)
72619:
$4,119
State:
$7,941
(% of AGI for various income ranges: 1.6% for AGIs below $25k, 1.5% for AGIs $25k-50k, 3.7% for AGIs $50k-75k, 3.8% for AGIs $100k-200k)
Earned income credit: $1,794 (reported on 22.5% of returns)
Here:
$1,794
State:
$2,455
(% of AGI for various income ranges: 5.0% for AGIs below $25k, 0.9% for AGIs $25k-50k)
Percentage of individuals using paid preparers for their 2012 taxes: 61.3%
Here:
61%
State:
61%
(% for various income ranges: 56.1% for AGIs below $25k, 60.0% for AGIs $25k-50k, 60.0% for AGIs $50k-75k, 80.0% for AGIs $75k-100k, 100.0% for AGIs $100k-200k)
Averages for the 2004 tax year for zip code 72619, filed in 2005:
Average Adjusted Gross Income (AGI) in 2004: $30,646 (Individual Income Tax Returns)
Here:
$30,646
State:
$39,270
Salary/wage: $21,534 (reported on 61.0% of returns)
Here:
$21,534
State:
$34,079
(% of AGI for various income ranges: 93.4% for AGIs below $10k, 47.4% for AGIs $10k-25k, 53.5% for AGIs $25k-50k, 39.2% for AGIs $50k-75k, 27.0% for AGIs $75k-100k, 29.0% for AGIs over 100k)
Taxable interest for individuals: $2,862 (reported on 56.6% of returns)
This zip code:
$2,862
Arkansas:
$1,904
(% of AGI for various income ranges: 15.6% for AGIs below $10k, 5.6% for AGIs $10k-25k, 4.9% for AGIs $25k-50k, 2.3% for AGIs $50k-75k, 3.8% for AGIs $75k-100k, 7.7% for AGIs over 100k)
Taxable dividends: $2,011 (reported on 32.9% of returns)
Here:
$2,011
State:
$5,995
(% of AGI for various income ranges: 9.0% for AGIs below $10k, 2.5% for AGIs $10k-25k, 1.7% for AGIs $25k-50k, 1.9% for AGIs $50k-75k, 2.4% for AGIs $75k-100k, 1.9% for AGIs over 100k)
Net capital gain/loss: +$4,996 (reported on 27.8% of returns)
Here:
+$4,996
State:
+$10,430
(% of AGI for various income ranges: -4.7% for AGIs below $10k, 0.1% for AGIs $10k-25k, 3.9% for AGIs $25k-50k, 0.6% for AGIs $50k-75k, 6.1% for AGIs $75k-100k, 13.0% for AGIs over 100k)
Profit/loss from business: +$4,647 (reported on 18.1% of returns)
Here:
+$4,647
State:
+$7,823
(% of AGI for various income ranges: 20.1% for AGIs below $10k, 8.2% for AGIs $10k-25k, 3.4% for AGIs $25k-50k, -1.4% for AGIs $50k-75k)
IRA payment deduction: $3,333 (reported on 4.0% of returns)
72619:
$3,333
Arkansas:
$3,204
Total itemized deductions: $16,720 (27% of AGI, reported on 19.4% of returns)
Here:
$16,720
State:
$18,389
Here:
27.3% of AGI
State:
21.0% of AGI
(% of AGI for various income ranges: 24.4% for AGIs below $10k, 9.5% for AGIs $10k-25k, 9.1% for AGIs $25k-50k, 9.1% for AGIs $50k-75k, 11.7% for AGIs $75k-100k, 13.0% for AGIs over 100k)
Charity contributions deductions: $2,364 (4% of AGI, reported on 15.5% of returns)
Here:
$2,364
State:
$4,725
Here:
3.5% of AGI
State:
5.1% of AGI
(% of AGI for various income ranges: 1.2% for AGIs $10k-25k, 1.1% for AGIs $25k-50k, 1.4% for AGIs $50k-75k, 1.5% for AGIs $75k-100k, 1.1% for AGIs over 100k)
Total tax: $3,422 (reported on 70.5% of returns)
72619:
$3,422
State:
$6,047
(% of AGI for various income ranges: 4.5% for AGIs below $10k, 3.8% for AGIs $10k-25k, 6.7% for AGIs $25k-50k, 9.0% for AGIs $50k-75k, 11.1% for AGIs $75k-100k, 11.1% for AGIs over 100k)
Earned income credit: $1,489 (reported on 17.0% of returns)
Here:
$1,489
State:
$1,909
Percentage of individuals using paid preparers for their 2004 taxes: 74.9%
Here:
75%
State:
67%
(% for various income ranges: 69.3% for AGIs below $10k, 72.2% for AGIs $10k-25k, 81.2% for AGIs $25k-50k, 78.9% for AGIs $50k-75k, 72.4% for AGIs $75k-100k, 86.2% for AGIs over 100k)
Household received Food Stamps/SNAP in the past 12 months: 51 Household did not receive Food Stamps/SNAP in the past 12 months: 784
Women who had a birth in the past 12 months: 22 (12 now married, 10 unmarried) Women who did not have a birth in the past 12 months: 261 (147 now married, 114 unmarried)
Housing units in zip code 72619 with a mortgage: 305 (15 second mortgage, 14 both second mortgage and home equity loan) Median monthly owner costs for units with a mortgage: $1,076 Median monthly owner costs for units without a mortgage: $366
Residents with income below the poverty level in 2022:
This zip code:
5.8%
Whole state:
16.8%
Residents with income below 50% of the poverty level in 2022:
This zip code:
3.6%
Whole state:
8.5%
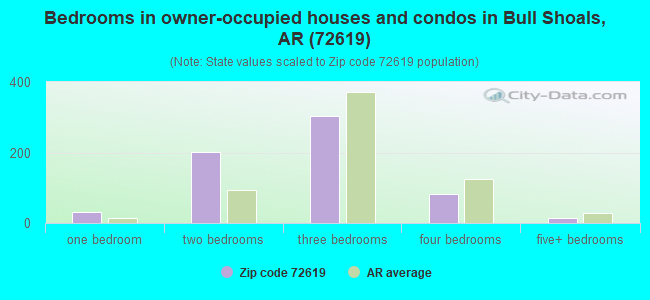
Median number of rooms in houses and condos:
Here:
5.7
State:
6.1
Median number of rooms in apartments:
Here:
3.6
State:
4.3
Notable locations in this zip code not listed on our city pages
Notable locations in zip code 72619: Bull Shoals Volunteer Fire Department Station (A), Bull Shoals Police Department (B). Display/hide their locations on the map
Parks in zip code 72619 include: Bull Shoals Natural Park (1), Point Return Public Use Area (2), Bull Shoals Public Use Area (3). Display/hide their locations on the map
In group quarters: 2 (-1 institutionalized population)
Size of family households: 268 2-persons, 71 3-persons, 43 4-persons, 37 5-persons, 13 6-persons
Size of nonfamily households: 361 1-person, 41 2-persons, 3 3-persons
184 married couples with children.
51 single-parent households (21 men, 30 women).
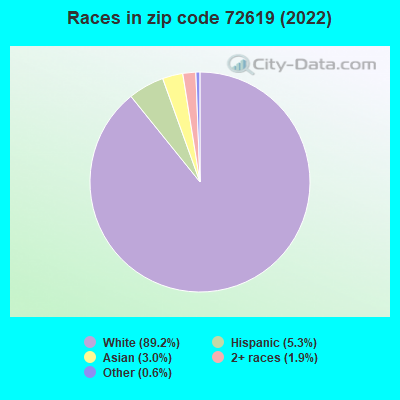
97.0% of residents of 72619 zip code speak English at home.
0.2% of residents speak Spanish at home (100% very well).
0.9% of residents speak other Indo-European language at home (100% very well).
1.7% of residents speak Asian or Pacific Island language at home (10% very well, 38% well, 52% not well).
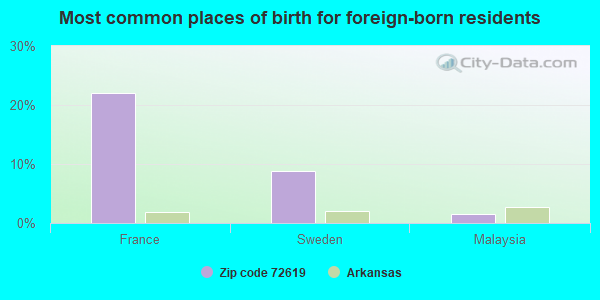
Foreign born population: 68 (3.8%) (24.5% of them are naturalized citizens)
This zip code:
3.8%
Whole state:
5.1%
22%France
9%Sweden
1%Malaysia
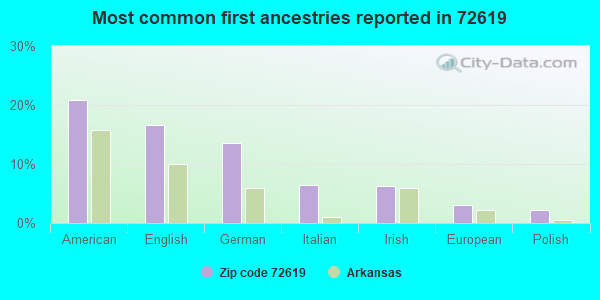
21%American
17%English
14%German
7%Italian
6%Irish
3%European
2%Polish
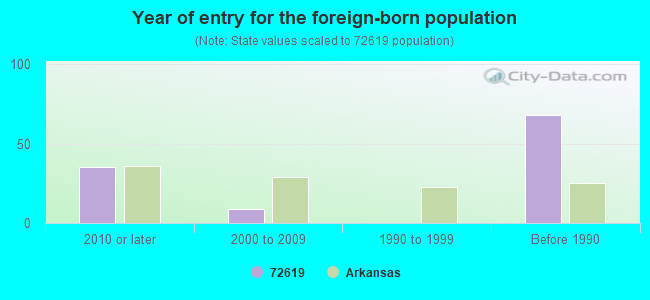
Year of entry for the foreign-born population
352010 or later
92000 to 2009
01990 to 1999
68Before 1990
Facilities with environmental interests located in this zip code:
BULL SHOALS, CITY OF (AR0037028) WWTP (258 GOLF COURSE ROAD in BULL SHOALS, AR)
ENFORCEMENT/COMPLIANCE ACTIVITY (Integrated Compliance Information System) National Pollutant Discharge Elimination System NON-MAJOR (Tracking pollutant discharge elimination systems) - permit National Pollutant Discharge Elimination System NON-MAJOR (Tracking pollutant discharge elimination systems) - permit Business SIC classification: SEWERAGE SYSTEMS Alternative names: CITY OF BULL SHOALS, CITY OF BULL SHOALS WWTP
1801 C.S. WOODS DRIVE SITE (1801 C.S. WOODS DR. in BULL SHOALS, AR)
National Pollutant Discharge Elimination System NON-MAJOR (Tracking pollutant discharge elimination systems) - permit Business SIC classification: MANAGEMENT SERVICES Alternative names: DR. K.L. DAVENPORT
CANE ISLAND SUBDIVISION (COUNTY ROAD 7001 in BULL SHOALS, AR)
National Pollutant Discharge Elimination System NON-MAJOR (Tracking pollutant discharge elimination systems) - permit Business SIC classification: MANAGEMENT SERVICES Alternative names: MCCRACKEN HAMES DEVELOPMENT
Housing units lacking complete plumbing facilities: 2.4% Housing units lacking complete kitchen facilities: 4.4%
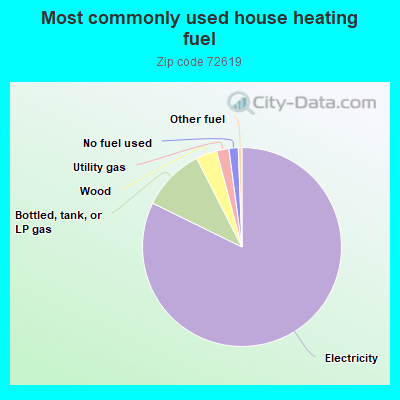
82.1%Electricity
10.2%Bottled, tank, or LP gas
3.4%Wood
2.0%Utility gas
1.5%No fuel used
0.6%Other fuel
Population in 1990: 1,967. Population change in the 1990s: +33 (+1.7%).
Place of birth for U.S.-born residents:
This state: 546
Northeast: 80
Midwest: 679
South: 239
West: 152
65% of the 72619 zip code residents lived in the same house 5 years ago. Out of people who lived in different houses, 28% lived in this county. Out of people who lived in different counties, 50% lived in Arkansas.
83% of the 72619 zip code residents lived in the same house 1 year ago. Out of people who lived in different houses, 26% moved from this county. Out of people who lived in different houses, 21% moved from different county within same state. Out of people who lived in different houses, 46% moved from different state. Out of people who lived in different houses, 13% moved from abroad.
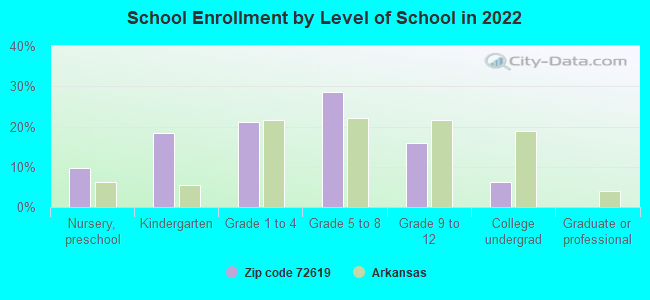
Private vs. public school enrollment:
Students in private schools in grades 1 to 8 (elementary and middle school):
Here:
0.0%
Arkansas:
10.5%
Students in private schools in grades 9 to 12 (high school):
Here:
0.0%
Arkansas:
8.7%
Students in private undergraduate colleges: 7
Here:
48.9%
Arkansas:
19.4%
Occupation by median earnings in the past 12 months ($)
215,047Healthcare support occupations
71,590Management occupations
49,472Installation, maintenance, and repair occupations
28,366Health diagnosing and treating practitioners and other technical occupations
27,912Office and administrative support occupations
25,875Sales and related occupations
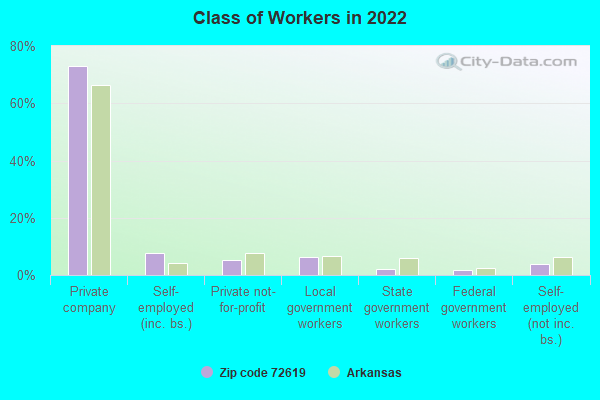
Top industries in this zip code by the number of employees in 2005:
Arts, Entertainment, and Recreation: Marinas (20-49: 1, 1-4: 1)
Accommodation and Food Services: Hotels (except Casino Hotels) and Motels (20-49: 1, 1-4: 1)
Finance and Insurance: Commercial Banking (5-9: 1, 1-4: 1)
Other Services (except Public Administration): Civic and Social Organizations (5-9: 1, 1-4: 1)
Health Care and Social Assistance: Continuing Care Retirement Communities (5-9: 1)
People in group quarters in 2000:
12 people in other noninstitutional group quarters
Fatal accident statistics in 2011:
Fatal accident count: 1
Vehicles involved in fatal accidents: 1
Fatal accidents caused by drunken drivers: 1
Fatalities: 1
Persons involved in fatal accidents: 3
Pedestrians involved in fatal accidents: 0
2002 - 2018 National Fire Incident Reporting System (NFIRS) incidents
According to the data from the years 2002 - 2018 the average number of fire incidents per year is 23. The highest number of reported fires - 47 took place in 2007, and the least - 3 in 2017. The data has a dropping trend.
When looking into fire subcategories, the most reports belonged to: Outside Fires (51.3%), and Structure Fires (38.8%).
Fire incident types reported to NFIRS in Zip Code 72619


 Nearest zip codes: 72642, 72626, 72661, 72635, 72651, 65729.


 According to the data from the years 2002 - 2018 the average number of fire incidents per year is 23. The highest number of reported fires - 47 took place in 2007, and the least - 3 in 2017. The data has a dropping trend.
 When looking into fire subcategories, the most reports belonged to: Outside Fires (51.3%), and Structure Fires (38.8%).