Estimated zip code population in 2022: 7,984 Zip code population in 2010: 6,208 Zip code population in 2000: 5,062
Houses and condos: 2,681 Renter-occupied apartments: 438
% of renters here:
18%
State:
34%
March 2022 cost of living index in zip code 72736: 81.0 (low, U.S. average is 100)
Land area: 88.6 sq. mi. Water area: 0.0 sq. mi.
Population density: 90 people per square mile
(very low).
OSM Map
General Map
Google Map
MSN Map
OSM Map
General Map
Google Map
MSN Map
OSM Map
General Map
Google Map
MSN Map
OSM Map
General Map
Google Map
MSN Map
Please wait while loading the map...
Real estate property taxes paid for housing units in 2022:
This zip code:
0.4% ($1,229)
Arkansas:
0.5% ($977)
Median real estate property taxes paid for housing units with mortgages in 2022: $1,536 (0.4%) Median real estate property taxes paid for housing units with no mortgage in 2022: $761 (0.4%)
Business Search- 14 Million verified businesses
Males: 3,987
(49.9%)
Females: 3,997
(50.1%)
For population 25 years and over in 72736:
High school or higher: 88.9%
Bachelor's degree or higher: 26.5%
Graduate or professional degree: 10.7%
Unemployed: 0.7%
Mean travel time to work (commute): 24.6 minutes
For population 15 years and over in 72736:
Never married: 29.5%
Now married: 56.1%
Separated: 1.3%
Widowed: 3.8%
Divorced: 9.3%
Zip code 72736 compared to state average:
Median house value above state average.
Unemployed percentage significantly below state average.
Black race population percentage significantly below state average.
Hispanic race population percentage below state average.
Median age below state average.
Foreign-born population percentage significantly below state average.
Estimated median house/condo value in 2022: $277,561
72736:
$277,561
Arkansas:
$179,800
According to our research of Arkansas and other state lists, there were 12 registered sex offenders living in 72736 zip code as of May 22, 2024. The ratio of all residents to sex offenders in zip code 72736 is 531 to 1. The ratio of registered sex offenders to all residents in this zip code is near the state average.
Median resident age:
This zip code:
34.2 years
Arkansas median age:
38.9 years
Average household size:
This zip code:
3.2 people
Arkansas:
2.4 people
Averages for the 2020 tax year for zip code 72736, filed in 2021:
Average Adjusted Gross Income (AGI) in 2020: $65,528 (Individual Income Tax Returns)
Here:
$65,528
State:
$64,872
Salary/wage: $61,426 (reported on 86.4% of returns)
Here:
$61,426
State:
$50,644
(% of AGI for various income ranges: 1259.1% for AGIs below $25k, 3732.2% for AGIs $25k-50k, 6981.2% for AGIs $50k-75k, 9879.0% for AGIs $75k-100k, 20352.0% for AGIs $100k-200k, 88272.5% for AGIs over 200k)
Taxable interest for individuals: $776 (reported on 25.2% of returns)
This zip code:
$776
Arkansas:
$1,857
(% of AGI for various income ranges: 13.5% for AGIs below $25k, 8.6% for AGIs $25k-50k, 47.6% for AGIs $50k-75k, 47.0% for AGIs $75k-100k, 33.6% for AGIs $100k-200k, 260.0% for AGIs over 200k)
Ordinary dividends: $2,810 (reported on 16.2% of returns)
Here:
$2,810
State:
$21,681
(% of AGI for various income ranges: 15.7% for AGIs below $25k, 24.4% for AGIs $25k-50k, 77.0% for AGIs $50k-75k, 56.0% for AGIs $75k-100k, 175.6% for AGIs $100k-200k, 780.0% for AGIs over 200k)
Net capital gain/loss in AGI: +$10,570 (reported on 15.2% of returns)
Here:
+$10,570
State:
+$22,815
(% of AGI for various income ranges: 23.1% for AGIs below $25k, 58.5% for AGIs $25k-50k, 115.8% for AGIs $50k-75k, 155.0% for AGIs $75k-100k, 672.0% for AGIs $100k-200k, 4935.0% for AGIs over 200k)
Profit/loss from business: +$8,640 (reported on 16.6% of returns)
Here:
+$8,640
State:
+$9,743
(% of AGI for various income ranges: 124.1% for AGIs below $25k, 201.0% for AGIs $25k-50k, 116.1% for AGIs $50k-75k, 214.5% for AGIs $75k-100k, 130.0% for AGIs $100k-200k, 2697.5% for AGIs over 200k)
Taxable individual retirement arrangement distribution: $16,205 (reported on 6.6% of returns)
72736:
$16,205
Arkansas:
$18,502
(% of AGI for various income ranges: 57.6% for AGIs below $25k, 82.0% for AGIs $25k-50k, 247.0% for AGIs $50k-75k, 164.5% for AGIs $75k-100k, 474.8% for AGIs $100k-200k)
Total itemized deductions: $32,417 (reported on 6.0% of returns)
Here:
$32,417
State:
$52,840
(% of AGI for various income ranges: 122.7% for AGIs $25k-50k, 250.5% for AGIs $75k-100k, 887.6% for AGIs $100k-200k, 5977.5% for AGIs over 200k)
Charity contributions: $11,280 (reported on 5.0% of returns)
Here:
$11,280
State:
$35,735
(% of AGI for various income ranges: 84.8% for AGIs $50k-75k, 258.4% for AGIs $100k-200k, 1915.0% for AGIs over 200k)
Taxes paid: $7,889 (reported on 6.0% of returns)
72736:
$7,889
State:
$7,196
(% of AGI for various income ranges: 15.8% for AGIs $25k-50k, 72.0% for AGIs $75k-100k, 240.0% for AGIs $100k-200k, 1457.5% for AGIs over 200k)
Earned income credit: $2,384 (reported on 18.9% of returns)
Here:
$2,384
State:
$2,546
(% of AGI for various income ranges: 99.3% for AGIs below $25k, 105.8% for AGIs $25k-50k)
Percentage of individuals using paid preparers for their 2020 taxes: 95.4%
Here:
95%
State:
94%
(% for various income ranges: 93.9% for AGIs below $25k, 94.5% for AGIs $25k-50k, 95.6% for AGIs $50k-75k, 96.4% for AGIs $75k-100k, 97.7% for AGIs $100k-200k, 100.0% for AGIs over 200k)
Averages for the 2012 tax year for zip code 72736, filed in 2013:
Average Adjusted Gross Income (AGI) in 2012: $50,653 (Individual Income Tax Returns)
Here:
$50,653
State:
$52,148
Salary/wage: $45,827 (reported on 86.1% of returns)
Here:
$45,827
State:
$41,669
(% of AGI for various income ranges: 76.6% for AGIs below $25k, 81.6% for AGIs $25k-50k, 81.9% for AGIs $50k-75k, 81.1% for AGIs $75k-100k, 82.0% for AGIs $100k-200k, 63.2% for AGIs over 200k)
Taxable interest for individuals: $907 (reported on 24.8% of returns)
This zip code:
$907
Arkansas:
$1,648
(% of AGI for various income ranges: 1.1% for AGIs below $25k, 0.7% for AGIs $25k-50k, 0.3% for AGIs $50k-75k, 0.2% for AGIs $75k-100k, 0.2% for AGIs $100k-200k, 0.4% for AGIs over 200k)
Ordinary dividends: $2,002 (reported on 18.1% of returns)
Here:
$2,002
State:
$20,675
(% of AGI for various income ranges: 0.9% for AGIs below $25k, 0.7% for AGIs $25k-50k, 0.5% for AGIs $50k-75k, 0.4% for AGIs $75k-100k, 1.0% for AGIs $100k-200k, 0.8% for AGIs over 200k)
Net capital gain/loss in AGI: +$3,363 (reported on 14.7% of returns)
Here:
+$3,363
State:
+$15,222
(% of AGI for various income ranges: 0.3% for AGIs below $25k, 1.8% for AGIs $25k-50k, 0.6% for AGIs $50k-75k, 1.2% for AGIs $75k-100k, 1.4% for AGIs $100k-200k, 0.2% for AGIs over 200k)
Profit/loss from business: +$7,576 (reported on 17.6% of returns)
Here:
+$7,576
State:
+$9,665
(% of AGI for various income ranges: 9.1% for AGIs below $25k, 2.6% for AGIs $25k-50k, 2.2% for AGIs $50k-75k, 2.2% for AGIs $75k-100k, 2.5% for AGIs $100k-200k)
Taxable individual retirement arrangement distribution: $14,021 (reported on 8.0% of returns)
72736:
$14,021
Arkansas:
$13,644
(% of AGI for various income ranges: 3.0% for AGIs below $25k, 3.0% for AGIs $25k-50k, 1.6% for AGIs $50k-75k, 2.0% for AGIs $75k-100k, 3.5% for AGIs $100k-200k)
Total itemized deductions: $24,102 (22% of AGI, reported on 26.1% of returns)
Here:
$24,102
State:
$23,276
Here:
22.4% of AGI
State:
19.1% of AGI
(% of AGI for various income ranges: 6.2% for AGIs below $25k, 8.8% for AGIs $25k-50k, 10.6% for AGIs $50k-75k, 11.0% for AGIs $75k-100k, 15.2% for AGIs $100k-200k, 18.7% for AGIs over 200k)
Charity contributions: $5,527 (reported on 18.5% of returns)
Here:
$5,527
State:
$5,996
(% of AGI for various income ranges: 0.7% for AGIs below $25k, 1.2% for AGIs $25k-50k, 1.5% for AGIs $50k-75k, 1.8% for AGIs $75k-100k, 3.0% for AGIs $100k-200k, 2.9% for AGIs over 200k)
Taxes paid: $7,577 (reported on 26.1% of returns)
72736:
$7,577
State:
$7,941
(% of AGI for various income ranges: 1.1% for AGIs below $25k, 1.6% for AGIs $25k-50k, 2.4% for AGIs $50k-75k, 3.5% for AGIs $75k-100k, 5.9% for AGIs $100k-200k, 7.0% for AGIs over 200k)
Earned income credit: $2,447 (reported on 24.8% of returns)
Here:
$2,447
State:
$2,455
(% of AGI for various income ranges: 8.5% for AGIs below $25k, 1.9% for AGIs $25k-50k)
Percentage of individuals using paid preparers for their 2012 taxes: 69.3%
Here:
69%
State:
61%
(% for various income ranges: 63.6% for AGIs below $25k, 71.2% for AGIs $25k-50k, 73.5% for AGIs $50k-75k, 73.7% for AGIs $75k-100k, 72.7% for AGIs $100k-200k, 100.0% for AGIs over 200k)
Averages for the 2004 tax year for zip code 72736, filed in 2005:
Average Adjusted Gross Income (AGI) in 2004: $40,639 (Individual Income Tax Returns)
Here:
$40,639
State:
$39,270
Salary/wage: $36,656 (reported on 87.1% of returns)
Here:
$36,656
State:
$34,079
(% of AGI for various income ranges: 159.7% for AGIs below $10k, 84.2% for AGIs $10k-25k, 87.2% for AGIs $25k-50k, 87.8% for AGIs $50k-75k, 79.6% for AGIs $75k-100k, 57.7% for AGIs over 100k)
Taxable interest for individuals: $1,353 (reported on 35.8% of returns)
This zip code:
$1,353
Arkansas:
$1,904
(% of AGI for various income ranges: 10.3% for AGIs below $10k, 1.9% for AGIs $10k-25k, 0.8% for AGIs $25k-50k, 0.9% for AGIs $50k-75k, 1.6% for AGIs $75k-100k, 0.9% for AGIs over 100k)
Taxable dividends: $1,064 (reported on 21.5% of returns)
Here:
$1,064
State:
$5,995
(% of AGI for various income ranges: 2.1% for AGIs below $10k, 0.5% for AGIs $10k-25k, 0.4% for AGIs $25k-50k, 0.2% for AGIs $50k-75k, 0.5% for AGIs $75k-100k, 1.0% for AGIs over 100k)
Net capital gain/loss: +$13,150 (reported on 19.2% of returns)
Here:
+$13,150
State:
+$10,430
(% of AGI for various income ranges: -1.1% for AGIs below $10k, 1.3% for AGIs $10k-25k, 1.3% for AGIs $25k-50k, 0.8% for AGIs $50k-75k, 6.0% for AGIs $75k-100k, 16.6% for AGIs over 100k)
Profit/loss from business: +$7,372 (reported on 20.8% of returns)
Here:
+$7,372
State:
+$7,823
(% of AGI for various income ranges: 16.8% for AGIs below $10k, 4.5% for AGIs $10k-25k, 4.6% for AGIs $25k-50k, 1.9% for AGIs $50k-75k, 1.8% for AGIs $75k-100k, 4.5% for AGIs over 100k)
IRA payment deduction: $3,032 (reported on 1.5% of returns)
72736:
$3,032
Arkansas:
$3,204
Total itemized deductions: $17,686 (22% of AGI, reported on 27.1% of returns)
Here:
$17,686
State:
$18,389
Here:
22.3% of AGI
State:
21.0% of AGI
(% of AGI for various income ranges: 19.6% for AGIs below $10k, 7.2% for AGIs $10k-25k, 11.5% for AGIs $25k-50k, 10.5% for AGIs $50k-75k, 16.1% for AGIs $75k-100k, 12.1% for AGIs over 100k)
Charity contributions deductions: $4,479 (5% of AGI, reported on 21.5% of returns)
Here:
$4,479
State:
$4,725
Here:
5.2% of AGI
State:
5.1% of AGI
(% of AGI for various income ranges: 2.0% for AGIs below $10k, 1.1% for AGIs $10k-25k, 1.8% for AGIs $25k-50k, 1.6% for AGIs $50k-75k, 3.5% for AGIs $75k-100k, 3.3% for AGIs over 100k)
Total tax: $5,525 (reported on 74.2% of returns)
72736:
$5,525
State:
$6,047
(% of AGI for various income ranges: 6.7% for AGIs below $10k, 4.3% for AGIs $10k-25k, 5.8% for AGIs $25k-50k, 7.8% for AGIs $50k-75k, 10.0% for AGIs $75k-100k, 18.0% for AGIs over 100k)
Earned income credit: $1,849 (reported on 21.0% of returns)
Here:
$1,849
State:
$1,909
Percentage of individuals using paid preparers for their 2004 taxes: 73.9%
Here:
74%
State:
67%
(% for various income ranges: 66.9% for AGIs below $10k, 72.9% for AGIs $10k-25k, 74.3% for AGIs $25k-50k, 79.2% for AGIs $50k-75k, 75.8% for AGIs $75k-100k, 85.2% for AGIs over 100k)
Likely homosexual households (counted as self-reported same-sex unmarried-partner households)
Lesbian couples: 0.3% of all households
Gay men: 0.0% of all households
Household received Food Stamps/SNAP in the past 12 months: 136 Household did not receive Food Stamps/SNAP in the past 12 months: 2,359
Women who had a birth in the past 12 months: 184 (95 now married, 87 unmarried) Women who did not have a birth in the past 12 months: 1,727 (800 now married, 926 unmarried)
Housing units in zip code 72736 with a mortgage: 1,291 (55 second mortgage, 5 both second mortgage and home equity loan) Median monthly owner costs for units with a mortgage: $1,367 Median monthly owner costs for units without a mortgage: $433
Residents with income below the poverty level in 2022:
This zip code:
3.6%
Whole state:
16.8%
Residents with income below 50% of the poverty level in 2022:
This zip code:
2.6%
Whole state:
8.5%
Median number of rooms in houses and condos:
Here:
6.6
State:
6.1
Median number of rooms in apartments:
Here:
4.9
State:
4.3
Notable locations in this zip code not listed on our city pages
Notable locations in zip code 72736: Appleglen Dairy (A), Boling Farms (B), Camden Farm (C), D and J Farms (D), Eagle Rock Farms (E), Eldred Farms (F), Everlasting Farms (G), Pruitt Farm (H), T K Farms (I), Webb Farm (J), Whitman Farm (K), Gravette Fire Department (L), Gravette Police Department (M), Gravette Fire Department (N). Display/hide their locations on the map
Churches in zip code 72736 include: Mount Olive Church (A), Mount Pleasant Missionary Baptist Church (B), Lynn Church of Christ (C), Pleasant Center Church (D), Bethlehem Baptist Church (E). Display/hide their locations on the map
Cemeteries: Bethel Cemetery (1), Wet Prairie Cemetery (2), Georgia Cemetery (3), Dow Cemetery (4), Daniels Cemetery (5), Ward Cemetery (6), Parn Cemetery (7). Display/hide their locations on the map
Streams, rivers, and creeks: South Prong Spavinaw Creek (A), Spring Branch (B), Wolf Creek (C), Seilers Branch (D), Decatur Branch (E). Display/hide their locations on the map
In group quarters: 1 (-1 institutionalized population)
Size of family households: 722 2-persons, 386 3-persons, 474 4-persons, 296 5-persons, 84 6-persons, 112 7-or-more-persons
Size of nonfamily households: 286 1-person, 81 2-persons
1,235 married couples with children.
848 single-parent households (455 men, 393 women).
97.8% of residents of 72736 zip code speak English at home.
1.3% of residents speak Spanish at home (63% very well, 37% well).
0.3% of residents speak other Indo-European language at home (100% well).
Foreign born population: 134 (1.7%) (70.4% of them are naturalized citizens)
This zip code:
1.7%
Whole state:
5.1%
37%France
32%Chile
2%Indonesia
23%American
22%German
14%English
5%Irish
5%Swiss
3%Welsh
3%Scottish
Year of entry for the foreign-born population
02010 or later
02000 to 2009
951990 to 1999
61Before 1990
Facilities with environmental interests located in this zip code:
GRACO CORP (HWY 59N 1.5M N HWY 72 in GRAVETTE, AR)
STATE MASTER (PDS) - WATER-ARR00A470, NPDES STORMWATER PERMIT Conditionally Exempt Small Quantity Generators, less than 100 kg/month of hazardous waste (Resource Conservation and Recovery Act (tracking hazardous waste)) - notification Organizations: GRACO CORPORATION (CONTACT/OWNER)
GRAVETTE HIGH SCHOOL (607 DALLAS ST SE in GRAVETTE, AR)
(Geographic Names Information System) (National Center for Education Statistics) - STATE ID-0404022
GLEN A. DUFFY ELEM. SCHOOL (601 EL PASO ST SE in GRAVETTE, AR)
(National Center for Education Statistics) - STATE ID-0404023 Organizations: GRAVETTE (SCHOOL DISTRICT)
GRAVETTE JR. HIGH SCHOOL (605 DALLAS ST SE in GRAVETTE, AR)
(National Center for Education Statistics) - STATE ID-0404024
GRAVETTE UPPER ELEMENTARY (500 8TH AVE SE in GRAVETTE, AR)
(National Center for Education Statistics) - STATE ID-0404025
BENTON COUNTY STONE (HIGHWAY 59 NORTH in GRAVETTE, AR)
AIR MINOR (AIRS/AFS) AIR SYNTHETIC MINOR (AIRS/AFS) National Pollutant Discharge Elimination System NON-MAJOR (Tracking pollutant discharge elimination systems) - permit Business SIC classification: CRUSHED AND BROKEN LIMESTONE
AWG-GRAVETTE-BORDER STA (DALLAS & 4TH ST in GRAVETTE, AR)
(Resource Conservation and Recovery Act (tracking hazardous waste)) Organizations: ARK WESTERN GAS CO (CONTACT/OWNER)
GRAVETTE QUARRY (COUNTY ROAD 34C in GRAVETTE, AR)
National Pollutant Discharge Elimination System NON-MAJOR (Tracking pollutant discharge elimination systems) - permit Business SIC classification: CRUSHED AND BROKEN LIMESTONE
GRAVETTE, CITY OF (.5 MI W OF HWY 59 in GRAVETTE, AR)
National Pollutant Discharge Elimination System NON-MAJOR (Tracking pollutant discharge elimination systems) - permit Business SIC classification: SEWERAGE SYSTEMS
GRAVETTE SCHOOL DISTRICT (6TH & BIRMINGHAM STS in GRAVETTE, AR)
COMPLIANCE ACTIVITY (Tracking inspections of insecticide, fungicide, and rodenticide, and toxic substances)
Housing units lacking complete plumbing facilities: 6.3% Housing units lacking complete kitchen facilities: 7.1%
38.5%Electricity
31.4%Utility gas
19.3%Bottled, tank, or LP gas
9.9%Wood
1.0%Other fuel
Population in 1990: 3,508. Population change in the 1990s: +1,554 (+44.3%).
Place of birth for U.S.-born residents:
This state: 4,098
Northeast: 7
Midwest: 1,199
South: 1,265
West: 1,312
54% of the 72736 zip code residents lived in the same house 5 years ago. Out of people who lived in different houses, 65% lived in this county. Out of people who lived in different counties, 50% lived in Arkansas.
94% of the 72736 zip code residents lived in the same house 1 year ago. Out of people who lived in different houses, 56% moved from this county. Out of people who lived in different houses, 20% moved from different county within same state. Out of people who lived in different houses, 25% moved from different state.
Private vs. public school enrollment:
Students in private schools in grades 1 to 8 (elementary and middle school): 197
Here:
18.6%
Arkansas:
10.5%
Students in private schools in grades 9 to 12 (high school): 125
Here:
17.7%
Arkansas:
8.7%
Students in private undergraduate colleges: 49
Here:
22.5%
Arkansas:
19.4%
Occupation by median earnings in the past 12 months ($)
206,461Health diagnosing and treating practitioners and other technical occupations
107,053Computer and mathematical occupations
72,703Business and financial operations occupations
70,947Management occupations
70,451Arts, design, entertainment, sports, and media occupations
58,197Health technologists and technicians
Top industries in this zip code by the number of employees in 2005:
Health Care and Social Assistance: General Medical and Surgical Hospitals (100-249 employees: 1 establishment)
Wholesale Trade: Industrial and Personal Service Paper Merchant Wholesalers (50-99: 1)
Detailed PMIC statistics for the following Tracts:0209.00
, 0210.01
2002 - 2018 National Fire Incident Reporting System (NFIRS) incidents
Based on the data from the years 2002 - 2018 the average number of fire incidents per year is 29. The highest number of reported fires - 109 took place in 2018, and the least - 0 in 2004. The data has a rising trend.
When looking into fire subcategories, the most incidents belonged to: Outside Fires (47.5%), and Structure Fires (39.4%).
Fire incident types reported to NFIRS in Zip Code 72736


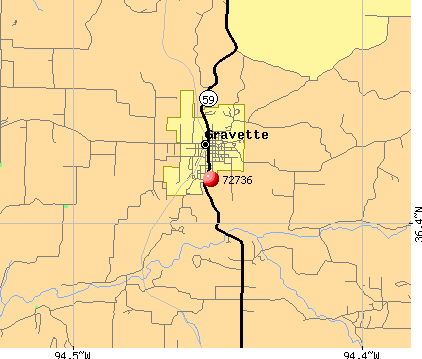 Nearest zip codes: 72722, 72768, 72747, 64854, 72739, 72734.


 Based on the data from the years 2002 - 2018 the average number of fire incidents per year is 29. The highest number of reported fires - 109 took place in 2018, and the least - 0 in 2004. The data has a rising trend.
 When looking into fire subcategories, the most incidents belonged to: Outside Fires (47.5%), and Structure Fires (39.4%).