Estimated zip code population in 2022: 697 Zip code population in 2010: 988 Zip code population in 2000: 1,052
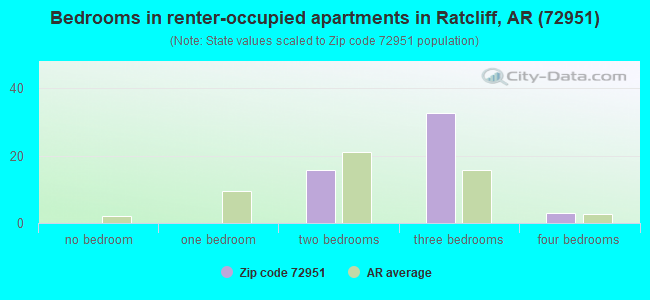
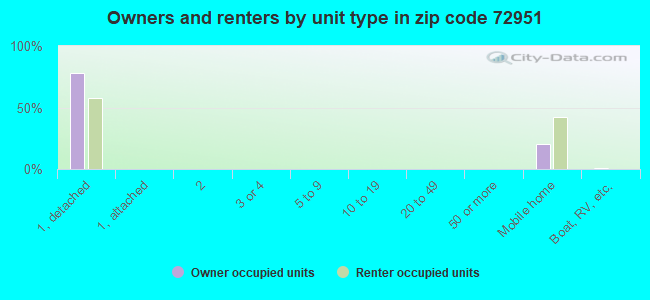
Houses and condos: 429 Renter-occupied apartments: 53
% of renters here:
16%
State:
34%
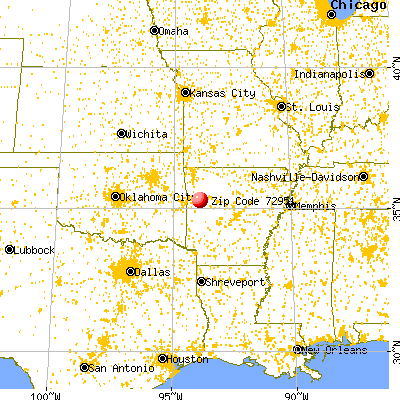
March 2022 cost of living index in zip code 72951: 78.3 (low, U.S. average is 100)
Land area: 16.7 sq. mi. Water area: 0.1 sq. mi.
Population density: 42 people per square mile
(very low).
OSM Map
General Map
Google Map
MSN Map
OSM Map
General Map
Google Map
MSN Map
OSM Map
General Map
Google Map
MSN Map
OSM Map
General Map
Google Map
MSN Map
Please wait while loading the map...
Real estate property taxes paid for housing units in 2022:
This zip code:
0.3% ($321)
Arkansas:
0.5% ($977)
Median real estate property taxes paid for housing units with mortgages in 2022: $242 (0.2%) Median real estate property taxes paid for housing units with no mortgage in 2022: $471 (0.5%)
Business Search- 14 Million verified businesses
Males: 333
(47.9%)
Females: 363
(52.1%)
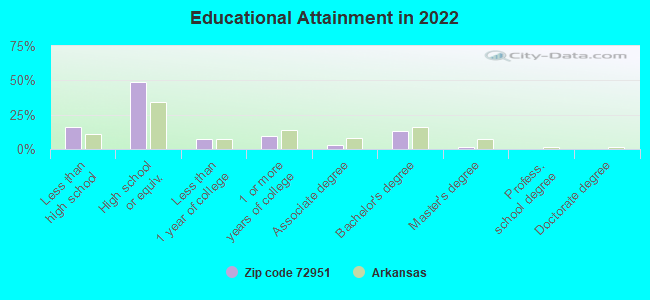
For population 25 years and over in 72951:
High school or higher: 81.2%
Bachelor's degree or higher: 14.5%
Graduate or professional degree: 1.3%
Unemployed: 4.0%
Mean travel time to work (commute): 25.4 minutes
For population 15 years and over in 72951:
Never married: 16.6%
Now married: 59.7%
Separated: 1.2%
Widowed: 4.8%
Divorced: 17.8%
Zip code 72951 compared to state average:
Median household income below state average.
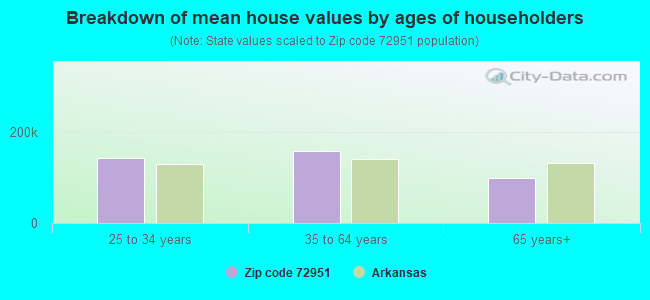
Median house value below state average.
Black race population percentage significantly below state average.
Hispanic race population percentage significantly below state average.
Median age significantly above state average.
Foreign-born population percentage significantly below state average.
Renting percentage below state average.
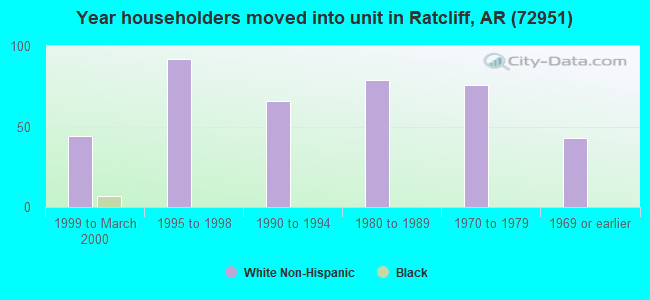
Length of stay since moving in significantly above state average.
Percentage of population with a bachelor's degree or higher below state average.
Averages for the 2020 tax year for zip code 72951, filed in 2021:
Average Adjusted Gross Income (AGI) in 2020: $47,465 (Individual Income Tax Returns)
Here:
$47,465
State:
$64,872
Salary/wage: $42,333 (reported on 82.5% of returns)
Here:
$42,333
State:
$50,644
(% of AGI for various income ranges: 1398.9% for AGIs below $25k, 3833.3% for AGIs $25k-50k, 5644.0% for AGIs $50k-75k, 10910.0% for AGIs $75k-100k, 21285.0% for AGIs $100k-200k)
Taxable interest for individuals: $585 (reported on 32.5% of returns)
This zip code:
$585
Arkansas:
$1,857
(% of AGI for various income ranges: 33.3% for AGIs below $25k, 4.4% for AGIs $25k-50k, 72.0% for AGIs $50k-75k, 30.0% for AGIs $100k-200k)
Ordinary dividends: $1,525 (reported on 10.0% of returns)
Here:
$1,525
State:
$21,681
(% of AGI for various income ranges: 12.2% for AGIs below $25k, 100.0% for AGIs $50k-75k)
Net capital gain/loss in AGI: +$1,175 (reported on 10.0% of returns)
Here:
+$1,175
State:
+$22,815
(% of AGI for various income ranges: 26.7% for AGIs below $25k, 46.0% for AGIs $50k-75k)
Profit/loss from business: +$9,000 (reported on 12.5% of returns)
Here:
+$9,000
State:
+$9,743
(% of AGI for various income ranges: 242.2% for AGIs below $25k, 464.0% for AGIs $50k-75k)
Taxable individual retirement arrangement distribution: $7,300 (reported on 7.5% of returns)
72951:
$7,300
Arkansas:
$18,502
(% of AGI for various income ranges: 243.3% for AGIs $25k-50k)
Earned income credit: $2,156 (reported on 22.5% of returns)
Here:
$2,156
State:
$2,546
(% of AGI for various income ranges: 116.7% for AGIs below $25k, 98.9% for AGIs $25k-50k)
Percentage of individuals using paid preparers for their 2020 taxes: 97.5%
Here:
98%
State:
94%
(% for various income ranges: 100.0% for AGIs below $25k, 92.3% for AGIs $25k-50k, 100.0% for AGIs $50k-75k, 100.0% for AGIs $75k-100k, 100.0% for AGIs $100k-200k)
Averages for the 2012 tax year for zip code 72951, filed in 2013:
Average Adjusted Gross Income (AGI) in 2012: $46,107 (Individual Income Tax Returns)
Here:
$46,107
State:
$52,148
Salary/wage: $39,909 (reported on 82.9% of returns)
Here:
$39,909
State:
$41,669
(% of AGI for various income ranges: 75.2% for AGIs below $25k, 76.8% for AGIs $25k-50k, 79.2% for AGIs $50k-75k, 75.7% for AGIs $75k-100k, 55.6% for AGIs $100k-200k)
Taxable interest for individuals: $914 (reported on 34.1% of returns)
This zip code:
$914
Arkansas:
$1,648
(% of AGI for various income ranges: 1.2% for AGIs below $25k, 1.4% for AGIs $25k-50k, 0.4% for AGIs $50k-75k, 0.7% for AGIs $75k-100k)
Ordinary dividends: $867 (reported on 14.6% of returns)
Here:
$867
State:
$20,675
Net capital gain/loss in AGI: +$1,640 (reported on 12.2% of returns)
Here:
+$1,640
State:
+$15,222
Profit/loss from business: +$6,040 (reported on 12.2% of returns)
Here:
+$6,040
State:
+$9,665
Taxable individual retirement arrangement distribution: $14,467 (reported on 7.3% of returns)
72951:
$14,467
Arkansas:
$13,644
Total itemized deductions: $17,325 (21% of AGI, reported on 19.5% of returns)
Here:
$17,325
State:
$23,276
Here:
20.6% of AGI
State:
19.1% of AGI
Charity contributions: $3,525 (reported on 9.8% of returns)
Here:
$3,525
State:
$5,996
Taxes paid: $5,150 (reported on 19.5% of returns)
72951:
$5,150
State:
$7,941
(% of AGI for various income ranges: 2.3% for AGIs $25k-50k, 2.8% for AGIs $75k-100k, 4.5% for AGIs $100k-200k)
Earned income credit: $2,333 (reported on 22.0% of returns)
Here:
$2,333
State:
$2,455
(% of AGI for various income ranges: 7.9% for AGIs below $25k, 1.5% for AGIs $25k-50k)
Percentage of individuals using paid preparers for their 2012 taxes: 73.2%
Here:
73%
State:
61%
(% for various income ranges: 60.0% for AGIs below $25k, 75.0% for AGIs $25k-50k, 71.4% for AGIs $50k-75k, 100.0% for AGIs $75k-100k, 100.0% for AGIs $100k-200k)
Averages for the 2004 tax year for zip code 72951, filed in 2005:
Average Adjusted Gross Income (AGI) in 2004: $32,095 (Individual Income Tax Returns)
Here:
$32,095
State:
$39,270
Salary/wage: $30,226 (reported on 80.2% of returns)
Here:
$30,226
State:
$34,079
(% of AGI for various income ranges: 114.0% for AGIs below $10k, 72.1% for AGIs $10k-25k, 84.9% for AGIs $25k-50k, 80.7% for AGIs $50k-75k, 41.7% for AGIs $75k-100k)
Taxable interest for individuals: $1,446 (reported on 40.6% of returns)
This zip code:
$1,446
Arkansas:
$1,904
(% of AGI for various income ranges: 6.2% for AGIs below $10k, 2.6% for AGIs $10k-25k, 1.5% for AGIs $25k-50k, 1.8% for AGIs $50k-75k, 1.1% for AGIs $75k-100k)
Taxable dividends: $746 (reported on 14.4% of returns)
Here:
$746
State:
$5,995
Net capital gain/loss: +$1,185 (reported on 13.2% of returns)
Here:
+$1,185
State:
+$10,430
Profit/loss from business: +$6,535 (reported on 17.4% of returns)
Here:
+$6,535
State:
+$7,823
(% of AGI for various income ranges: 3.4% for AGIs below $10k, 5.5% for AGIs $10k-25k, 4.6% for AGIs $25k-50k, 3.1% for AGIs $50k-75k)
Total itemized deductions: $13,507 (26% of AGI, reported on 17.8% of returns)
Here:
$13,507
State:
$18,389
Here:
25.7% of AGI
State:
21.0% of AGI
(% of AGI for various income ranges: 8.3% for AGIs $10k-25k, 5.5% for AGIs $25k-50k, 9.3% for AGIs $50k-75k, 9.4% for AGIs $75k-100k)
Charity contributions deductions: $1,877 (3% of AGI, reported on 13.9% of returns)
Here:
$1,877
State:
$4,725
Here:
3.4% of AGI
State:
5.1% of AGI
Total tax: $3,247 (reported on 74.3% of returns)
72951:
$3,247
State:
$6,047
(% of AGI for various income ranges: 4.2% for AGIs below $10k, 4.1% for AGIs $10k-25k, 6.8% for AGIs $25k-50k, 7.9% for AGIs $50k-75k, 12.6% for AGIs $75k-100k)
Earned income credit: $1,646 (reported on 20.0% of returns)
Here:
$1,646
State:
$1,909
Percentage of individuals using paid preparers for their 2004 taxes: 75.1%
Here:
75%
State:
67%
(% for various income ranges: 63.4% for AGIs below $10k, 75.8% for AGIs $10k-25k, 80.2% for AGIs $25k-50k, 75.4% for AGIs $50k-75k, 85.0% for AGIs $75k-100k)
Household received Food Stamps/SNAP in the past 12 months: 50 Household did not receive Food Stamps/SNAP in the past 12 months: 288
Women who had a birth in the past 12 months: 7 (6 now married, 1 unmarried) Women who did not have a birth in the past 12 months: 112 (57 now married, 55 unmarried)
Housing units in zip code 72951 with a mortgage: 104 (6 second mortgage, 5 both second mortgage and home equity loan) Median monthly owner costs for units with a mortgage: $890 Median monthly owner costs for units without a mortgage: $336
Residents with income below the poverty level in 2022:
This zip code:
32.6%
Whole state:
16.8%
Residents with income below 50% of the poverty level in 2022:
This zip code:
18.2%
Whole state:
8.5%
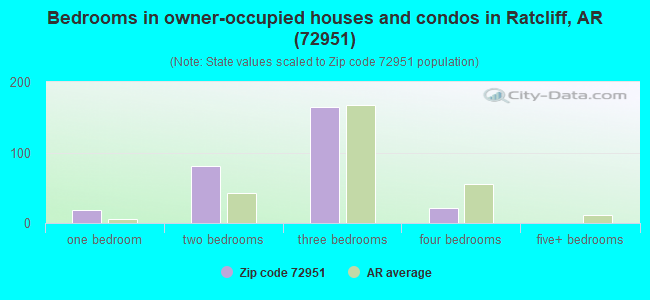
Median number of rooms in houses and condos:
Here:
5.8
State:
6.1
Median number of rooms in apartments:
Here:
4.9
State:
4.3
Notable locations in this zip code not listed on our city pages
Churches in zip code 72951 include: Mount Hope Church (A), Brooklyn Freewill Baptist Church (B), Full Gospel Bible Church (C), Saint Anthonys Church (D). Display/hide their locations on the map
Size of family households: 106 2-persons, 33 3-persons, 33 4-persons, 12 5-persons, 11 6-persons
Size of nonfamily households: 138 1-person, 6 2-persons
96 married couples with children.
51 single-parent households (23 men, 28 women).
94.9% of residents of 72951 zip code speak English at home.
5.5% of residents speak Asian or Pacific Island language at home (81% very well, 19% well).
Foreign born population: 9 (1.3%) (11.4% of them are naturalized citizens)
This zip code:
1.3%
Whole state:
5.1%
67%Indonesia
11%Malaysia
33%American
11%English
3%Irish
2%German
1%Dutch
1%Scotch-Irish
0%Scottish
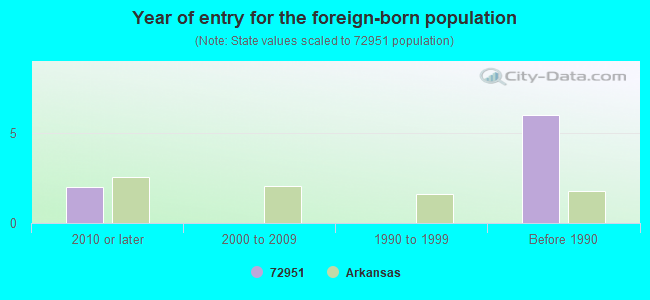
Year of entry for the foreign-born population
22010 or later
02000 to 2009
01990 to 1999
6Before 1990
Facilities with environmental interests located in this zip code:
AIR SYNTHETIC MINOR (AIRS/AFS) Business SIC classification: CRUSHED AND BROKEN LIMESTONE; CRUSHED AND BROKEN STONE Alternative names: CHRISMAN READY MIX, INC.
CENTER POINT ENERGY FIELD-CAULKSVILLE (1.5 MILES E OF CAULKSVILLE in RATCLIFF, AR)
AIR SYNTHETIC MINOR (AIRS/AFS) Business SIC classification: NATURAL GAS TRANSMISSION Alternative names: CENTERPOINT ENERGY FIELD SERVICES, CENTER POINT ENERGY TRANS.-CAULKSVILLE, RELIANT ENERGY - CAULKSVILLE STATION
AIR SYNTHETIC MINOR (AIRS/AFS) Business SIC classification: CRUSHED AND BROKEN LIMESTONE
SEAGULL MID-SOUTH--MANTOOTH COMP. ST (HIGHWAY 22 WEST in RATCLIFF, AR)
CRITERIA AND HAZARDOUS AIR POLLUTANT INVENTORY (Inventory of air pollution sources) Business SIC classification: CRUDE PETROLEUM AND NATURAL GAS; NATURAL GAS TRANSMISSION Business NAICS classification: CRUDE PETROLEUM AND NATURAL GAS EXTRACTION.
Housing units lacking complete plumbing facilities: 8.5% Housing units lacking complete kitchen facilities: 9.8%
52.1%Electricity
35.2%Utility gas
8.9%Bottled, tank, or LP gas
4.3%Wood
Population in 1990: 1,392.
Place of birth for U.S.-born residents:
This state: 458
Northeast: 8
Midwest: 47
South: 113
West: 59
71% of the 72951 zip code residents lived in the same house 5 years ago. Out of people who lived in different houses, 46% lived in this county. Out of people who lived in different counties, 50% lived in Arkansas.
86% of the 72951 zip code residents lived in the same house 1 year ago. Out of people who lived in different houses, 69% moved from this county. Out of people who lived in different houses, 21% moved from different state.
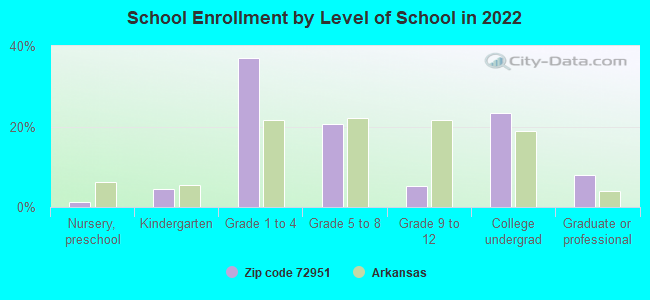
Private vs. public school enrollment:
Students in private schools in grades 1 to 8 (elementary and middle school): 2
Here:
2.9%
Arkansas:
10.5%
Students in private schools in grades 9 to 12 (high school):
Here:
0.0%
Arkansas:
8.7%
Students in private undergraduate colleges:
Here:
0.0%
Arkansas:
19.4%
Occupation by median earnings in the past 12 months ($)
71,314Business and financial operations occupations
65,154Health technologists and technicians
61,321Management occupations
46,375Construction and extraction occupations
29,944Office and administrative support occupations
24,906Production occupations
Companies with federal contracts located in this zip code:
VELMA REED (4115 BACH ROAD in RATCLIFF, AR; small business) : $64,990 in 14 contractsfrom 2002 to 2006
Contracts for Operation of Government-Owned Facilities -- Recreation Facilities (Non-Building) by U.S. Army Corps of Engineers - civil program financing only, Army Signed by year:2000: $0; 2001: $0; 2002: $1,050; 2003: $11,165; 2004: $19,910; 2005: $25,725; 2006: $7,140.
Biggest contracts:
$12,150 with U.S. Army Corps of Engineers - civil program financing only for Operation of Government-Owned Facilities -- Recreation Facilities (Non-Building). Signed on 2005-01-27. Completion date: 2005-10-31.
$12,150 with Army for Operation of Government-Owned Facilities -- Recreation Facilities (Non-Building). Signed on 2005-01-27. Completion date: 2005-10-31.
$8,745 with U.S. Army Corps of Engineers - civil program financing only for Operation of Government-Owned Facilities -- Recreation Facilities (Non-Building). Signed on 2003-03-10. Completion date: 2002-10-31.
$8,690 with Army for Operation of Government-Owned Facilities -- Recreation Facilities (Non-Building). Signed on 2004-01-09. Completion date: 2002-10-31.
Top industries in this zip code by the number of employees in 2005:
Construction: Commercial and Institutional Building Construction (10-19 employees: 1 establishment, 1-4 employees: 1 establishment)
Accommodation and Food Services: Full-Service Restaurants (10-19: 1)
Wholesale Trade: Wholesale Trade Agents and Brokers (10-19: 1)
Health Care and Social Assistance: Child Day Care Services (5-9: 1)
Other Services (except Public Administration): Funeral Homes and Funeral Services (5-9: 1)
Arts, Entertainment, and Recreation: Golf Courses and Country Clubs (5-9: 1)
Construction: New Single-Family Housing Construction (except Operative Builders) (1-4: 2)
Health Care and Social Assistance: Temporary Shelters (1-4: 1)
Fatal accident statistics in 2012:
Fatal accident count: 1
Vehicles involved in fatal accidents: 3
Fatal accidents caused by drunken drivers: 0
Fatalities: 1
Persons involved in fatal accidents: 6
Pedestrians involved in fatal accidents: 0
Fatal accident statistics in 2010:
Fatal accident count: 1
Vehicles involved in fatal accidents: 1
Fatal accidents caused by drunken drivers: 1
Fatalities: 1
Persons involved in fatal accidents: 1
Pedestrians involved in fatal accidents: 0
2003 - 2018 National Fire Incident Reporting System (NFIRS) incidents
Based on the data from the years 2003 - 2018 the average number of fire incidents per year is 8. The highest number of fire incidents - 24 took place in 2015, and the least - 0 in 2006. The data has a growing trend.
When looking into fire subcategories, the most incidents belonged to: Outside Fires (56.2%), and Structure Fires (32.0%).
Fire incident types reported to NFIRS in Zip Code 72951


 Nearest zip codes: 72928, 72930, 72933, 72943, 72821, 72855.


 Based on the data from the years 2003 - 2018 the average number of fire incidents per year is 8. The highest number of fire incidents - 24 took place in 2015, and the least - 0 in 2006. The data has a growing trend.
 When looking into fire subcategories, the most incidents belonged to: Outside Fires (56.2%), and Structure Fires (32.0%).