Estimated median house/condo value in 2022: $168,089
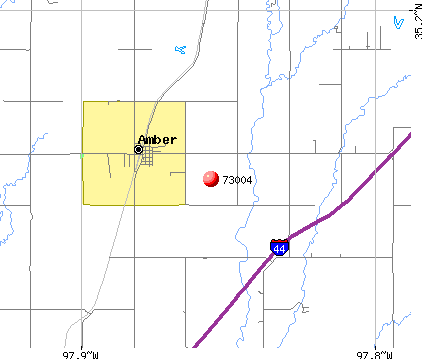
73004:
$168,089
Oklahoma:
$191,700
According to our research of Oklahoma and other state lists, there was 1 registered sex offender living in 73004 zip code as of May 28, 2024. The ratio of all residents to sex offenders in zip code 73004 is 1,034 to 1. The ratio of registered sex offenders to all residents in this zip code is lower than the state average.
Median resident age:
This zip code:
39.9 years
Oklahoma median age:
37.1 years
Average household size:
This zip code:
2.5 people
Oklahoma:
2.5 people
Averages for the 2020 tax year for zip code 73004, filed in 2021:
Average Adjusted Gross Income (AGI) in 2020: $65,713 (Individual Income Tax Returns)
Here:
$65,713
State:
$63,060
Salary/wage: $53,745 (reported on 84.6% of returns)
Here:
$53,745
State:
$52,427
(% of AGI for various income ranges: 1178.8% for AGIs below $25k, 3222.5% for AGIs $25k-50k, 6426.0% for AGIs $50k-75k, 10127.5% for AGIs $75k-100k, 23170.0% for AGIs $100k-200k)
Taxable interest for individuals: $408 (reported on 30.8% of returns)
This zip code:
$408
Oklahoma:
$1,603
(% of AGI for various income ranges: 3.8% for AGIs below $25k, 14.0% for AGIs $50k-75k, 25.0% for AGIs $75k-100k, 96.7% for AGIs $100k-200k)
Ordinary dividends: $2,733 (reported on 7.7% of returns)
Here:
$2,733
State:
$7,001
(% of AGI for various income ranges: 205.0% for AGIs $75k-100k)
Net capital gain/loss in AGI: +$3,340 (reported on 12.8% of returns)
Here:
+$3,340
State:
+$19,855
(% of AGI for various income ranges: 63.7% for AGIs below $25k, 386.7% for AGIs $100k-200k)
Profit/loss from business: +$9,100 (reported on 15.4% of returns)
Here:
+$9,100
State:
+$9,904
(% of AGI for various income ranges: 403.7% for AGIs $25k-50k, 557.5% for AGIs $75k-100k)
Total itemized deductions: $32,900 (reported on 5.1% of returns)
Here:
$32,900
State:
$39,736
(% of AGI for various income ranges: 1316.0% for AGIs $50k-75k)
Taxes paid: $5,450 (reported on 5.1% of returns)
73004:
$5,450
State:
$7,046
(% of AGI for various income ranges: 136.2% for AGIs $25k-50k)
Earned income credit: $2,214 (reported on 17.9% of returns)
Here:
$2,214
State:
$2,435
(% of AGI for various income ranges: 127.5% for AGIs below $25k, 66.2% for AGIs $25k-50k)
Percentage of individuals using paid preparers for their 2020 taxes: 92.3%
Here:
92%
State:
94%
(% for various income ranges: 100.0% for AGIs below $25k, 100.0% for AGIs $25k-50k, 85.7% for AGIs $50k-75k, 83.3% for AGIs $75k-100k, 85.7% for AGIs $100k-200k)
Averages for the 2012 tax year for zip code 73004, filed in 2013:
Average Adjusted Gross Income (AGI) in 2012: $53,236 (Individual Income Tax Returns)
Here:
$53,236
State:
$58,581
Salary/wage: $45,239 (reported on 91.7% of returns)
Here:
$45,239
State:
$45,973
(% of AGI for various income ranges: 76.5% for AGIs below $25k, 82.9% for AGIs $25k-50k, 79.2% for AGIs $50k-75k, 81.4% for AGIs $75k-100k, 72.3% for AGIs $100k-200k)
Taxable interest for individuals: $473 (reported on 30.6% of returns)
This zip code:
$473
Oklahoma:
$1,625
(% of AGI for various income ranges: 0.5% for AGIs below $25k, 0.6% for AGIs $50k-75k, 0.4% for AGIs $100k-200k)
Ordinary dividends: $450 (reported on 11.1% of returns)
Here:
$450
State:
$6,374
Net capital gain/loss in AGI: +$1,200 (reported on 8.3% of returns)
Here:
+$1,200
State:
+$24,023
Profit/loss from business: +$14,900 (reported on 16.7% of returns)
Here:
+$14,900
State:
+$11,913
Total itemized deductions: $20,062 (21% of AGI, reported on 22.2% of returns)
Here:
$20,062
State:
$24,882
Here:
20.7% of AGI
State:
18.8% of AGI
(% of AGI for various income ranges: 16.0% for AGIs $25k-50k, 11.1% for AGIs $75k-100k, 10.2% for AGIs $100k-200k)
Charity contributions: $6,717 (reported on 16.7% of returns)
Here:
$6,717
State:
$6,591
Taxes paid: $4,838 (reported on 22.2% of returns)
73004:
$4,838
State:
$7,196
(% of AGI for various income ranges: 2.8% for AGIs $25k-50k, 2.0% for AGIs $75k-100k, 3.5% for AGIs $100k-200k)
Earned income credit: $2,186 (reported on 19.4% of returns)
Here:
$2,186
State:
$2,354
(% of AGI for various income ranges: 7.1% for AGIs below $25k, 1.3% for AGIs $25k-50k)
Percentage of individuals using paid preparers for their 2012 taxes: 63.9%
Here:
64%
State:
56%
(% for various income ranges: 53.8% for AGIs below $25k, 62.5% for AGIs $25k-50k, 66.7% for AGIs $50k-75k, 80.0% for AGIs $75k-100k, 75.0% for AGIs $100k-200k)
Averages for the 2004 tax year for zip code 73004, filed in 2005:
Average Adjusted Gross Income (AGI) in 2004: $35,831 (Individual Income Tax Returns)
Here:
$35,831
State:
$41,245
Salary/wage: $32,381 (reported on 88.3% of returns)
Here:
$32,381
State:
$35,318
(% of AGI for various income ranges: 103.5% for AGIs below $10k, 78.8% for AGIs $10k-25k, 84.3% for AGIs $25k-50k, 91.0% for AGIs $50k-75k, 83.8% for AGIs $75k-100k, 50.4% for AGIs over 100k)
Taxable interest for individuals: $667 (reported on 28.9% of returns)
This zip code:
$667
Oklahoma:
$1,745
(% of AGI for various income ranges: 8.1% for AGIs below $10k, 0.6% for AGIs $10k-25k, 0.3% for AGIs $25k-50k, 0.2% for AGIs $50k-75k, 1.1% for AGIs $75k-100k)
Taxable dividends: $371 (reported on 9.1% of returns)
Here:
$371
State:
$2,920
Net capital gain/loss: +$1,120 (reported on 6.5% of returns)
Here:
+$1,120
State:
+$10,653
Profit/loss from business: +$7,889 (reported on 14.1% of returns)
Here:
+$7,889
State:
+$8,532
Total itemized deductions: $14,112 (19% of AGI, reported on 23.2% of returns)
Here:
$14,112
State:
$17,093
Here:
18.8% of AGI
State:
20.5% of AGI
(% of AGI for various income ranges: 8.1% for AGIs $25k-50k, 10.7% for AGIs $50k-75k, 14.9% for AGIs $75k-100k, 11.8% for AGIs over 100k)
Charity contributions deductions: $3,592 (5% of AGI, reported on 18.5% of returns)
Here:
$3,592
State:
$4,240
Here:
5.3% of AGI
State:
4.8% of AGI
Total tax: $4,059 (reported on 70.3% of returns)
73004:
$4,059
State:
$6,542
(% of AGI for various income ranges: 2.5% for AGIs below $10k, 3.9% for AGIs $10k-25k, 6.5% for AGIs $25k-50k, 8.1% for AGIs $50k-75k, 9.7% for AGIs $75k-100k, 12.6% for AGIs over 100k)
Earned income credit: $2,137 (reported on 19.0% of returns)
Here:
$2,137
State:
$1,830
Percentage of individuals using paid preparers for their 2004 taxes: 63.5%
Here:
64%
State:
63%
(% for various income ranges: 57.9% for AGIs below $10k, 65.2% for AGIs $10k-25k, 69.9% for AGIs $25k-50k, 54.7% for AGIs $50k-75k, 96.3% for AGIs $75k-100k)
Household received Food Stamps/SNAP in the past 12 months: 24 Household did not receive Food Stamps/SNAP in the past 12 months: 321
Women who had a birth in the past 12 months: 5 (5 now married, 0 unmarried) Women who did not have a birth in the past 12 months: 178 (120 now married, 58 unmarried)
Housing units in zip code 73004 with a mortgage: 128 (8 second mortgage, 7 both second mortgage and home equity loan) Houses without a mortgage: 1
Median monthly owner costs for units with a mortgage: $1,363 Median monthly owner costs for units without a mortgage: $450
Residents with income below the poverty level in 2022:
This zip code:
10.4%
Whole state:
15.7%
Residents with income below 50% of the poverty level in 2022:
This zip code:
8.0%
Whole state:
8.3%
Median number of rooms in houses and condos:
Here:
5.8
State:
6.1
Median number of rooms in apartments:
Here:
5.2
State:
4.5
Notable locations in this zip code not listed on our city pages
Reservoirs: Bityter Creek Site 9 Reservoir (A), Bitter Creek Site 3 Reservoir (B), Bitter Creek Site 4 Reservoir (C), Bitter Creek Site 12 Reservoir (D), Schlotterbeck Trust Reservoir (E), Oknoname 051009 Reservoir (F), Oknoname 051011 Reservoir (G). Display/hide their locations on the map
Size of family households: 112 2-persons, 55 3-persons, 52 4-persons, 14 5-persons, 7 6-persons, 6 7-or-more-persons
Size of nonfamily households: 87 1-person, 12 2-persons, 3 5-persons
127 married couples with children.
30 single-parent households (13 men, 17 women).
97.7% of residents of 73004 zip code speak English at home.
0.8% of residents speak Spanish at home (100% very well).
1.1% of residents speak other Indo-European language at home (100% very well).
Foreign born population: 7 (0.9%) (37.7% of them are naturalized citizens)
This zip code:
0.9%
Whole state:
6.0%
114%Honduras
21%German
15%English
13%American
7%Irish
2%European
1%Dutch
1%British
Year of entry for the foreign-born population
32010 or later
72000 to 2009
01990 to 1999
1Before 1990
Facilities with environmental interests located in this zip code:
AMBER-POCASSET JHS (401 EAST MAIN in AMBER, OK)
(National Center for Education Statistics) - STATE ID-26-I128-615 (National Center for Education Statistics) - STATE ID-26-I128-715
AMBER-POCASSET ES (401 E. MAIN in AMBER, OK)
(National Center for Education Statistics) - STATE ID-26-I128-105
LUMEN MIDSTREAM PAR/AMBER GAS PLT (4 MILES E OF in AMBER, OK)
AIR MINOR (AIRS/AFS) AIR SYNTHETIC MINOR (AIRS/AFS) Business SIC classification: NATURAL GAS LIQUIDS Alternative names: LUMEN ENERGY CORP/AMBER GAS PLT
LUMEN MIDSTREAM PAR/BASSETT CMPSR STA (4 MILES E AND 1 MILE S OF in AMBER, OK)
AIR MINOR (AIRS/AFS) Alternative names: LUMEN ENERGY CORP/BASSETT COMPRESSOR S
MACK ENERGY CO/TROOP HILL COMPRESSO (3 MI S, 4 MI W in AMBER, OK)
AIR MINOR (AIRS/AFS) Business SIC classification: NATURAL GAS TRANSMISSION
CENTERPOINT ENGRY G/AMBER JUNCTION COMPR (3 MI W OF AMBER in AMBER, OK) . Tribal Land
AIR MAJOR (AIRS/AFS) Business SIC classification: NATURAL GAS TRANSMISSION Alternative names: NORAM GAS TRANSMISSION, RELIANT ENERGY GAS /AMBER JUNCTION COMPR
Housing units lacking complete plumbing facilities: 5.3% Housing units lacking complete kitchen facilities: 5.8%
47.5%Electricity
31.8%Bottled, tank, or LP gas
11.9%Other fuel
5.0%Utility gas
2.7%Wood
0.9%Fuel oil, kerosene, etc.
0.9%No fuel used
Population in 1990: 2,575.
Place of birth for U.S.-born residents:
This state: 627
Northeast: 8
Midwest: 77
South: 109
West: 48
68% of the 73004 zip code residents lived in the same house 5 years ago. Out of people who lived in different houses, 56% lived in this county. Out of people who lived in different counties, 50% lived in Oklahoma.
93% of the 73004 zip code residents lived in the same house 1 year ago. Out of people who lived in different houses, 45% moved from this county. Out of people who lived in different houses, 40% moved from different county within same state. Out of people who lived in different houses, 17% moved from different state.
Private vs. public school enrollment:
Students in private schools in grades 1 to 8 (elementary and middle school): 5
Here:
6.8%
Oklahoma:
11.7%
Students in private schools in grades 9 to 12 (high school): 5
Here:
11.3%
Oklahoma:
11.7%
Students in private undergraduate colleges: 4
Here:
24.2%
Oklahoma:
19.3%
Occupation by median earnings in the past 12 months ($)
82,710Community and social service occupations
59,273Transportation occupations
57,215Health diagnosing and treating practitioners and other technical occupations
53,846Management occupations
52,374Sales and related occupations
52,043Material moving occupations
Top industries in this zip code by the number of employees in 2005:
Arts, Entertainment, and Recreation: Other Gambling Industries (100-249 employees: 1 establishment)
Accommodation and Food Services: Full-Service Restaurants (20-49: 1)
Construction: Other Foundation, Structure, and Building Exterior Contractors (10-19: 1)
Health Care and Social Assistance: Child Day Care Services (5-9: 1)
Utilities: Electric Power Distribution (5-9: 1)
Administrative and Support and Waste Management and Remediation Services: Janitorial Services (5-9: 1)
Fatal accident statistics in 2014:
Fatal accident count: 2
Vehicles involved in fatal accidents: 4
Fatal accidents caused by drunken drivers: 0
Fatalities: 4
Persons involved in fatal accidents: 2
Pedestrians involved in fatal accidents: 3
Fatal accident statistics in 2013:
Fatal accident count: 1
Vehicles involved in fatal accidents: 1
Fatal accidents caused by drunken drivers: 0
Fatalities: 1
Persons involved in fatal accidents: 3
Pedestrians involved in fatal accidents: 0
Home Mortgage Disclosure Act Aggregated Statistics For Year 2009 (Based on 2 partial tracts)
A) FHA, FSA/RHS & VA Home Purchase Loans
B) Conventional Home Purchase Loans
C) Refinancings
D) Home Improvement Loans
F) Non-occupant Loans on < 5 Family Dwellings (A B C & D)
G) Loans On Manufactured Home Dwelling (A B C & D)
Number
Average Value
Number
Average Value
Number
Average Value
Number
Average Value
Number
Average Value
Number
Average Value
LOANS ORIGINATED
14
$153,598
11
$126,984
51
$130,636
6
$27,568
3
$60,827
5
$40,260
APPLICATIONS APPROVED, NOT ACCEPTED
1
$126,900
0
$0
4
$118,262
1
$91,460
0
$0
1
$31,510
APPLICATIONS DENIED
2
$145,940
4
$74,282
15
$145,517
5
$43,584
0
$0
1
$29,760
APPLICATIONS WITHDRAWN
2
$188,825
0
$0
11
$139,077
1
$53,390
0
$0
0
$0
FILES CLOSED FOR INCOMPLETENESS
1
$179,420
0
$0
4
$141,345
1
$75,270
0
$0
1
$32,380
Aggregated Statistics For Year 2008 (Based on 2 partial tracts)
A) FHA, FSA/RHS & VA Home Purchase Loans
B) Conventional Home Purchase Loans
C) Refinancings
D) Home Improvement Loans
F) Non-occupant Loans on < 5 Family Dwellings (A B C & D)
G) Loans On Manufactured Home Dwelling (A B C & D)
Number
Average Value
Number
Average Value
Number
Average Value
Number
Average Value
Number
Average Value
Number
Average Value
LOANS ORIGINATED
12
$145,940
21
$134,093
32
$126,166
8
$71,165
3
$97,293
7
$58,513
APPLICATIONS APPROVED, NOT ACCEPTED
0
$0
1
$114,650
2
$155,785
1
$11,380
0
$0
1
$37,200
APPLICATIONS DENIED
1
$167,160
4
$128,218
15
$168,097
4
$61,702
0
$0
2
$59,295
APPLICATIONS WITHDRAWN
2
$119,685
1
$262,120
8
$170,445
2
$52,295
0
$0
0
$0
FILES CLOSED FOR INCOMPLETENESS
0
$0
0
$0
0
$0
0
$0
0
$0
0
$0
Aggregated Statistics For Year 2007 (Based on 2 partial tracts)
A) FHA, FSA/RHS & VA Home Purchase Loans
B) Conventional Home Purchase Loans
C) Refinancings
D) Home Improvement Loans
F) Non-occupant Loans on < 5 Family Dwellings (A B C & D)
G) Loans On Manufactured Home Dwelling (A B C & D)
Number
Average Value
Number
Average Value
Number
Average Value
Number
Average Value
Number
Average Value
Number
Average Value
LOANS ORIGINATED
3
$155,203
34
$116,221
28
$111,166
10
$44,241
5
$61,088
6
$56,377
APPLICATIONS APPROVED, NOT ACCEPTED
0
$0
4
$103,930
4
$141,892
1
$14,440
0
$0
1
$106,770
APPLICATIONS DENIED
0
$0
9
$135,802
15
$130,259
5
$52,774
0
$0
2
$71,330
APPLICATIONS WITHDRAWN
0
$0
3
$95,107
8
$170,445
2
$37,635
0
$0
0
$0
FILES CLOSED FOR INCOMPLETENESS
0
$0
1
$121,650
3
$125,300
0
$0
0
$0
0
$0
Aggregated Statistics For Year 2006 (Based on 2 partial tracts)
A) FHA, FSA/RHS & VA Home Purchase Loans
B) Conventional Home Purchase Loans
C) Refinancings
D) Home Improvement Loans
F) Non-occupant Loans on < 5 Family Dwellings (A B C & D)
G) Loans On Manufactured Home Dwelling (A B C & D)
Number
Average Value
Number
Average Value
Number
Average Value
Number
Average Value
Number
Average Value
Number
Average Value
LOANS ORIGINATED
7
$135,906
41
$112,420
26
$74,308
9
$33,743
5
$64,940
10
$50,280
APPLICATIONS APPROVED, NOT ACCEPTED
0
$0
5
$87,082
4
$108,415
0
$0
0
$0
2
$55,140
APPLICATIONS DENIED
1
$120,780
11
$69,658
19
$106,728
3
$45,220
0
$0
9
$58,590
APPLICATIONS WITHDRAWN
0
$0
4
$70,452
11
$111,747
0
$0
0
$0
0
$0
FILES CLOSED FOR INCOMPLETENESS
0
$0
0
$0
1
$245,060
0
$0
0
$0
0
$0
Aggregated Statistics For Year 2005 (Based on 2 partial tracts)
A) FHA, FSA/RHS & VA Home Purchase Loans
B) Conventional Home Purchase Loans
C) Refinancings
D) Home Improvement Loans
F) Non-occupant Loans on < 5 Family Dwellings (A B C & D)
G) Loans On Manufactured Home Dwelling (A B C & D)
Number
Average Value
Number
Average Value
Number
Average Value
Number
Average Value
Number
Average Value
Number
Average Value
LOANS ORIGINATED
5
$135,218
46
$103,074
34
$73,581
7
$33,696
5
$58,114
9
$47,212
APPLICATIONS APPROVED, NOT ACCEPTED
0
$0
2
$104,370
5
$105,812
1
$24,070
0
$0
3
$68,850
APPLICATIONS DENIED
1
$71,770
5
$74,304
18
$89,465
5
$21,442
0
$0
5
$47,698
APPLICATIONS WITHDRAWN
0
$0
4
$106,885
14
$139,407
2
$101,740
1
$120,780
0
$0
FILES CLOSED FOR INCOMPLETENESS
0
$0
0
$0
2
$38,510
0
$0
0
$0
0
$0
Aggregated Statistics For Year 2004 (Based on 2 partial tracts)
A) FHA, FSA/RHS & VA Home Purchase Loans
B) Conventional Home Purchase Loans
C) Refinancings
D) Home Improvement Loans
F) Non-occupant Loans on < 5 Family Dwellings (A B C & D)
G) Loans On Manufactured Home Dwelling (A B C & D)
Detailed PMIC statistics for the following Tracts:0008.00
2002 - 2018 National Fire Incident Reporting System (NFIRS) incidents
According to the data from the years 2002 - 2018 the average number of fire incidents per year is 13. The highest number of fires - 32 took place in 2008, and the least - 1 in 2010. The data has a decreasing trend.
When looking into fire subcategories, the most incidents belonged to: Outside Fires (65.6%), and Structure Fires (19.5%).
Fire incident types reported to NFIRS in Zip Code 73004

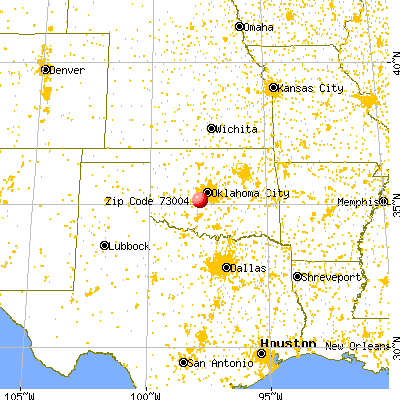


 Nearest zip codes: 73089, 73018, 73010, 73079, 73064, 73002.


 According to the data from the years 2002 - 2018 the average number of fire incidents per year is 13. The highest number of fires - 32 took place in 2008, and the least - 1 in 2010. The data has a decreasing trend.
 When looking into fire subcategories, the most incidents belonged to: Outside Fires (65.6%), and Structure Fires (19.5%).