Estimated zip code population in 2022: 5,770 Zip code population in 2010: 6,005 Zip code population in 2000: 5,544
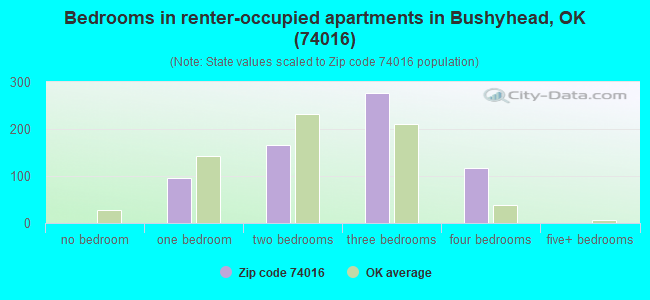
Houses and condos: 2,739 Renter-occupied apartments: 665
% of renters here:
29%
State:
35%
March 2022 cost of living index in zip code 74016: 78.5 (low, U.S. average is 100)
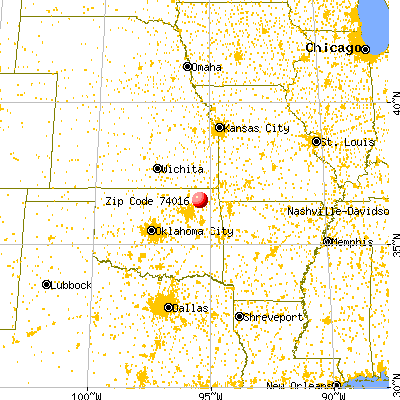
Land area: 149.8 sq. mi. Water area: 0.3 sq. mi.
Population density: 39 people per square mile
(very low).
OSM Map
General Map
Google Map
MSN Map
OSM Map
General Map
Google Map
MSN Map
OSM Map
General Map
Google Map
MSN Map
OSM Map
General Map
Google Map
MSN Map
Please wait while loading the map...
Real estate property taxes paid for housing units in 2022:
This zip code:
0.6% ($770)
Oklahoma:
0.8% ($1,501)
Median real estate property taxes paid for housing units with mortgages in 2022: $1,210 (0.8%) Median real estate property taxes paid for housing units with no mortgage in 2022: $619 (0.6%)
Business Search- 14 Million verified businesses
Males: 2,805
(48.6%)
Females: 2,965
(51.4%)
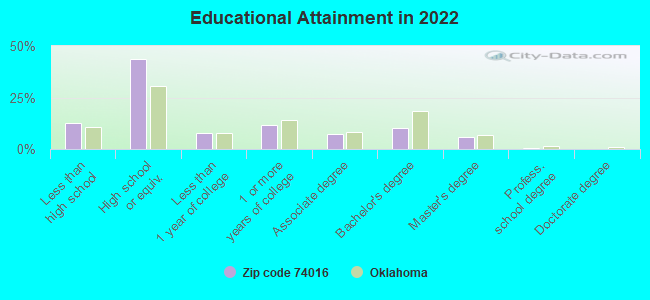
For population 25 years and over in 74016:
High school or higher: 86.6%
Bachelor's degree or higher: 16.7%
Graduate or professional degree: 6.6%
Unemployed: 8.9%
Mean travel time to work (commute): 35.5 minutes
For population 15 years and over in 74016:
Never married: 26.0%
Now married: 51.2%
Separated: 1.2%
Widowed: 6.4%
Divorced: 15.3%
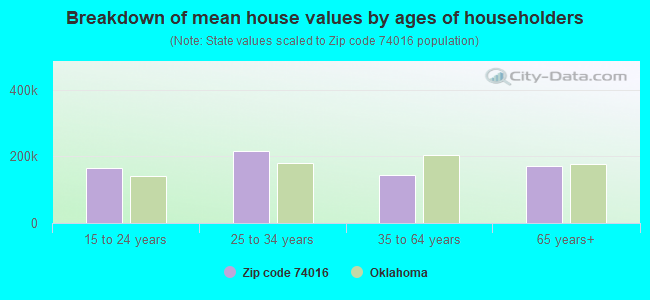
Zip code 74016 compared to state average:
Median house value below state average.
Unemployed percentage above state average.
Black race population percentage significantly below state average.
Hispanic race population percentage significantly below state average.
Foreign-born population percentage significantly below state average.
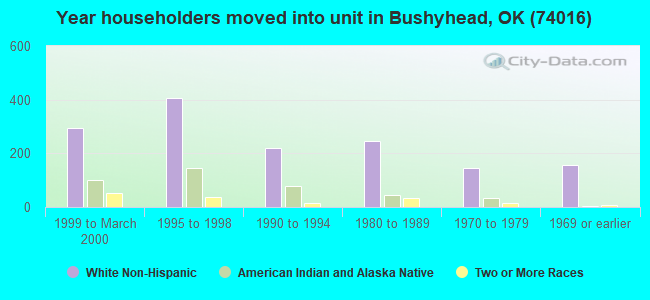
Length of stay since moving in above state average.
Percentage of population with a bachelor's degree or higher below state average.
Averages for the 2020 tax year for zip code 74016, filed in 2021:
Average Adjusted Gross Income (AGI) in 2020: $49,266 (Individual Income Tax Returns)
Here:
$49,266
State:
$63,060
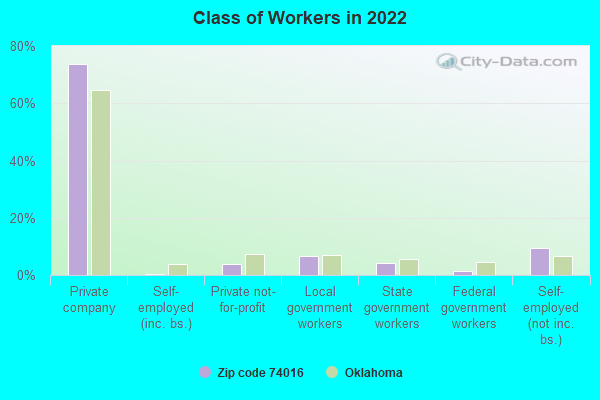
Salary/wage: $43,271 (reported on 82.8% of returns)
Here:
$43,271
State:
$52,427
(% of AGI for various income ranges: 1120.7% for AGIs below $25k, 3487.4% for AGIs $25k-50k, 6179.0% for AGIs $50k-75k, 8845.7% for AGIs $75k-100k, 15462.0% for AGIs $100k-200k)
Taxable interest for individuals: $1,036 (reported on 19.7% of returns)
This zip code:
$1,036
Oklahoma:
$1,603
(% of AGI for various income ranges: 3.9% for AGIs below $25k, 10.0% for AGIs $25k-50k, 24.5% for AGIs $50k-75k, 70.7% for AGIs $75k-100k, 155.3% for AGIs $100k-200k)
Ordinary dividends: $3,240 (reported on 6.3% of returns)
Here:
$3,240
State:
$7,001
(% of AGI for various income ranges: 2.3% for AGIs below $25k, 16.0% for AGIs $25k-50k, 34.8% for AGIs $50k-75k, 185.3% for AGIs $100k-200k)
Net capital gain/loss in AGI: +$8,200 (reported on 6.7% of returns)
Here:
+$8,200
State:
+$19,855
(% of AGI for various income ranges: 11.9% for AGIs $25k-50k, 19.3% for AGIs $50k-75k, 144.3% for AGIs $75k-100k, 669.3% for AGIs $100k-200k)
Profit/loss from business: +$9,076 (reported on 15.5% of returns)
Here:
+$9,076
State:
+$9,904
(% of AGI for various income ranges: 123.2% for AGIs below $25k, 196.0% for AGIs $25k-50k, 220.0% for AGIs $50k-75k, 511.4% for AGIs $75k-100k, 24.7% for AGIs $100k-200k)
Taxable individual retirement arrangement distribution: $20,450 (reported on 6.7% of returns)
74016:
$20,450
Oklahoma:
$20,476
(% of AGI for various income ranges: 39.3% for AGIs below $25k, 48.1% for AGIs $25k-50k, 314.8% for AGIs $50k-75k, 1209.3% for AGIs $100k-200k)
Total itemized deductions: $33,867 (reported on 2.5% of returns)
Here:
$33,867
State:
$39,736
(% of AGI for various income ranges: 240.3% for AGIs $50k-75k, 890.0% for AGIs $100k-200k)
Charity contributions: $10,775 (reported on 1.7% of returns)
Here:
$10,775
State:
$17,288
(% of AGI for various income ranges: 287.3% for AGIs $100k-200k)
Taxes paid: $5,157 (reported on 2.9% of returns)
74016:
$5,157
State:
$7,046
(% of AGI for various income ranges: 36.6% for AGIs $50k-75k, 170.0% for AGIs $100k-200k)
Earned income credit: $2,560 (reported on 23.8% of returns)
Here:
$2,560
State:
$2,435
(% of AGI for various income ranges: 127.1% for AGIs below $25k, 102.1% for AGIs $25k-50k)
Percentage of individuals using paid preparers for their 2020 taxes: 94.1%
Here:
94%
State:
94%
(% for various income ranges: 95.3% for AGIs below $25k, 94.3% for AGIs $25k-50k, 92.1% for AGIs $50k-75k, 94.7% for AGIs $75k-100k, 91.3% for AGIs $100k-200k, 100.0% for AGIs over 200k)
Averages for the 2012 tax year for zip code 74016, filed in 2013:
Average Adjusted Gross Income (AGI) in 2012: $40,841 (Individual Income Tax Returns)
Here:
$40,841
State:
$58,581
Salary/wage: $38,313 (reported on 85.8% of returns)
Here:
$38,313
State:
$45,973
(% of AGI for various income ranges: 74.5% for AGIs below $25k, 84.9% for AGIs $25k-50k, 81.4% for AGIs $50k-75k, 88.9% for AGIs $75k-100k, 71.5% for AGIs $100k-200k)
Taxable interest for individuals: $812 (reported on 22.7% of returns)
This zip code:
$812
Oklahoma:
$1,625
(% of AGI for various income ranges: 0.9% for AGIs below $25k, 0.3% for AGIs $25k-50k, 0.2% for AGIs $50k-75k, 0.2% for AGIs $75k-100k, 0.8% for AGIs $100k-200k)
Ordinary dividends: $1,206 (reported on 7.1% of returns)
Here:
$1,206
State:
$6,374
(% of AGI for various income ranges: 0.4% for AGIs below $25k, 0.3% for AGIs $50k-75k, 0.1% for AGIs $75k-100k, 0.3% for AGIs $100k-200k)
Net capital gain/loss in AGI: +$5,187 (reported on 6.7% of returns)
Here:
+$5,187
State:
+$24,023
(% of AGI for various income ranges: 0.3% for AGIs below $25k, 0.3% for AGIs $25k-50k, 0.3% for AGIs $50k-75k, 0.1% for AGIs $75k-100k, 2.8% for AGIs $100k-200k)
Profit/loss from business: +$7,653 (reported on 16.9% of returns)
Here:
+$7,653
State:
+$11,913
(% of AGI for various income ranges: 10.5% for AGIs below $25k, 3.9% for AGIs $25k-50k, 2.8% for AGIs $50k-75k, 1.2% for AGIs $75k-100k)
Taxable individual retirement arrangement distribution: $10,383 (reported on 5.3% of returns)
74016:
$10,383
Oklahoma:
$15,242
(% of AGI for various income ranges: 2.0% for AGIs below $25k, 2.5% for AGIs $25k-50k, 2.7% for AGIs $75k-100k)
Total itemized deductions: $18,000 (23% of AGI, reported on 17.3% of returns)
Here:
$18,000
State:
$24,882
Here:
22.7% of AGI
State:
18.8% of AGI
(% of AGI for various income ranges: 4.1% for AGIs below $25k, 5.3% for AGIs $25k-50k, 7.6% for AGIs $50k-75k, 8.5% for AGIs $75k-100k, 11.7% for AGIs $100k-200k)
Charity contributions: $3,817 (reported on 13.3% of returns)
Here:
$3,817
State:
$6,591
(% of AGI for various income ranges: 0.5% for AGIs below $25k, 1.1% for AGIs $25k-50k, 1.2% for AGIs $50k-75k, 1.5% for AGIs $75k-100k, 1.7% for AGIs $100k-200k)
Taxes paid: $4,054 (reported on 17.3% of returns)
74016:
$4,054
State:
$7,196
(% of AGI for various income ranges: 0.4% for AGIs below $25k, 0.8% for AGIs $25k-50k, 1.5% for AGIs $50k-75k, 2.1% for AGIs $75k-100k, 3.4% for AGIs $100k-200k)
Earned income credit: $2,290 (reported on 27.6% of returns)
Here:
$2,290
State:
$2,354
(% of AGI for various income ranges: 8.4% for AGIs below $25k, 1.8% for AGIs $25k-50k)
Percentage of individuals using paid preparers for their 2012 taxes: 61.3%
Here:
61%
State:
56%
(% for various income ranges: 56.8% for AGIs below $25k, 58.5% for AGIs $25k-50k, 70.6% for AGIs $50k-75k, 66.7% for AGIs $75k-100k, 76.9% for AGIs $100k-200k)
Averages for the 2004 tax year for zip code 74016, filed in 2005:
Average Adjusted Gross Income (AGI) in 2004: $31,293 (Individual Income Tax Returns)
Here:
$31,293
State:
$41,245
Salary/wage: $31,585 (reported on 86.9% of returns)
Here:
$31,585
State:
$35,318
(% of AGI for various income ranges: 165.1% for AGIs below $10k, 81.7% for AGIs $10k-25k, 87.9% for AGIs $25k-50k, 89.4% for AGIs $50k-75k, 86.0% for AGIs $75k-100k, 79.1% for AGIs over 100k)
Taxable interest for individuals: $1,004 (reported on 30.8% of returns)
This zip code:
$1,004
Oklahoma:
$1,745
(% of AGI for various income ranges: 4.3% for AGIs below $10k, 2.4% for AGIs $10k-25k, 0.8% for AGIs $25k-50k, 0.4% for AGIs $50k-75k, 0.7% for AGIs $75k-100k, 0.6% for AGIs over 100k)
Taxable dividends: $754 (reported on 8.6% of returns)
Here:
$754
State:
$2,920
(% of AGI for various income ranges: 0.2% for AGIs below $10k, 0.2% for AGIs $10k-25k, 0.2% for AGIs $25k-50k, 0.1% for AGIs $50k-75k, 0.5% for AGIs $75k-100k, 0.2% for AGIs over 100k)
Net capital gain/loss: +$3,173 (reported on 8.6% of returns)
Here:
+$3,173
State:
+$10,653
(% of AGI for various income ranges: 8.2% for AGIs below $10k, 0.5% for AGIs $10k-25k, 0.9% for AGIs $25k-50k, 1.3% for AGIs $50k-75k, 0.0% for AGIs $75k-100k, 0.4% for AGIs over 100k)
Profit/loss from business: +$4,550 (reported on 18.8% of returns)
Here:
+$4,550
State:
+$8,532
(% of AGI for various income ranges: 6.4% for AGIs below $10k, 7.3% for AGIs $10k-25k, 2.5% for AGIs $25k-50k, 0.9% for AGIs $50k-75k, 2.3% for AGIs $75k-100k)
IRA payment deduction: $2,520 (reported on 1.1% of returns)
74016:
$2,520
Oklahoma:
$3,127
Total itemized deductions: $13,947 (25% of AGI, reported on 24.8% of returns)
Here:
$13,947
State:
$17,093
Here:
24.6% of AGI
State:
20.5% of AGI
(% of AGI for various income ranges: 10.3% for AGIs below $10k, 7.8% for AGIs $10k-25k, 8.7% for AGIs $25k-50k, 13.0% for AGIs $50k-75k, 15.0% for AGIs $75k-100k, 14.5% for AGIs over 100k)
Charity contributions deductions: $2,769 (5% of AGI, reported on 19.9% of returns)
Here:
$2,769
State:
$4,240
Here:
4.6% of AGI
State:
4.8% of AGI
(% of AGI for various income ranges: 1.2% for AGIs $10k-25k, 1.4% for AGIs $25k-50k, 2.1% for AGIs $50k-75k, 2.3% for AGIs $75k-100k, 2.9% for AGIs over 100k)
Total tax: $3,190 (reported on 69.1% of returns)
74016:
$3,190
State:
$6,542
(% of AGI for various income ranges: 4.6% for AGIs below $10k, 3.7% for AGIs $10k-25k, 5.7% for AGIs $25k-50k, 7.5% for AGIs $50k-75k, 10.4% for AGIs $75k-100k, 12.5% for AGIs over 100k)
Earned income credit: $1,911 (reported on 24.5% of returns)
Here:
$1,911
State:
$1,830
Percentage of individuals using paid preparers for their 2004 taxes: 67.7%
Here:
68%
State:
63%
(% for various income ranges: 62.8% for AGIs below $10k, 71.2% for AGIs $10k-25k, 65.4% for AGIs $25k-50k, 68.3% for AGIs $50k-75k, 75.8% for AGIs $75k-100k, 75.0% for AGIs over 100k)
Likely homosexual households (counted as self-reported same-sex unmarried-partner households)
Lesbian couples: 0.7% of all households
Gay men: 0.0% of all households
Household received Food Stamps/SNAP in the past 12 months: 544 Household did not receive Food Stamps/SNAP in the past 12 months: 1,762
Women who had a birth in the past 12 months: 112 (114 now married, 0 unmarried) Women who did not have a birth in the past 12 months: 1,310 (557 now married, 752 unmarried)
Housing units in zip code 74016 with a mortgage: 750 (24 second mortgage, 1 home equity loan, 2 both second mortgage and home equity loan) Median monthly owner costs for units with a mortgage: $1,207 Median monthly owner costs for units without a mortgage: $405
Residents with income below the poverty level in 2022:
This zip code:
18.4%
Whole state:
15.7%
Residents with income below 50% of the poverty level in 2022:
This zip code:
9.0%
Whole state:
8.3%
Median number of rooms in houses and condos:
Here:
5.7
State:
6.1
Median number of rooms in apartments:
Here:
4.9
State:
4.5
Notable locations in this zip code not listed on our city pages
Notable locations in zip code 74016: Happy Hollow Community Center (A), Chelsea Fire Department (B), Foyil Fire Protection District Station 2 (C), New Alluwe Fire Department (D), Bowlin Springs Fire Department (E). Display/hide their locations on the map
Churches in zip code 74016 include: Good Hope Church (A), United Pentecostal Church (B), First Baptist Church (C), Chelsea Memorial United Methodist Church (D), Fairview Church (E), Winganon Church (F). Display/hide their locations on the map
Cemeteries: Winganon Cemetery (1), Beck Cemetery (2), Chelsea Cemetery (3), Dawes Cemetery (4), Shady Grove Cemetery (5), Snider Cemetery (6). Display/hide their locations on the map
Reservoirs: Chelsea Reservoir (A), Pryor Creek Number 15 Reservoir (B), Pryor Creek Number 20 Reservoir (C), Oknoname 131010 Reservoir (D), Pryor Creek Watershed Site 19 Reservoir (E), Pryor Creek Watershed Site 24 Reservoir (F), Chelsea Reservoir Number 1 (G), Chelsea Reservoir Number 2 (H). Display/hide their locations on the map
Size of family households: 619 2-persons, 362 3-persons, 257 4-persons, 149 5-persons, 40 6-persons, 58 7-or-more-persons
Size of nonfamily households: 572 1-person, 227 2-persons
741 married couples with children.
320 single-parent households (106 men, 214 women).
97.6% of residents of 74016 zip code speak English at home.
0.7% of residents speak Spanish at home (94% very well, 6% well).
0.2% of residents speak other Indo-European language at home (100% very well).
0.6% of residents speak Asian or Pacific Island language at home (100% very well).
0.8% of residents speak other language at home (98% very well, 2% well).
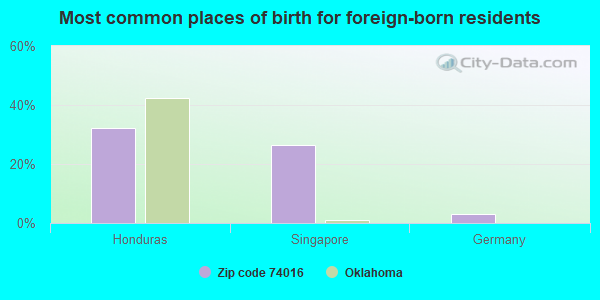
Foreign born population: 34 (0.6%) (83.0% of them are naturalized citizens)
This zip code:
0.6%
Whole state:
6.0%
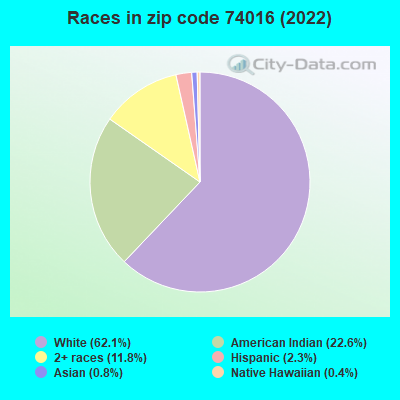
32%Honduras
26%Singapore
3%Germany
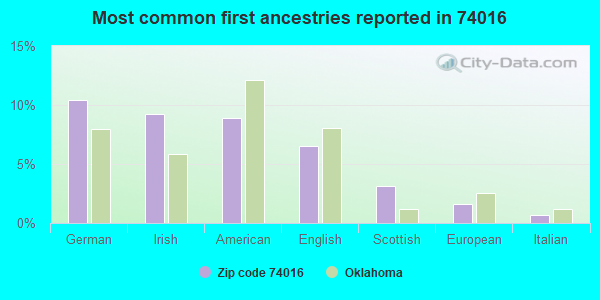
10%German
9%Irish
9%American
7%English
3%Scottish
2%European
1%Italian
Year of entry for the foreign-born population
42010 or later
22000 to 2009
331990 to 1999
12Before 1990
Facilities with environmental interests located in this zip code:
ART GOAD IES (117 ASH STREET in CHELSEA, OK)
(National Center for Education Statistics) - STATE ID-66-I003-110 Organizations: CHELSEA (SCHOOL DISTRICT)
CHELSEA HS (801 WEST 6TH STREET in CHELSEA, OK)
(National Center for Education Statistics) - STATE ID-66-I003-705
CHELSEA JHS (801 W 6 in CHELSEA, OK)
(National Center for Education Statistics) - STATE ID-66-I003-610
MCINTOSH ES (426 WEST 10TH in CHELSEA, OK)
(National Center for Education Statistics) - STATE ID-66-I003-105 Organizations: CHELSEA (SCHOOL DISTRICT)
AAA QUALITY GALVINIZING (6022 S INDUSTRIAL RD in CHELSEA, OK)
Large Quantity Generators, more that 1000 kg of hazardous waste/month (Resource Conservation and Recovery Act (tracking hazardous waste))
AAA QUALITY GALVANI/CHELSEA FACILITY (6022 S INDUSTRIAL RD in CHELSEA, OK)
AIR MINOR (AIRS/AFS) Business SIC classification: COATING, ENGRAVING, AND ALLIED SERVICES Alternative names: QUALITY GALVANIZING/CHELSEA FACILITY
ALLUWE PUBLIC SCHOOLS (RT 3 BOX 230 in CHELSEA, OK)
COMPLIANCE ACTIVITY (Tracking inspections of insecticide, fungicide, and rodenticide, and toxic substances)
CHELSEA PUBLIC SCHOOL (306 W 6TH ST in CHELSEA, OK)
COMPLIANCE ACTIVITY (Tracking inspections of insecticide, fungicide, and rodenticide, and toxic substances)
FM HOEL TANK BATTERY OIL SPILL (1 MILE SOUTH OF WINGANON in WINGANON, OK)
SUPERFUND (Superfund database)
Housing units lacking complete plumbing facilities: 4.9% Housing units lacking complete kitchen facilities: 7.1%
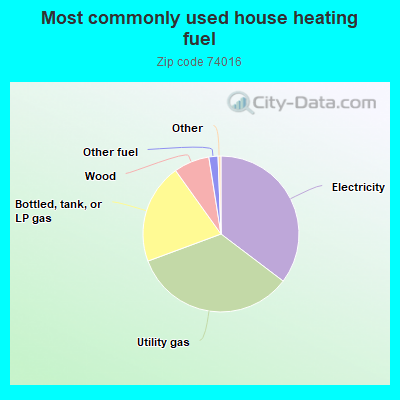
35.4%Electricity
34.1%Utility gas
20.8%Bottled, tank, or LP gas
7.4%Wood
1.9%Other fuel
Population in 1990: 3,789. Population change in the 1990s: +1,755 (+46.3%).
Place of birth for U.S.-born residents:
This state: 4,186
Northeast: 90
Midwest: 497
South: 414
West: 519
53% of the 74016 zip code residents lived in the same house 5 years ago. Out of people who lived in different houses, 54% lived in this county. Out of people who lived in different counties, 50% lived in Oklahoma.
91% of the 74016 zip code residents lived in the same house 1 year ago. Out of people who lived in different houses, 49% moved from this county. Out of people who lived in different houses, 41% moved from different county within same state. Out of people who lived in different houses, 9% moved from different state. Out of people who lived in different houses, 2% moved from abroad.
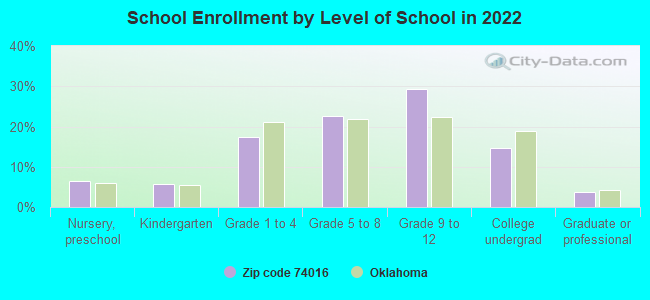
Private vs. public school enrollment:
Students in private schools in grades 1 to 8 (elementary and middle school): 18
Here:
4.1%
Oklahoma:
11.7%
Students in private schools in grades 9 to 12 (high school): 41
Here:
12.6%
Oklahoma:
11.7%
Students in private undergraduate colleges: 25
Here:
15.5%
Oklahoma:
19.3%
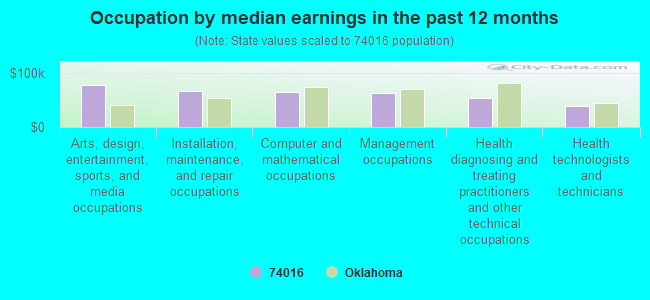
Occupation by median earnings in the past 12 months ($)
78,193Arts, design, entertainment, sports, and media occupations
67,135Installation, maintenance, and repair occupations
65,976Computer and mathematical occupations
62,462Management occupations
54,672Health diagnosing and treating practitioners and other technical occupations
39,427Health technologists and technicians
Top industries in this zip code by the number of employees in 2005:
Health Care and Social Assistance: Services for the Elderly and Persons with Disabilities (50-99 employees: 1 establishment, 1-4 employees: 1 establishment)
Health Care and Social Assistance: Nursing Care Facilities (20-49: 1)
Health Care and Social Assistance: Other Individual and Family Services (20-49: 1)
Health Care and Social Assistance: Vocational Rehabilitation Services (20-49: 1)
Construction: Roofing Contractors (20-49: 1)
Finance and Insurance: Commercial Banking (10-19: 2)
Construction: Site Preparation Contractors (10-19: 1, 5-9: 1)
People in group quarters in 2000:
41 people in nursing homes
Fatal accident statistics in 2014:
Fatal accident count: 2
Vehicles involved in fatal accidents: 4
Fatal accidents caused by drunken drivers: 0
Fatalities: 2
Persons involved in fatal accidents: 4
Pedestrians involved in fatal accidents: 0
Fatal accident statistics in 2011:
Fatal accident count: 1
Vehicles involved in fatal accidents: 1
Fatal accidents caused by drunken drivers: 1
Fatalities: 1
Persons involved in fatal accidents: 1
Pedestrians involved in fatal accidents: 0
Home Mortgage Disclosure Act Aggregated Statistics For Year 2009 (Based on 1 full and 4 partial tracts)
A) FHA, FSA/RHS & VA Home Purchase Loans
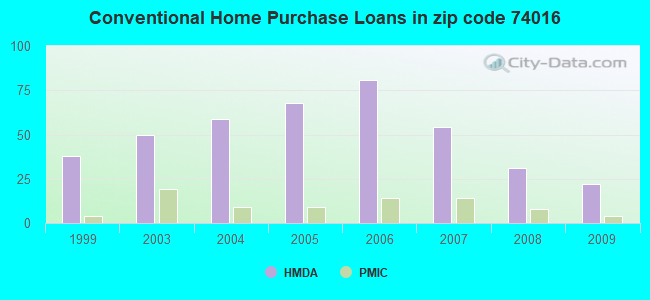
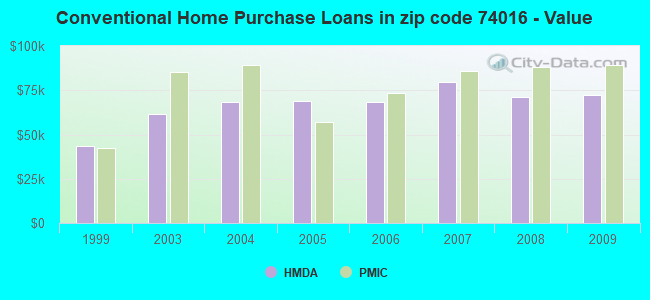
B) Conventional Home Purchase Loans
C) Refinancings
D) Home Improvement Loans
E) Loans on Dwellings For 5+ Families
F) Non-occupant Loans on < 5 Family Dwellings (A B C & D)
G) Loans On Manufactured Home Dwelling (A B C & D)
Number
Average Value
Number
Average Value
Number
Average Value
Number
Average Value
Number
Average Value
Number
Average Value
Number
Average Value
LOANS ORIGINATED
28
$105,738
22
$72,205
73
$120,835
19
$46,509
1
$240,000
8
$46,269
26
$63,336
APPLICATIONS APPROVED, NOT ACCEPTED
2
$75,865
2
$174,690
15
$87,077
1
$42,000
0
$0
0
$0
7
$63,043
APPLICATIONS DENIED
6
$84,547
17
$63,611
47
$111,918
13
$24,161
0
$0
1
$43,060
19
$76,865
APPLICATIONS WITHDRAWN
4
$87,345
3
$71,693
32
$130,047
3
$51,233
0
$0
1
$15,000
1
$172,230
FILES CLOSED FOR INCOMPLETENESS
1
$147,620
0
$0
4
$99,762
1
$135,000
0
$0
0
$0
0
$0
Aggregated Statistics For Year 2008 (Based on 1 full and 4 partial tracts)
A) FHA, FSA/RHS & VA Home Purchase Loans
B) Conventional Home Purchase Loans
C) Refinancings
D) Home Improvement Loans
E) Loans on Dwellings For 5+ Families
F) Non-occupant Loans on < 5 Family Dwellings (A B C & D)
G) Loans On Manufactured Home Dwelling (A B C & D)
Number
Average Value
Number
Average Value
Number
Average Value
Number
Average Value
Number
Average Value
Number
Average Value
Number
Average Value
LOANS ORIGINATED
18
$109,985
31
$71,312
72
$109,392
8
$19,551
1
$98,000
13
$69,030
17
$57,452
APPLICATIONS APPROVED, NOT ACCEPTED
2
$78,735
5
$62,306
3
$107,590
6
$13,768
0
$0
1
$65,200
6
$41,497
APPLICATIONS DENIED
2
$72,500
22
$71,894
54
$113,451
23
$41,260
0
$0
5
$81,560
26
$70,806
APPLICATIONS WITHDRAWN
5
$99,268
8
$56,656
16
$115,635
8
$69,306
0
$0
3
$44,147
4
$64,300
FILES CLOSED FOR INCOMPLETENESS
1
$86,000
1
$77,500
4
$69,970
2
$12,410
0
$0
0
$0
1
$77,500
Aggregated Statistics For Year 2007 (Based on 1 full and 4 partial tracts)
A) FHA, FSA/RHS & VA Home Purchase Loans
B) Conventional Home Purchase Loans
C) Refinancings
D) Home Improvement Loans
F) Non-occupant Loans on < 5 Family Dwellings (A B C & D)
G) Loans On Manufactured Home Dwelling (A B C & D)
Number
Average Value
Number
Average Value
Number
Average Value
Number
Average Value
Number
Average Value
Number
Average Value
LOANS ORIGINATED
23
$86,455
54
$79,442
58
$80,516
29
$37,530
14
$43,775
30
$62,376
APPLICATIONS APPROVED, NOT ACCEPTED
1
$24,900
16
$60,674
17
$101,057
3
$8,423
1
$35,680
9
$57,080
APPLICATIONS DENIED
5
$74,988
34
$64,248
65
$85,288
50
$40,299
3
$64,460
25
$56,940
APPLICATIONS WITHDRAWN
1
$66,430
4
$48,285
30
$87,417
8
$75,934
1
$49,210
2
$75,810
FILES CLOSED FOR INCOMPLETENESS
0
$0
1
$139,010
5
$93,150
0
$0
0
$0
0
$0
Aggregated Statistics For Year 2006 (Based on 1 full and 4 partial tracts)
A) FHA, FSA/RHS & VA Home Purchase Loans
B) Conventional Home Purchase Loans
C) Refinancings
D) Home Improvement Loans
E) Loans on Dwellings For 5+ Families
F) Non-occupant Loans on < 5 Family Dwellings (A B C & D)
G) Loans On Manufactured Home Dwelling (A B C & D)
Number
Average Value
Number
Average Value
Number
Average Value
Number
Average Value
Number
Average Value
Number
Average Value
Number
Average Value
LOANS ORIGINATED
16
$88,134
81
$68,623
67
$81,049
19
$36,767
1
$240,000
17
$55,414
29
$49,916
APPLICATIONS APPROVED, NOT ACCEPTED
1
$62,240
20
$76,390
14
$95,137
2
$14,225
0
$0
0
$0
14
$63,579
APPLICATIONS DENIED
3
$73,167
44
$50,679
103
$84,616
21
$44,508
0
$0
2
$36,500
41
$62,470
APPLICATIONS WITHDRAWN
7
$74,287
13
$64,516
58
$93,225
1
$39,120
0
$0
0
$0
6
$85,090
FILES CLOSED FOR INCOMPLETENESS
1
$78,730
6
$116,585
11
$92,729
1
$18,450
0
$0
1
$52,000
0
$0
Aggregated Statistics For Year 2005 (Based on 1 full and 4 partial tracts)
A) FHA, FSA/RHS & VA Home Purchase Loans
B) Conventional Home Purchase Loans
C) Refinancings
D) Home Improvement Loans
F) Non-occupant Loans on < 5 Family Dwellings (A B C & D)
G) Loans On Manufactured Home Dwelling (A B C & D)
Number
Average Value
Number
Average Value
Number
Average Value
Number
Average Value
Number
Average Value
Number
Average Value
LOANS ORIGINATED
22
$93,002
68
$68,845
96
$90,112
18
$55,457
9
$61,523
39
$64,300
APPLICATIONS APPROVED, NOT ACCEPTED
2
$64,895
30
$58,894
23
$76,728
3
$59,333
1
$85,960
26
$55,293
APPLICATIONS DENIED
8
$83,395
56
$59,271
106
$78,199
28
$29,476
6
$46,715
52
$48,785
APPLICATIONS WITHDRAWN
2
$45,685
10
$58,762
82
$96,351
9
$49,296
2
$85,160
6
$86,020
FILES CLOSED FOR INCOMPLETENESS
2
$52,355
4
$72,132
10
$90,610
0
$0
0
$0
0
$0
Aggregated Statistics For Year 2004 (Based on 1 full and 4 partial tracts)
A) FHA, FSA/RHS & VA Home Purchase Loans
B) Conventional Home Purchase Loans
C) Refinancings
D) Home Improvement Loans
F) Non-occupant Loans on < 5 Family Dwellings (A B C & D)
G) Loans On Manufactured Home Dwelling (A B C & D)
Number
Average Value
Number
Average Value
Number
Average Value
Number
Average Value
Number
Average Value
Number
Average Value
LOANS ORIGINATED
18
$74,802
59
$68,144
100
$79,699
25
$28,448
11
$44,502
38
$52,936
APPLICATIONS APPROVED, NOT ACCEPTED
0
$0
16
$60,453
31
$80,546
4
$33,842
2
$36,605
20
$53,250
APPLICATIONS DENIED
7
$101,809
50
$48,405
120
$84,102
21
$33,948
6
$35,060
52
$50,683
APPLICATIONS WITHDRAWN
1
$49,000
6
$80,498
54
$80,626
2
$49,210
0
$0
8
$49,160
FILES CLOSED FOR INCOMPLETENESS
1
$37,000
0
$0
4
$109,260
1
$62,000
0
$0
0
$0
Aggregated Statistics For Year 2003 (Based on 1 full and 4 partial tracts)
A) FHA, FSA/RHS & VA Home Purchase Loans
B) Conventional Home Purchase Loans
C) Refinancings
D) Home Improvement Loans
F) Non-occupant Loans on < 5 Family Dwellings (A B C & D)
Number
Average Value
Number
Average Value
Number
Average Value
Number
Average Value
Number
Average Value
LOANS ORIGINATED
17
$83,470
50
$61,414
170
$84,317
22
$27,334
26
$59,068
APPLICATIONS APPROVED, NOT ACCEPTED
0
$0
14
$55,719
21
$92,001
2
$7,885
2
$36,940
APPLICATIONS DENIED
2
$107,505
30
$42,678
111
$79,380
16
$14,279
3
$69,410
APPLICATIONS WITHDRAWN
0
$0
9
$55,490
65
$88,043
1
$47,980
1
$24,000
FILES CLOSED FOR INCOMPLETENESS
1
$64,020
1
$64,000
11
$68,521
0
$0
0
$0
Aggregated Statistics For Year 1999 (Based on 1 partial tract)
A) FHA, FSA/RHS & VA Home Purchase Loans
B) Conventional Home Purchase Loans
C) Refinancings
D) Home Improvement Loans
F) Non-occupant Loans on < 5 Family Dwellings (A B C & D)
2002 - 2018 National Fire Incident Reporting System (NFIRS) incidents
According to the data from the years 2002 - 2018 the average number of fires per year is 61. The highest number of fires - 111 took place in 2009, and the least - 7 in 2003. The data has a growing trend.
When looking into fire subcategories, the most incidents belonged to: Outside Fires (67.0%), and Structure Fires (22.7%).
Fire incident types reported to NFIRS in Zip Code 74016


 Nearest zip codes: 74017, 74330, 74332, 74048, 74301, 74027.


 According to the data from the years 2002 - 2018 the average number of fires per year is 61. The highest number of fires - 111 took place in 2009, and the least - 7 in 2003. The data has a growing trend.
 When looking into fire subcategories, the most incidents belonged to: Outside Fires (67.0%), and Structure Fires (22.7%).