Estimated zip code population in 2022: 4,134 Zip code population in 2010: 3,770 Zip code population in 2000: 3,105
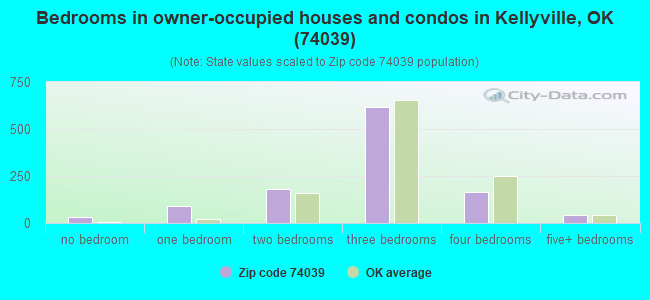
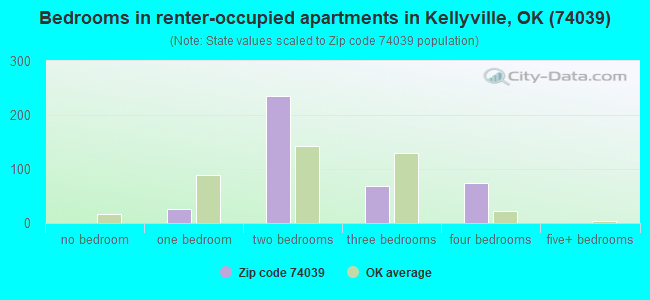
Houses and condos: 1,722 Renter-occupied apartments: 407
% of renters here:
27%
State:
35%
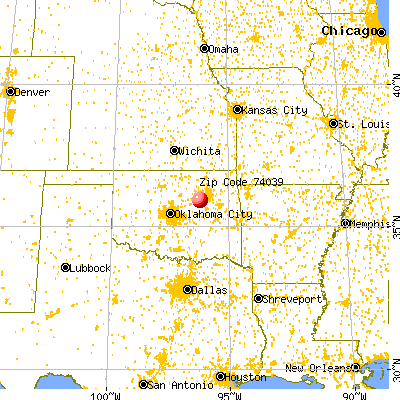
March 2022 cost of living index in zip code 74039: 79.6 (low, U.S. average is 100)
Land area: 65.4 sq. mi. Water area: 1.0 sq. mi.
Population density: 63 people per square mile
(very low).
OSM Map
General Map
Google Map
MSN Map
OSM Map
General Map
Google Map
MSN Map
OSM Map
General Map
Google Map
MSN Map
OSM Map
General Map
Google Map
MSN Map
Please wait while loading the map...
Real estate property taxes paid for housing units in 2022:
This zip code:
0.6% ($1,058)
Oklahoma:
0.8% ($1,501)
Median real estate property taxes paid for housing units with mortgages in 2022: $1,360 (0.7%) Median real estate property taxes paid for housing units with no mortgage in 2022: $653 (0.5%)
Business Search- 14 Million verified businesses
Males: 2,122
(51.3%)
Females: 2,012
(48.7%)
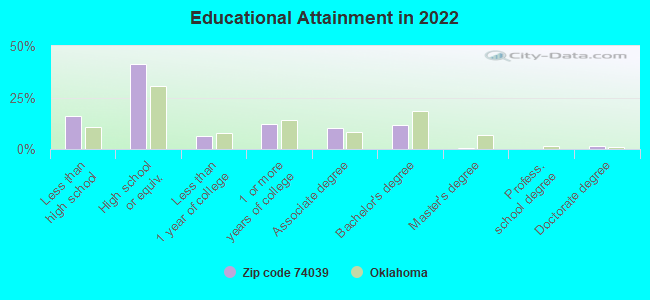
For population 25 years and over in 74039:
High school or higher: 82.6%
Bachelor's degree or higher: 13.6%
Graduate or professional degree: 2.1%
Unemployed: 1.7%
Mean travel time to work (commute): 30.4 minutes
For population 15 years and over in 74039:
Never married: 24.0%
Now married: 54.7%
Separated: 2.3%
Widowed: 5.3%
Divorced: 13.7%
Zip code 74039 compared to state average:
Unemployed percentage below state average.
Black race population percentage significantly below state average.
Hispanic race population percentage below state average.
Foreign-born population percentage significantly below state average.
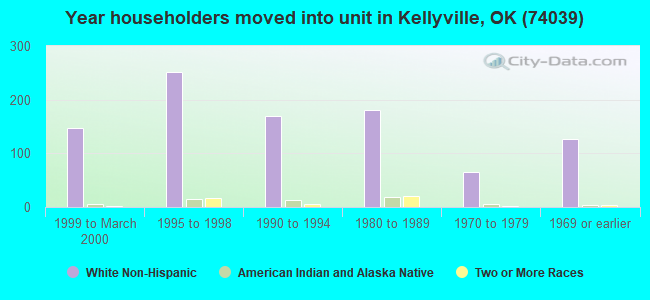
Length of stay since moving in significantly above state average.
Number of college students below state average.
Percentage of population with a bachelor's degree or higher below state average.
Averages for the 2020 tax year for zip code 74039, filed in 2021:
Average Adjusted Gross Income (AGI) in 2020: $51,541 (Individual Income Tax Returns)
Here:
$51,541
State:
$63,060
Salary/wage: $49,856 (reported on 81.9% of returns)
Here:
$49,856
State:
$52,427
(% of AGI for various income ranges: 1165.3% for AGIs below $25k, 3651.7% for AGIs $25k-50k, 6764.3% for AGIs $50k-75k, 8610.0% for AGIs $75k-100k, 17975.8% for AGIs $100k-200k)
Taxable interest for individuals: $513 (reported on 24.5% of returns)
This zip code:
$513
Oklahoma:
$1,603
(% of AGI for various income ranges: 9.5% for AGIs below $25k, 4.9% for AGIs $25k-50k, 8.1% for AGIs $50k-75k, 14.2% for AGIs $75k-100k, 90.0% for AGIs $100k-200k)
Ordinary dividends: $1,517 (reported on 7.7% of returns)
Here:
$1,517
State:
$7,001
(% of AGI for various income ranges: 10.8% for AGIs below $25k, 10.5% for AGIs $50k-75k, 99.2% for AGIs $100k-200k)
Net capital gain/loss in AGI: +$6,869 (reported on 8.4% of returns)
Here:
+$6,869
State:
+$19,855
(% of AGI for various income ranges: 16.1% for AGIs below $25k, 20.0% for AGIs $25k-50k, 85.2% for AGIs $50k-75k, 485.8% for AGIs $100k-200k)
Profit/loss from business: +$7,692 (reported on 16.1% of returns)
Here:
+$7,692
State:
+$9,904
(% of AGI for various income ranges: 188.4% for AGIs below $25k, 126.6% for AGIs $25k-50k, 143.8% for AGIs $50k-75k, 385.0% for AGIs $100k-200k)
Taxable individual retirement arrangement distribution: $23,490 (reported on 6.5% of returns)
74039:
$23,490
Oklahoma:
$20,476
(% of AGI for various income ranges: 124.2% for AGIs below $25k, 235.2% for AGIs $50k-75k, 1152.5% for AGIs $100k-200k)
Total itemized deductions: $28,150 (reported on 3.9% of returns)
Here:
$28,150
State:
$39,736
(% of AGI for various income ranges: 156.0% for AGIs $25k-50k, 952.5% for AGIs $100k-200k)
Charity contributions: $9,375 (reported on 2.6% of returns)
Here:
$9,375
State:
$17,288
(% of AGI for various income ranges: 312.5% for AGIs $100k-200k)
Taxes paid: $5,450 (reported on 3.9% of returns)
74039:
$5,450
State:
$7,046
(% of AGI for various income ranges: 21.7% for AGIs $25k-50k, 209.2% for AGIs $100k-200k)
Earned income credit: $2,478 (reported on 20.6% of returns)
Here:
$2,478
State:
$2,435
(% of AGI for various income ranges: 115.8% for AGIs below $25k, 100.9% for AGIs $25k-50k)
Percentage of individuals using paid preparers for their 2020 taxes: 96.1%
Here:
96%
State:
94%
(% for various income ranges: 96.1% for AGIs below $25k, 95.3% for AGIs $25k-50k, 96.3% for AGIs $50k-75k, 93.3% for AGIs $75k-100k, 100.0% for AGIs $100k-200k, 100.0% for AGIs over 200k)
Averages for the 2012 tax year for zip code 74039, filed in 2013:
Average Adjusted Gross Income (AGI) in 2012: $45,059 (Individual Income Tax Returns)
Here:
$45,059
State:
$58,581
Salary/wage: $43,643 (reported on 86.8% of returns)
Here:
$43,643
State:
$45,973
(% of AGI for various income ranges: 80.5% for AGIs below $25k, 87.7% for AGIs $25k-50k, 86.8% for AGIs $50k-75k, 81.5% for AGIs $75k-100k, 82.1% for AGIs $100k-200k)
Taxable interest for individuals: $385 (reported on 21.7% of returns)
This zip code:
$385
Oklahoma:
$1,625
(% of AGI for various income ranges: 0.5% for AGIs below $25k, 0.1% for AGIs $25k-50k, 0.1% for AGIs $50k-75k, 0.2% for AGIs $100k-200k)
Ordinary dividends: $2,825 (reported on 7.9% of returns)
Here:
$2,825
State:
$6,374
(% of AGI for various income ranges: 0.7% for AGIs below $25k, 0.1% for AGIs $50k-75k, 1.3% for AGIs $100k-200k)
Net capital gain/loss in AGI: +$725 (reported on 5.3% of returns)
Here:
+$725
State:
+$24,023
Profit/loss from business: +$7,168 (reported on 16.4% of returns)
Here:
+$7,168
State:
+$11,913
(% of AGI for various income ranges: 6.8% for AGIs below $25k, 5.4% for AGIs $25k-50k, 1.6% for AGIs $50k-75k, 1.4% for AGIs $100k-200k)
Taxable individual retirement arrangement distribution: $10,500 (reported on 7.2% of returns)
74039:
$10,500
Oklahoma:
$15,242
(% of AGI for various income ranges: 2.5% for AGIs below $25k, 3.2% for AGIs $25k-50k, 5.0% for AGIs $75k-100k)
Total itemized deductions: $17,714 (21% of AGI, reported on 19.1% of returns)
Here:
$17,714
State:
$24,882
Here:
21.2% of AGI
State:
18.8% of AGI
(% of AGI for various income ranges: 6.9% for AGIs $25k-50k, 7.3% for AGIs $50k-75k, 10.3% for AGIs $75k-100k, 9.4% for AGIs $100k-200k)
Charity contributions: $5,063 (reported on 12.5% of returns)
Here:
$5,063
State:
$6,591
(% of AGI for various income ranges: 1.2% for AGIs $25k-50k, 1.3% for AGIs $50k-75k, 2.2% for AGIs $75k-100k, 1.7% for AGIs $100k-200k)
Taxes paid: $4,276 (reported on 19.1% of returns)
74039:
$4,276
State:
$7,196
(% of AGI for various income ranges: 0.5% for AGIs below $25k, 0.9% for AGIs $25k-50k, 1.3% for AGIs $50k-75k, 2.2% for AGIs $75k-100k, 3.1% for AGIs $100k-200k)
Earned income credit: $2,237 (reported on 25.0% of returns)
Here:
$2,237
State:
$2,354
(% of AGI for various income ranges: 8.2% for AGIs below $25k, 1.6% for AGIs $25k-50k)
Percentage of individuals using paid preparers for their 2012 taxes: 57.9%
Here:
58%
State:
56%
(% for various income ranges: 55.0% for AGIs below $25k, 58.5% for AGIs $25k-50k, 56.0% for AGIs $50k-75k, 58.3% for AGIs $75k-100k, 71.4% for AGIs $100k-200k)
Averages for the 2004 tax year for zip code 74039, filed in 2005:
Average Adjusted Gross Income (AGI) in 2004: $31,838 (Individual Income Tax Returns)
Here:
$31,838
State:
$41,245
Salary/wage: $31,817 (reported on 87.9% of returns)
Here:
$31,817
State:
$35,318
(% of AGI for various income ranges: 146.9% for AGIs below $10k, 82.7% for AGIs $10k-25k, 91.8% for AGIs $25k-50k, 86.9% for AGIs $50k-75k, 92.6% for AGIs $75k-100k, 69.1% for AGIs over 100k)
Taxable interest for individuals: $744 (reported on 27.3% of returns)
This zip code:
$744
Oklahoma:
$1,745
(% of AGI for various income ranges: 4.7% for AGIs below $10k, 0.9% for AGIs $10k-25k, 0.9% for AGIs $25k-50k, 0.3% for AGIs $50k-75k, 0.1% for AGIs $75k-100k, 0.1% for AGIs over 100k)
Taxable dividends: $1,211 (reported on 8.9% of returns)
Here:
$1,211
State:
$2,920
(% of AGI for various income ranges: 2.5% for AGIs below $10k, 0.5% for AGIs $10k-25k, 0.4% for AGIs $25k-50k, 0.1% for AGIs $50k-75k, 0.1% for AGIs $75k-100k, 0.4% for AGIs over 100k)
Net capital gain/loss: +$1,045 (reported on 5.5% of returns)
Here:
+$1,045
State:
+$10,653
(% of AGI for various income ranges: -2.4% for AGIs below $10k, 0.3% for AGIs $10k-25k, -0.0% for AGIs $25k-50k, 0.6% for AGIs $50k-75k, 0.4% for AGIs $75k-100k)
Profit/loss from business: +$5,372 (reported on 18.8% of returns)
Here:
+$5,372
State:
+$8,532
(% of AGI for various income ranges: 22.0% for AGIs below $10k, 7.6% for AGIs $10k-25k, 1.6% for AGIs $25k-50k, 3.6% for AGIs $50k-75k, -0.2% for AGIs over 100k)
IRA payment deduction: $2,950 (reported on 1.3% of returns)
74039:
$2,950
Oklahoma:
$3,127
Total itemized deductions: $14,285 (24% of AGI, reported on 23.7% of returns)
Here:
$14,285
State:
$17,093
Here:
24.1% of AGI
State:
20.5% of AGI
(% of AGI for various income ranges: 6.4% for AGIs $10k-25k, 8.2% for AGIs $25k-50k, 12.9% for AGIs $50k-75k, 12.9% for AGIs $75k-100k, 18.3% for AGIs over 100k)
Charity contributions deductions: $3,061 (5% of AGI, reported on 19.7% of returns)
Here:
$3,061
State:
$4,240
Here:
4.9% of AGI
State:
4.8% of AGI
(% of AGI for various income ranges: 1.0% for AGIs $10k-25k, 1.3% for AGIs $25k-50k, 2.6% for AGIs $50k-75k, 2.0% for AGIs $75k-100k, 3.6% for AGIs over 100k)
Total tax: $3,541 (reported on 66.8% of returns)
74039:
$3,541
State:
$6,542
(% of AGI for various income ranges: 4.5% for AGIs below $10k, 3.9% for AGIs $10k-25k, 5.5% for AGIs $25k-50k, 8.1% for AGIs $50k-75k, 9.9% for AGIs $75k-100k, 14.8% for AGIs over 100k)
Earned income credit: $1,782 (reported on 26.3% of returns)
Here:
$1,782
State:
$1,830
Percentage of individuals using paid preparers for their 2004 taxes: 65.3%
Here:
65%
State:
63%
(% for various income ranges: 60.6% for AGIs below $10k, 64.5% for AGIs $10k-25k, 67.1% for AGIs $25k-50k, 68.5% for AGIs $50k-75k, 72.7% for AGIs $75k-100k, 61.5% for AGIs over 100k)
Household received Food Stamps/SNAP in the past 12 months: 192 Household did not receive Food Stamps/SNAP in the past 12 months: 1,329
Women who had a birth in the past 12 months: 81 (27 now married, 51 unmarried) Women who did not have a birth in the past 12 months: 905 (478 now married, 426 unmarried)
Housing units in zip code 74039 with a mortgage: 485 (18 second mortgage, 15 both second mortgage and home equity loan) Median monthly owner costs for units with a mortgage: $1,155 Median monthly owner costs for units without a mortgage: $381
Residents with income below the poverty level in 2022:
This zip code:
14.6%
Whole state:
15.7%
Residents with income below 50% of the poverty level in 2022:
This zip code:
10.0%
Whole state:
8.3%
Median number of rooms in houses and condos:
Here:
5.6
State:
6.1
Median number of rooms in apartments:
Here:
4.7
State:
4.5
Notable locations in this zip code not listed on our city pages
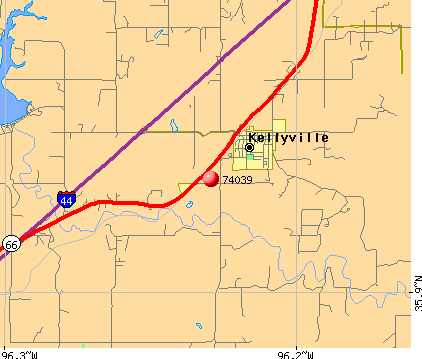
Notable locations in zip code 74039: Worman Junction (A), Jean (B), Skagway (C), Kellyville Volunteer Fire Department (D). Display/hide their locations on the map
Cemeteries: Felix Cemetery (1), Sewell Family Cemetery (2), Lester Thomas Family Cemetery (3), Kellyville City Cemetery (4), Baker Family Cemetery (5), Provens Cemetery (6), Willie Tiger Cemetery (7). Display/hide their locations on the map
Reservoirs: Oknoname 063039 Reservoir (A), Kellyville Lake (B), Little Deep Fork Creek Site 51r Reservoir (C), Heyburn Reservoir (D), Oknoname 037021 Reservoir (E), Oknoname 037022 Reservoir (F), Oknoname 037024 Reservoir (G), Oknoname 037035 Reservoir (H). Display/hide their locations on the map
Creeks: Tiger Creek (A), Clear Creek (B), Rowland Creek (C), Neversweat Creek (D), Mountain Creek (E), Little Polecat Creek (F). Display/hide their locations on the map
Size of family households: 542 2-persons, 374 3-persons, 197 4-persons, 52 5-persons, 25 6-persons, 30 7-or-more-persons
Size of nonfamily households: 215 1-person, 83 2-persons, 16 4-persons
584 married couples with children.
149 single-parent households (58 men, 91 women).
98.3% of residents of 74039 zip code speak English at home.
1.2% of residents speak Spanish at home (100% very well).
0.1% of residents speak Asian or Pacific Island language at home (100% well).
0.3% of residents speak other language at home (100% very well).
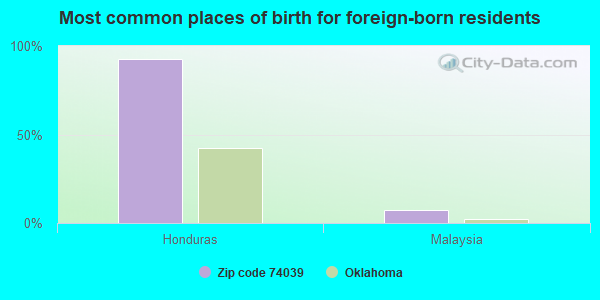
Foreign born population: 27 (0.7%) (0.0% of them are naturalized citizens)
:
0.7%
Whole state:
6.0%
93%Honduras
7%Malaysia
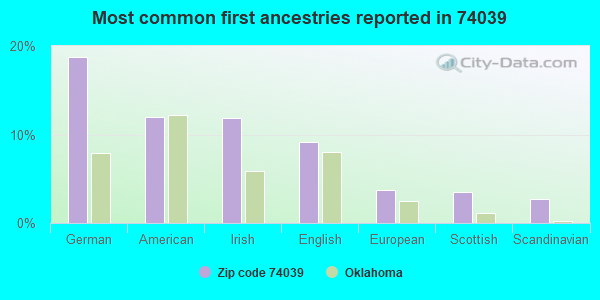
19%German
12%American
12%Irish
9%English
4%European
3%Scottish
3%Scandinavian
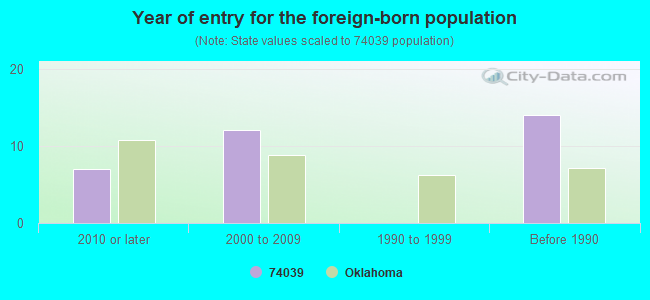
Year of entry for the foreign-born population
72010 or later
122000 to 2009
01990 to 1999
14Before 1990
Facilities with environmental interests located in this zip code:
DOWELL SCHLUMBERGER (6M W OF SAPULPA ON HWY 66 in KELLYVILLE, OK)
National Pollutant Discharge Elimination System NON-MAJOR (Tracking pollutant discharge elimination systems) - permit Business SIC classification: CONCRETE WORK Alternative names: DOWELL-SCHLUMBERGER TECH CORP
DUKE ENERGY FIELD S/KELLYVILLE GAS PLT (1 MI S W OF KELLYVILLE in KELLYVILLE, OK)
AIR MINOR (AIRS/AFS) Business SIC classification: NATURAL GAS TRANSMISSION
Housing units lacking complete plumbing facilities: 3.0% Housing units lacking complete kitchen facilities: 3.1%
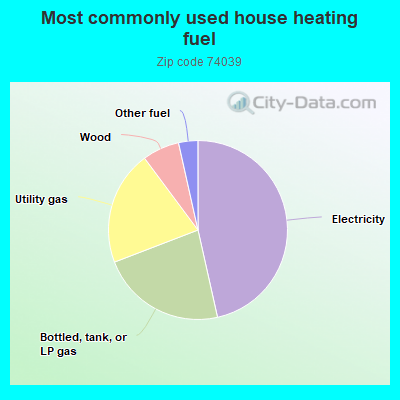
46.6%Electricity
22.7%Bottled, tank, or LP gas
20.7%Utility gas
6.7%Wood
3.5%Other fuel
Population in 1990: 2,648. Population change in the 1990s: +457 (+17.3%).
Place of birth for U.S.-born residents:
This state: 3,111
Northeast: 28
Midwest: 391
South: 321
West: 232
61% of the 74039 zip code residents lived in the same house 5 years ago. Out of people who lived in different houses, 48% lived in this county. Out of people who lived in different counties, 50% lived in Oklahoma.
96% of the 74039 zip code residents lived in the same house 1 year ago. Out of people who lived in different houses, 10% moved from this county. Out of people who lived in different houses, 81% moved from different county within same state. Out of people who lived in different houses, 33% moved from different state.
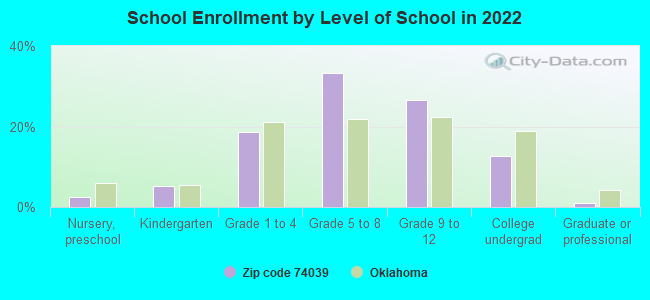
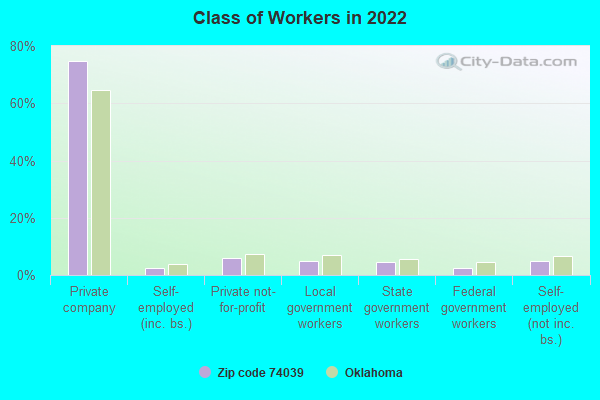
Private vs. public school enrollment:
Students in private schools in grades 1 to 8 (elementary and middle school): 43
Here:
9.7%
Oklahoma:
11.7%
Students in private schools in grades 9 to 12 (high school): 1
Here:
0.4%
Oklahoma:
11.7%
Students in private undergraduate colleges: 33
Here:
29.4%
Oklahoma:
19.3%
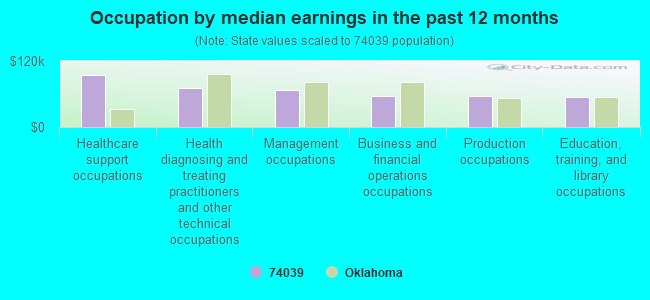
Occupation by median earnings in the past 12 months ($)
94,155Healthcare support occupations
70,277Health diagnosing and treating practitioners and other technical occupations
67,907Management occupations
56,952Business and financial operations occupations
56,159Production occupations
54,766Education, training, and library occupations
Companies with federal contracts located in this zip code:
RED WING PRODUCTS INC (14842 MAPLE DRIVE in KELLYVILLE, OK; small business) : $460,235 in 13 contractsfrom 2001 to 2005
Contracts for Aircraft Maintenance and Repair Shop Specialized Equipment, Cable, Cord, and Wire Assemblies: Communications Equipment, Vehicular Furniture and Accessories, Electrical and Electronic assemblies, Boards, Cards, and Associated Hardware, and moreby Air Force, Navy, Defense Logistics Agency Signed by year:2000: $0; 2001: $188,510; 2002: $173,225; 2003: $28,000; 2004: $30,000; 2005: $40,500; 2006: $0.
Biggest contracts:
$115,000 with Air Force for Aircraft Maintenance and Repair Shop Specialized Equipment. Signed on 2002-01-29. Completion date: 2002-08-30.
$79,950 with Navy for Cable, Cord, and Wire Assemblies: Communications Equipment. Signed on 2001-06-28. Completion date: 2001-06-28.
$58,225 with Defense Logistics Agency for Vehicular Furniture and Accessories. Signed on 2002-09-20. Completion date: 2003-09-19.
$50,180, same as above.Signed on 2001-10-25. Completion date: 2002-03-14.
Top industries in this zip code by the number of employees in 2005:
Accommodation and Food Services: Limited-Service Restaurants (10-19 employees: 1 establishment)
Other Services (except Public Administration): Religious Organizations (5-9: 1, 1-4: 2)
Construction: Plumbing, Heating, and Air-Conditioning Contractors (5-9: 1, 1-4: 1)
Real Estate and Rental and Leasing: Video Tape and Disc Rental (5-9: 1)
Mining: Support Activities for Oil and Gas Operations (5-9: 1)
Fatal accident statistics in 2014:
Fatal accident count: 1
Vehicles involved in fatal accidents: 1
Fatal accidents caused by drunken drivers: 1
Fatalities: 1
Persons involved in fatal accidents: 1
Pedestrians involved in fatal accidents: 0
Fatal accident statistics in 2013:
Fatal accident count: 2
Vehicles involved in fatal accidents: 4
Fatal accidents caused by drunken drivers: 0
Fatalities: 6
Persons involved in fatal accidents: 8
Pedestrians involved in fatal accidents: 0
Home Mortgage Disclosure Act Aggregated Statistics For Year 2009 (Based on 2 partial tracts)
A) FHA, FSA/RHS & VA Home Purchase Loans
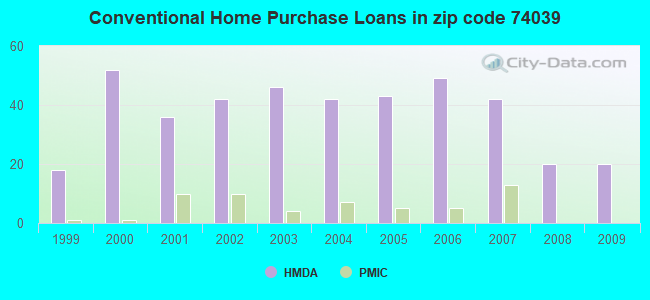
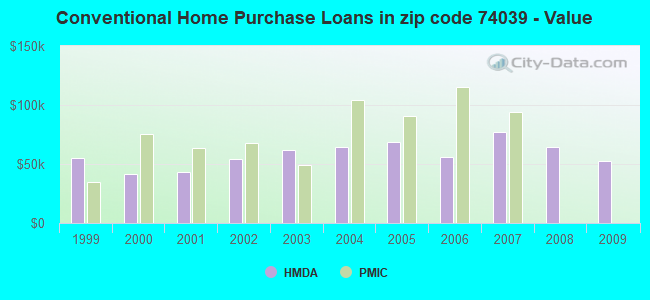
B) Conventional Home Purchase Loans
C) Refinancings
D) Home Improvement Loans
F) Non-occupant Loans on < 5 Family Dwellings (A B C & D)
G) Loans On Manufactured Home Dwelling (A B C & D)
Number
Average Value
Number
Average Value
Number
Average Value
Number
Average Value
Number
Average Value
Number
Average Value
LOANS ORIGINATED
10
$87,031
20
$52,516
42
$121,264
15
$51,344
6
$160,152
24
$80,026
APPLICATIONS APPROVED, NOT ACCEPTED
0
$0
5
$69,148
8
$124,286
2
$33,980
0
$0
6
$42,323
APPLICATIONS DENIED
4
$88,520
11
$52,456
25
$101,432
6
$19,473
0
$0
12
$58,815
APPLICATIONS WITHDRAWN
2
$96,570
1
$98,950
10
$114,213
4
$18,778
0
$0
0
$0
FILES CLOSED FOR INCOMPLETENESS
0
$0
1
$78,690
0
$0
0
$0
0
$0
1
$78,690
Aggregated Statistics For Year 2008 (Based on 2 partial tracts)
A) FHA, FSA/RHS & VA Home Purchase Loans
B) Conventional Home Purchase Loans
C) Refinancings
D) Home Improvement Loans
F) Non-occupant Loans on < 5 Family Dwellings (A B C & D)
G) Loans On Manufactured Home Dwelling (A B C & D)
Number
Average Value
Number
Average Value
Number
Average Value
Number
Average Value
Number
Average Value
Number
Average Value
LOANS ORIGINATED
8
$113,855
20
$64,260
43
$104,692
24
$33,779
6
$188,765
20
$38,628
APPLICATIONS APPROVED, NOT ACCEPTED
0
$0
7
$69,659
12
$104,218
1
$11,920
0
$0
10
$74,036
APPLICATIONS DENIED
2
$79,875
11
$52,132
42
$98,811
23
$39,498
1
$13,110
21
$63,868
APPLICATIONS WITHDRAWN
2
$111,470
2
$37,555
18
$94,383
4
$76,898
0
$0
1
$54,840
FILES CLOSED FOR INCOMPLETENESS
0
$0
0
$0
0
$0
1
$47,690
0
$0
0
$0
Aggregated Statistics For Year 2007 (Based on 2 partial tracts)
A) FHA, FSA/RHS & VA Home Purchase Loans
B) Conventional Home Purchase Loans
C) Refinancings
D) Home Improvement Loans
F) Non-occupant Loans on < 5 Family Dwellings (A B C & D)
G) Loans On Manufactured Home Dwelling (A B C & D)
Number
Average Value
Number
Average Value
Number
Average Value
Number
Average Value
Number
Average Value
Number
Average Value
LOANS ORIGINATED
6
$139,687
42
$76,954
48
$106,901
15
$26,387
10
$30,043
21
$32,019
APPLICATIONS APPROVED, NOT ACCEPTED
0
$0
5
$82,262
5
$119,220
1
$14,310
0
$0
4
$66,168
APPLICATIONS DENIED
2
$134,720
26
$63,324
39
$106,106
13
$43,378
1
$92,990
21
$53,592
APPLICATIONS WITHDRAWN
0
$0
11
$62,428
13
$106,839
4
$150,515
2
$48,285
11
$60,477
FILES CLOSED FOR INCOMPLETENESS
0
$0
5
$100,384
10
$96,568
0
$0
1
$85,840
0
$0
Aggregated Statistics For Year 2006 (Based on 2 partial tracts)
A) FHA, FSA/RHS & VA Home Purchase Loans
B) Conventional Home Purchase Loans
C) Refinancings
D) Home Improvement Loans
F) Non-occupant Loans on < 5 Family Dwellings (A B C & D)
G) Loans On Manufactured Home Dwelling (A B C & D)
Number
Average Value
Number
Average Value
Number
Average Value
Number
Average Value
Number
Average Value
Number
Average Value
LOANS ORIGINATED
6
$82,460
49
$56,155
44
$85,947
13
$30,447
5
$38,628
24
$39,392
APPLICATIONS APPROVED, NOT ACCEPTED
2
$97,165
4
$40,832
8
$92,246
1
$112,070
2
$72,725
5
$36,720
APPLICATIONS DENIED
4
$59,610
33
$53,505
70
$83,999
13
$39,068
5
$23,606
37
$62,059
APPLICATIONS WITHDRAWN
2
$132,930
18
$51,397
52
$106,541
7
$23,503
4
$26,528
13
$50,622
FILES CLOSED FOR INCOMPLETENESS
0
$0
1
$118,030
7
$85,497
0
$0
0
$0
0
$0
Aggregated Statistics For Year 2005 (Based on 2 partial tracts)
A) FHA, FSA/RHS & VA Home Purchase Loans
B) Conventional Home Purchase Loans
C) Refinancings
D) Home Improvement Loans
F) Non-occupant Loans on < 5 Family Dwellings (A B C & D)
G) Loans On Manufactured Home Dwelling (A B C & D)
Number
Average Value
Number
Average Value
Number
Average Value
Number
Average Value
Number
Average Value
Number
Average Value
LOANS ORIGINATED
1
$104,910
43
$68,371
49
$76,885
23
$42,816
14
$64,038
36
$46,926
APPLICATIONS APPROVED, NOT ACCEPTED
0
$0
20
$76,480
17
$71,742
5
$45,780
0
$0
19
$67,893
APPLICATIONS DENIED
0
$0
49
$54,184
88
$80,690
18
$29,673
7
$29,294
58
$51,367
APPLICATIONS WITHDRAWN
2
$83,455
11
$65,571
56
$103,572
14
$60,376
1
$23,840
6
$88,818
FILES CLOSED FOR INCOMPLETENESS
0
$0
1
$195,520
4
$96,568
0
$0
0
$0
0
$0
Aggregated Statistics For Year 2004 (Based on 2 partial tracts)
A) FHA, FSA/RHS & VA Home Purchase Loans
B) Conventional Home Purchase Loans
C) Refinancings
D) Home Improvement Loans
F) Non-occupant Loans on < 5 Family Dwellings (A B C & D)
G) Loans On Manufactured Home Dwelling (A B C & D)
Number
Average Value
Number
Average Value
Number
Average Value
Number
Average Value
Number
Average Value
Number
Average Value
LOANS ORIGINATED
4
$77,195
42
$64,294
62
$91,492
13
$42,277
11
$38,259
41
$51,759
APPLICATIONS APPROVED, NOT ACCEPTED
0
$0
11
$66,546
10
$67,717
1
$22,650
0
$0
8
$55,289
APPLICATIONS DENIED
1
$112,070
41
$57,633
62
$68,321
17
$51,335
10
$61,994
45
$51,688
APPLICATIONS WITHDRAWN
1
$96,570
5
$94,422
43
$93,186
5
$87,746
0
$0
4
$54,245
FILES CLOSED FOR INCOMPLETENESS
0
$0
2
$96,570
2
$109,680
0
$0
0
$0
0
$0
Aggregated Statistics For Year 2003 (Based on 2 partial tracts)
A) FHA, FSA/RHS & VA Home Purchase Loans
B) Conventional Home Purchase Loans
C) Refinancings
D) Home Improvement Loans
F) Non-occupant Loans on < 5 Family Dwellings (A B C & D)
Number
Average Value
Number
Average Value
Number
Average Value
Number
Average Value
Number
Average Value
LOANS ORIGINATED
7
$81,921
46
$61,943
87
$78,685
10
$32,905
8
$45,452
APPLICATIONS APPROVED, NOT ACCEPTED
0
$0
8
$35,766
10
$74,751
1
$9,540
1
$54,840
APPLICATIONS DENIED
4
$50,668
43
$56,533
55
$72,789
7
$18,224
1
$19,080
APPLICATIONS WITHDRAWN
0
$0
5
$78,208
41
$79,092
0
$0
4
$39,938
FILES CLOSED FOR INCOMPLETENESS
1
$51,260
1
$102,530
2
$110,280
0
$0
1
$102,530
Aggregated Statistics For Year 2002 (Based on 2 partial tracts)
A) FHA, FSA/RHS & VA Home Purchase Loans
B) Conventional Home Purchase Loans
C) Refinancings
D) Home Improvement Loans
F) Non-occupant Loans on < 5 Family Dwellings (A B C & D)
Number
Average Value
Number
Average Value
Number
Average Value
Number
Average Value
Number
Average Value
LOANS ORIGINATED
6
$84,447
42
$54,217
64
$68,961
11
$16,041
10
$46,019
APPLICATIONS APPROVED, NOT ACCEPTED
0
$0
13
$51,907
10
$79,520
1
$120,410
0
$0
APPLICATIONS DENIED
2
$62,590
30
$50,907
48
$75,357
4
$27,122
0
$0
APPLICATIONS WITHDRAWN
0
$0
6
$64,180
27
$76,389
2
$10,730
0
$0
FILES CLOSED FOR INCOMPLETENESS
0
$0
4
$67,360
13
$65,296
0
$0
1
$83,450
Aggregated Statistics For Year 2001 (Based on 2 partial tracts)
A) FHA, FSA/RHS & VA Home Purchase Loans
B) Conventional Home Purchase Loans
C) Refinancings
D) Home Improvement Loans
F) Non-occupant Loans on < 5 Family Dwellings (A B C & D)
Number
Average Value
Number
Average Value
Number
Average Value
Number
Average Value
Number
Average Value
LOANS ORIGINATED
1
$41,730
36
$42,853
51
$72,561
29
$25,982
1
$5,960
APPLICATIONS APPROVED, NOT ACCEPTED
1
$69,150
11
$29,263
8
$52,159
0
$0
0
$0
APPLICATIONS DENIED
1
$115,640
32
$35,952
36
$62,061
12
$20,367
1
$59,610
APPLICATIONS WITHDRAWN
0
$0
10
$47,092
37
$76,462
0
$0
0
$0
FILES CLOSED FOR INCOMPLETENESS
0
$0
0
$0
4
$73,618
0
$0
0
$0
Aggregated Statistics For Year 2000 (Based on 2 partial tracts)
A) FHA, FSA/RHS & VA Home Purchase Loans
B) Conventional Home Purchase Loans
C) Refinancings
D) Home Improvement Loans
F) Non-occupant Loans on < 5 Family Dwellings (A B C & D)
Number
Average Value
Number
Average Value
Number
Average Value
Number
Average Value
Number
Average Value
LOANS ORIGINATED
8
$63,038
52
$41,429
30
$58,418
24
$17,883
1
$14,310
APPLICATIONS APPROVED, NOT ACCEPTED
1
$84,650
6
$41,925
6
$47,887
0
$0
0
$0
APPLICATIONS DENIED
7
$49,050
43
$44,195
20
$80,592
11
$10,405
4
$43,218
APPLICATIONS WITHDRAWN
4
$77,492
4
$34,872
7
$44,963
1
$45,300
0
$0
FILES CLOSED FOR INCOMPLETENESS
0
$0
4
$157,968
2
$61,400
0
$0
0
$0
Aggregated Statistics For Year 1999 (Based on 1 partial tract)
A) FHA, FSA/RHS & VA Home Purchase Loans
B) Conventional Home Purchase Loans
C) Refinancings
D) Home Improvement Loans
F) Non-occupant Loans on < 5 Family Dwellings (A B C & D)
Detailed PMIC statistics for the following Tracts:0211.02
2002 - 2018 National Fire Incident Reporting System (NFIRS) incidents
Based on the data from the years 2002 - 2018 the average number of fire incidents per year is 25. The highest number of reported fire incidents - 77 took place in 2011, and the least - 0 in 2004. The data has a growing trend.
When looking into fire subcategories, the most incidents belonged to: Outside Fires (68.8%), and Structure Fires (23.8%).
Fire incident types reported to NFIRS in Zip Code 74039


 Nearest zip codes: 74066, 74071, 74010, 74041, 74131, 74047.


 Based on the data from the years 2002 - 2018 the average number of fire incidents per year is 25. The highest number of reported fire incidents - 77 took place in 2011, and the least - 0 in 2004. The data has a growing trend.
 When looking into fire subcategories, the most incidents belonged to: Outside Fires (68.8%), and Structure Fires (23.8%).