Estimated zip code population in 2022: 433 Zip code population in 2010: 586 Zip code population in 2000: 511
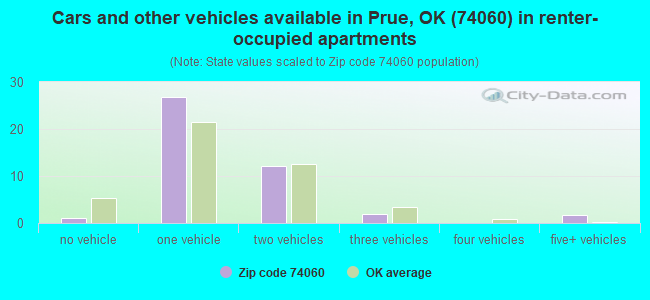
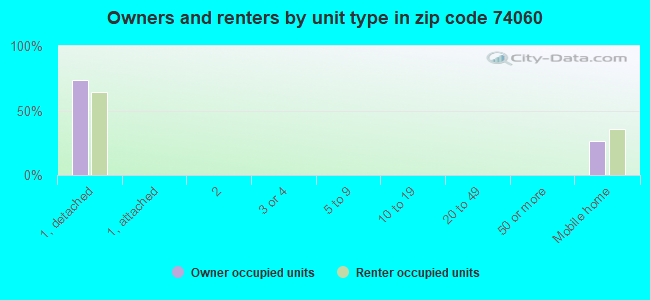
Houses and condos: 224 Renter-occupied apartments: 44
% of renters here:
27%
State:
35%
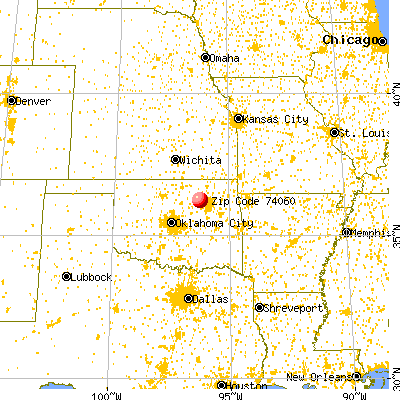
March 2022 cost of living index in zip code 74060: 77.5 (low, U.S. average is 100)
Land area: 14.5 sq. mi. Water area: 1.4 sq. mi.
Population density: 30 people per square mile
(very low).
OSM Map
General Map
Google Map
MSN Map
OSM Map
General Map
Google Map
MSN Map
OSM Map
General Map
Google Map
MSN Map
OSM Map
General Map
Google Map
MSN Map
Please wait while loading the map...
Real estate property taxes paid for housing units in 2022:
This zip code:
0.6% ($469)
Oklahoma:
0.8% ($1,501)
Median real estate property taxes paid for housing units with mortgages in 2022: $606 (0.5%) Median real estate property taxes paid for housing units with no mortgage in 2022: $295 (0.4%)
Business Search- 14 Million verified businesses
Males: 200
(46.2%)
Females: 232
(53.8%)
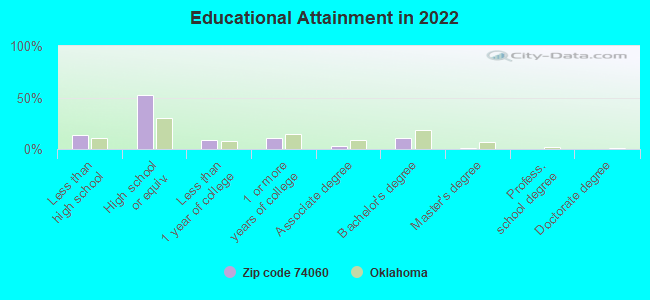
For population 25 years and over in 74060:
High school or higher: 84.1%
Bachelor's degree or higher: 11.1%
Graduate or professional degree: 0.7%
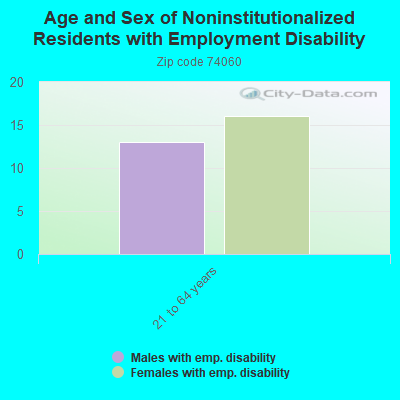
Unemployed: 2.0%
Mean travel time to work (commute): 37.2 minutes
For population 15 years and over in 74060:
Never married: 21.5%
Now married: 54.1%
Separated: 0.3%
Widowed: 8.9%
Divorced: 15.2%
Zip code 74060 compared to state average:
Median house value significantly below state average.
Unemployed percentage below state average.
Black race population percentage significantly below state average.
Hispanic race population percentage significantly below state average.
Foreign-born population percentage significantly below state average.
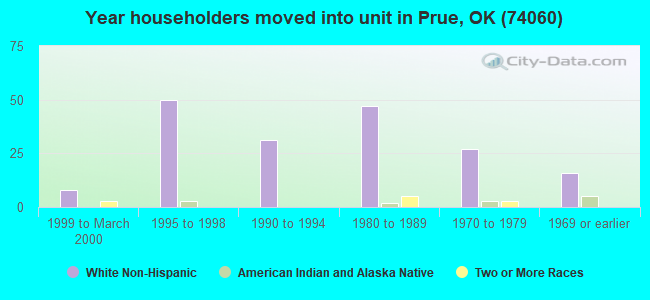
Length of stay since moving in significantly above state average.
Number of college students below state average.
Percentage of population with a bachelor's degree or higher significantly below state average.
Averages for the 2020 tax year for zip code 74060, filed in 2021:
Average Adjusted Gross Income (AGI) in 2020: $39,296 (Individual Income Tax Returns)
Here:
$39,296
State:
$63,060
Salary/wage: $38,872 (reported on 78.3% of returns)
Here:
$38,872
State:
$52,427
(% of AGI for various income ranges: 1162.9% for AGIs below $25k, 3320.0% for AGIs $25k-50k, 5027.5% for AGIs $50k-75k, 8373.3% for AGIs $75k-100k)
Taxable interest for individuals: $67 (reported on 13.0% of returns)
This zip code:
$67
Oklahoma:
$1,603
(% of AGI for various income ranges: 2.9% for AGIs below $25k)
Profit/loss from business: +$3,650 (reported on 8.7% of returns)
Here:
+$3,650
State:
+$9,904
(% of AGI for various income ranges: 104.3% for AGIs below $25k)
Taxable individual retirement arrangement distribution: $11,450 (reported on 8.7% of returns)
74060:
$11,450
Oklahoma:
$20,476
(% of AGI for various income ranges: 327.1% for AGIs below $25k)
Earned income credit: $3,240 (reported on 21.7% of returns)
Here:
$3,240
State:
$2,435
(% of AGI for various income ranges: 140.0% for AGIs below $25k, 128.0% for AGIs $25k-50k)
Percentage of individuals using paid preparers for their 2020 taxes: 91.3%
Here:
91%
State:
94%
(% for various income ranges: 90.0% for AGIs below $25k, 83.3% for AGIs $25k-50k, 100.0% for AGIs $50k-75k, 100.0% for AGIs $75k-100k)
Averages for the 2012 tax year for zip code 74060, filed in 2013:
Average Adjusted Gross Income (AGI) in 2012: $38,583 (Individual Income Tax Returns)
Here:
$38,583
State:
$58,581
Salary/wage: $35,562 (reported on 87.5% of returns)
Here:
$35,562
State:
$45,973
(% of AGI for various income ranges: 71.2% for AGIs below $25k, 82.0% for AGIs $25k-50k, 79.1% for AGIs $50k-75k, 87.1% for AGIs $75k-100k)
Taxable interest for individuals: $125 (reported on 16.7% of returns)
This zip code:
$125
Oklahoma:
$1,625
Profit/loss from business: +$5,375 (reported on 16.7% of returns)
Here:
+$5,375
State:
+$11,913
Total itemized deductions: $18,600 (28% of AGI, reported on 8.3% of returns)
Here:
$18,600
State:
$24,882
Here:
28.0% of AGI
State:
18.8% of AGI
Taxes paid: $2,600 (reported on 8.3% of returns)
74060:
$2,600
State:
$7,196
Earned income credit: $2,933 (reported on 25.0% of returns)
Here:
$2,933
State:
$2,354
(% of AGI for various income ranges: 12.5% for AGIs below $25k)
Percentage of individuals using paid preparers for their 2012 taxes: 58.3%
Here:
58%
State:
56%
(% for various income ranges: 60.0% for AGIs below $25k, 57.1% for AGIs $25k-50k, 80.0% for AGIs $50k-75k)
Averages for the 2004 tax year for zip code 74060, filed in 2005:
Average Adjusted Gross Income (AGI) in 2004: $30,162 (Individual Income Tax Returns)
Here:
$30,162
State:
$41,245
Salary/wage: $27,535 (reported on 88.0% of returns)
Here:
$27,535
State:
$35,318
(% of AGI for various income ranges: 94.7% for AGIs below $10k, 82.4% for AGIs $10k-25k, 85.4% for AGIs $25k-50k, 81.9% for AGIs $50k-75k, 62.2% for AGIs $75k-100k)
Taxable interest for individuals: $242 (reported on 25.5% of returns)
This zip code:
$242
Oklahoma:
$1,745
Profit/loss from business: +$4,909 (reported on 12.7% of returns)
Here:
+$4,909
State:
+$8,532
Total itemized deductions: $13,423 (24% of AGI, reported on 20.1% of returns)
Here:
$13,423
State:
$17,093
Here:
24.4% of AGI
State:
20.5% of AGI
Charity contributions deductions: $2,152 (4% of AGI, reported on 12.7% of returns)
Here:
$2,152
State:
$4,240
Here:
3.9% of AGI
State:
4.8% of AGI
Total tax: $3,169 (reported on 68.3% of returns)
74060:
$3,169
State:
$6,542
(% of AGI for various income ranges: 2.7% for AGIs below $10k, 3.4% for AGIs $10k-25k, 6.0% for AGIs $25k-50k, 7.8% for AGIs $50k-75k, 13.4% for AGIs $75k-100k)
Earned income credit: $1,919 (reported on 23.9% of returns)
Here:
$1,919
State:
$1,830
Percentage of individuals using paid preparers for their 2004 taxes: 56.8%
Here:
57%
State:
63%
(% for various income ranges: 45.2% for AGIs below $10k, 62.7% for AGIs $10k-25k, 63.0% for AGIs $25k-50k, 72.2% for AGIs $50k-75k)
Likely homosexual households (counted as self-reported same-sex unmarried-partner households)
Lesbian couples: 0.5% of all households
Gay men: 0.0% of all households
Household received Food Stamps/SNAP in the past 12 months: 32 Household did not receive Food Stamps/SNAP in the past 12 months: 131
Women who had a birth in the past 12 months: 10 (2 now married, 7 unmarried) Women who did not have a birth in the past 12 months: 80 (52 now married, 27 unmarried)
Housing units in zip code 74060 with a mortgage: 40 Median monthly owner costs for units with a mortgage: $916 Median monthly owner costs for units without a mortgage: $303
Residents with income below the poverty level in 2022:
This zip code:
11.7%
Whole state:
15.7%
Residents with income below 50% of the poverty level in 2022:
This zip code:
8.5%
Whole state:
8.3%
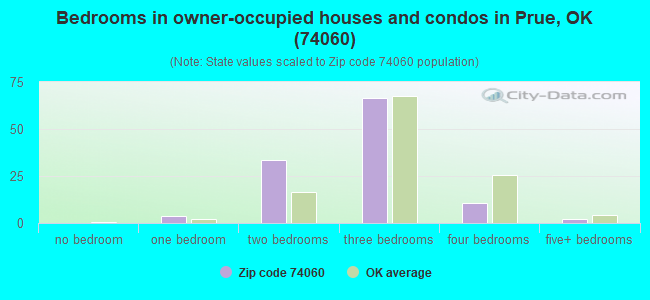
Median number of rooms in houses and condos:
Here:
5.3
State:
6.1
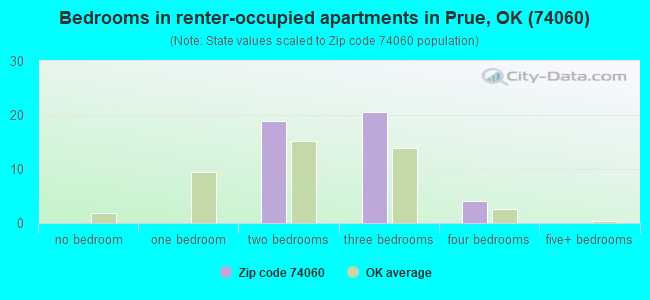
Median number of rooms in apartments:
Here:
4.8
State:
4.5
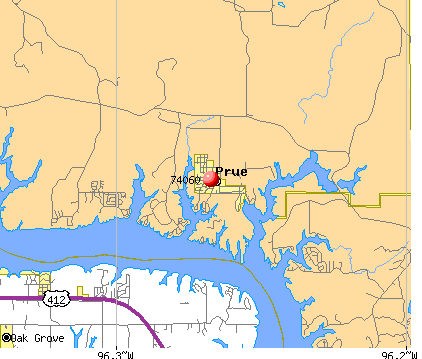
Notable locations in this zip code not listed on our city pages
Size of family households: 52 2-persons, 16 3-persons, 9 4-persons, 8 5-persons, 12 7-or-more-persons
Size of nonfamily households: 55 1-person, 4 2-persons, 2 4-persons
50 married couples with children.
6 single-parent households (6 women).
99.8% of residents of 74060 zip code speak English at home.
Foreign born population: 2 (0.7%) (0.0% of them are naturalized citizens)
:
0.7%
Whole state:
6.0%
50%Malaysia
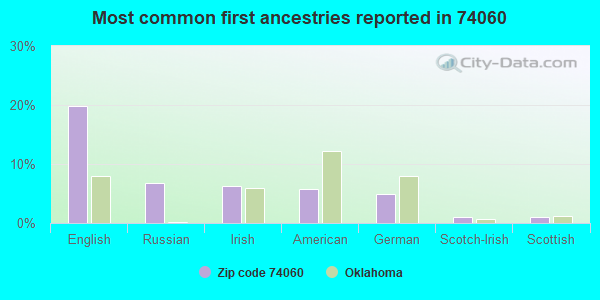
20%English
7%Russian
6%Irish
6%American
5%German
1%Scotch-Irish
1%Scottish
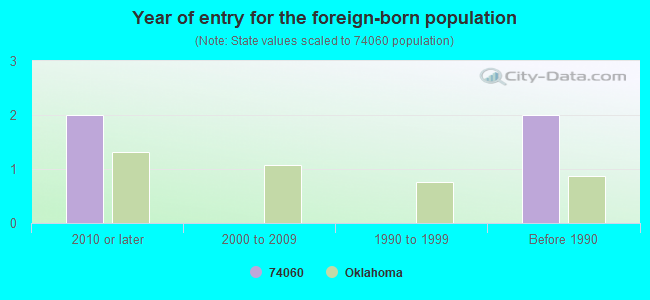
Year of entry for the foreign-born population
22010 or later
02000 to 2009
01990 to 1999
2Before 1990
Housing units lacking complete plumbing facilities: 12.1% Housing units lacking complete kitchen facilities: 3.1%
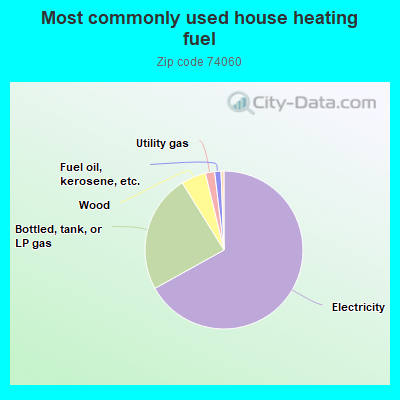
67.4%Electricity
24.4%Bottled, tank, or LP gas
5.1%Wood
1.9%Utility gas
1.3%Fuel oil, kerosene, etc.
0.6%Other fuel
Population in 1990: 712.
Place of birth for U.S.-born residents:
This state: 333
Midwest: 22
South: 26
West: 44
73% of the 74060 zip code residents lived in the same house 5 years ago. Out of people who lived in different houses, 29% lived in this county. Out of people who lived in different counties, 50% lived in Oklahoma.
91% of the 74060 zip code residents lived in the same house 1 year ago. Out of people who lived in different houses, 19% moved from this county. Out of people who lived in different houses, 74% moved from different county within same state. Out of people who lived in different houses, 11% moved from different state.
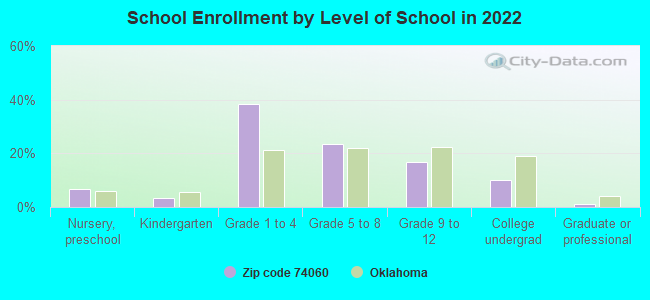
Private vs. public school enrollment:
Students in private schools in grades 1 to 8 (elementary and middle school):
Here:
0.0%
Oklahoma:
11.7%
Students in private schools in grades 9 to 12 (high school): 2
Here:
12.9%
Oklahoma:
11.7%
Students in private undergraduate colleges: 2
Here:
23.2%
Oklahoma:
19.3%
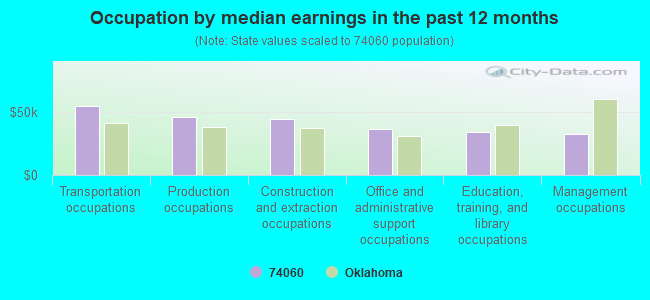
Occupation by median earnings in the past 12 months ($)
54,750Transportation occupations
46,210Production occupations
44,715Construction and extraction occupations
36,642Office and administrative support occupations
34,436Education, training, and library occupations
32,840Management occupations
Top industries in this zip code by the number of employees in 2005:
Finance and Insurance: Commercial Banking (10-19 employees: 1 establishment)
Other Services (except Public Administration): Religious Organizations (1-4: 2)
Real Estate and Rental and Leasing: Offices of Real Estate Agents and Brokers (1-4: 1)
Accommodation and Food Services: Full-Service Restaurants (1-4: 1)
Fatal accident statistics in 2011:
Fatal accident count: 1
Vehicles involved in fatal accidents: 1
Fatal accidents caused by drunken drivers: 1
Fatalities: 1
Persons involved in fatal accidents: 2
Pedestrians involved in fatal accidents: 0
Home Mortgage Disclosure Act Aggregated Statistics For Year 2009 (Based on 2 partial tracts)
A) FHA, FSA/RHS & VA Home Purchase Loans
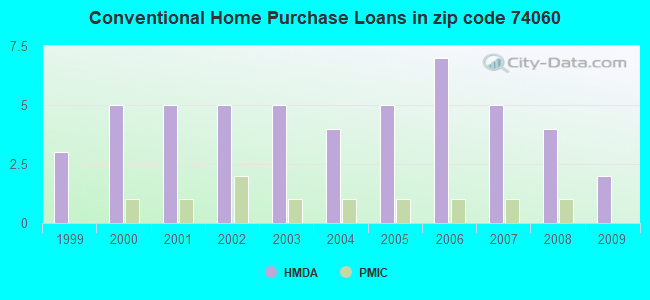
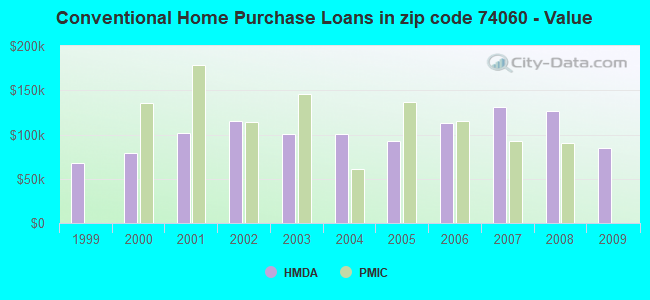
B) Conventional Home Purchase Loans
C) Refinancings
D) Home Improvement Loans
G) Loans On Manufactured Home Dwelling (A B C & D)
Number
Average Value
Number
Average Value
Number
Average Value
Number
Average Value
Number
Average Value
LOANS ORIGINATED
3
$129,197
2
$84,425
8
$132,104
1
$40,610
1
$58,800
APPLICATIONS APPROVED, NOT ACCEPTED
0
$0
0
$0
1
$88,320
0
$0
0
$0
APPLICATIONS DENIED
0
$0
0
$0
3
$143,877
0
$0
1
$73,100
APPLICATIONS WITHDRAWN
0
$0
0
$0
2
$168,225
0
$0
0
$0
FILES CLOSED FOR INCOMPLETENESS
0
$0
0
$0
1
$122,520
0
$0
0
$0
Aggregated Statistics For Year 2008 (Based on 2 partial tracts)
A) FHA, FSA/RHS & VA Home Purchase Loans
B) Conventional Home Purchase Loans
C) Refinancings
D) Home Improvement Loans
F) Non-occupant Loans on < 5 Family Dwellings (A B C & D)
G) Loans On Manufactured Home Dwelling (A B C & D)
Number
Average Value
Number
Average Value
Number
Average Value
Number
Average Value
Number
Average Value
Number
Average Value
LOANS ORIGINATED
1
$185,210
4
$127,040
4
$114,658
1
$36,490
1
$38,900
1
$36,610
APPLICATIONS APPROVED, NOT ACCEPTED
0
$0
1
$57,200
1
$59,720
0
$0
0
$0
1
$35,350
APPLICATIONS DENIED
1
$62,120
1
$45,650
3
$127,250
1
$70,010
0
$0
1
$48,960
APPLICATIONS WITHDRAWN
0
$0
0
$0
1
$182,700
0
$0
0
$0
0
$0
FILES CLOSED FOR INCOMPLETENESS
0
$0
0
$0
0
$0
0
$0
0
$0
0
$0
Aggregated Statistics For Year 2007 (Based on 2 partial tracts)
A) FHA, FSA/RHS & VA Home Purchase Loans
B) Conventional Home Purchase Loans
C) Refinancings
D) Home Improvement Loans
F) Non-occupant Loans on < 5 Family Dwellings (A B C & D)
G) Loans On Manufactured Home Dwelling (A B C & D)
Number
Average Value
Number
Average Value
Number
Average Value
Number
Average Value
Number
Average Value
Number
Average Value
LOANS ORIGINATED
1
$91,750
5
$130,920
5
$128,540
2
$42,730
1
$99,760
1
$77,450
APPLICATIONS APPROVED, NOT ACCEPTED
0
$0
1
$110,970
1
$82,600
0
$0
0
$0
0
$0
APPLICATIONS DENIED
0
$0
1
$174,570
5
$105,042
2
$29,345
0
$0
2
$55,425
APPLICATIONS WITHDRAWN
0
$0
0
$0
3
$105,247
0
$0
0
$0
1
$29,630
FILES CLOSED FOR INCOMPLETENESS
0
$0
1
$81,000
0
$0
0
$0
0
$0
0
$0
Aggregated Statistics For Year 2006 (Based on 2 partial tracts)
A) FHA, FSA/RHS & VA Home Purchase Loans
B) Conventional Home Purchase Loans
C) Refinancings
D) Home Improvement Loans
G) Loans On Manufactured Home Dwelling (A B C & D)
Number
Average Value
Number
Average Value
Number
Average Value
Number
Average Value
Number
Average Value
LOANS ORIGINATED
1
$117,260
7
$112,913
7
$126,150
2
$26,140
1
$57,540
APPLICATIONS APPROVED, NOT ACCEPTED
0
$0
1
$90,030
1
$107,420
0
$0
0
$0
APPLICATIONS DENIED
0
$0
2
$84,715
4
$113,942
3
$27,457
2
$67,555
APPLICATIONS WITHDRAWN
0
$0
1
$44,270
4
$119,548
1
$56,400
0
$0
FILES CLOSED FOR INCOMPLETENESS
0
$0
0
$0
1
$41,870
0
$0
0
$0
Aggregated Statistics For Year 2005 (Based on 2 partial tracts)
A) FHA, FSA/RHS & VA Home Purchase Loans
B) Conventional Home Purchase Loans
C) Refinancings
D) Home Improvement Loans
F) Non-occupant Loans on < 5 Family Dwellings (A B C & D)
G) Loans On Manufactured Home Dwelling (A B C & D)
Number
Average Value
Number
Average Value
Number
Average Value
Number
Average Value
Number
Average Value
Number
Average Value
LOANS ORIGINATED
1
$45,650
5
$93,122
9
$106,876
3
$33,443
1
$31,000
2
$48,850
APPLICATIONS APPROVED, NOT ACCEPTED
0
$0
1
$110,850
1
$158,900
0
$0
0
$0
1
$44,160
APPLICATIONS DENIED
0
$0
3
$36,073
7
$101,521
3
$37,637
0
$0
3
$51,557
APPLICATIONS WITHDRAWN
0
$0
1
$87,970
7
$129,664
0
$0
0
$0
0
$0
FILES CLOSED FOR INCOMPLETENESS
0
$0
0
$0
1
$140,710
0
$0
0
$0
0
$0
Aggregated Statistics For Year 2004 (Based on 2 partial tracts)
A) FHA, FSA/RHS & VA Home Purchase Loans
B) Conventional Home Purchase Loans
C) Refinancings
D) Home Improvement Loans
F) Non-occupant Loans on < 5 Family Dwellings (A B C & D)
G) Loans On Manufactured Home Dwelling (A B C & D)
Number
Average Value
Number
Average Value
Number
Average Value
Number
Average Value
Number
Average Value
Number
Average Value
LOANS ORIGINATED
1
$52,170
4
$100,615
8
$106,549
1
$70,580
1
$54,450
2
$61,660
APPLICATIONS APPROVED, NOT ACCEPTED
0
$0
1
$71,840
2
$62,060
0
$0
0
$0
0
$0
APPLICATIONS DENIED
0
$0
1
$139,570
8
$93,951
2
$28,315
0
$0
1
$76,880
APPLICATIONS WITHDRAWN
0
$0
1
$54,230
5
$115,316
0
$0
0
$0
1
$55,140
FILES CLOSED FOR INCOMPLETENESS
0
$0
0
$0
1
$59,490
0
$0
0
$0
0
$0
Aggregated Statistics For Year 2003 (Based on 2 partial tracts)
A) FHA, FSA/RHS & VA Home Purchase Loans
B) Conventional Home Purchase Loans
C) Refinancings
D) Home Improvement Loans
F) Non-occupant Loans on < 5 Family Dwellings (A B C & D)
Number
Average Value
Number
Average Value
Number
Average Value
Number
Average Value
Number
Average Value
LOANS ORIGINATED
1
$100,100
5
$100,512
15
$96,973
2
$23,110
1
$45,650
APPLICATIONS APPROVED, NOT ACCEPTED
0
$0
0
$0
3
$89,843
0
$0
0
$0
APPLICATIONS DENIED
0
$0
1
$31,690
6
$77,353
1
$36,720
0
$0
APPLICATIONS WITHDRAWN
0
$0
0
$0
4
$112,428
0
$0
0
$0
FILES CLOSED FOR INCOMPLETENESS
0
$0
0
$0
1
$113,940
0
$0
0
$0
Aggregated Statistics For Year 2002 (Based on 2 partial tracts)
A) FHA, FSA/RHS & VA Home Purchase Loans
B) Conventional Home Purchase Loans
C) Refinancings
D) Home Improvement Loans
Number
Average Value
Number
Average Value
Number
Average Value
Number
Average Value
LOANS ORIGINATED
1
$68,750
5
$115,156
10
$104,825
1
$27,910
APPLICATIONS APPROVED, NOT ACCEPTED
0
$0
1
$55,710
2
$112,625
0
$0
APPLICATIONS DENIED
0
$0
2
$71,730
6
$90,262
1
$23,450
APPLICATIONS WITHDRAWN
0
$0
1
$117,720
4
$97,582
0
$0
FILES CLOSED FOR INCOMPLETENESS
0
$0
0
$0
1
$73,900
0
$0
Aggregated Statistics For Year 2001 (Based on 2 partial tracts)
B) Conventional Home Purchase Loans
C) Refinancings
D) Home Improvement Loans
Number
Average Value
Number
Average Value
Number
Average Value
LOANS ORIGINATED
5
$102,250
8
$98,428
3
$25,017
APPLICATIONS APPROVED, NOT ACCEPTED
1
$41,180
1
$122,980
0
$0
APPLICATIONS DENIED
4
$40,755
4
$84,600
1
$15,330
APPLICATIONS WITHDRAWN
0
$0
3
$89,500
0
$0
FILES CLOSED FOR INCOMPLETENESS
0
$0
0
$0
0
$0
Aggregated Statistics For Year 2000 (Based on 2 partial tracts)
A) FHA, FSA/RHS & VA Home Purchase Loans
B) Conventional Home Purchase Loans
C) Refinancings
D) Home Improvement Loans
Number
Average Value
Number
Average Value
Number
Average Value
Number
Average Value
LOANS ORIGINATED
1
$41,300
5
$79,234
3
$78,480
2
$19,105
APPLICATIONS APPROVED, NOT ACCEPTED
0
$0
2
$51,135
1
$73,670
0
$0
APPLICATIONS DENIED
1
$45,070
3
$53,310
1
$63,950
0
$0
APPLICATIONS WITHDRAWN
0
$0
1
$122,290
1
$75,620
0
$0
FILES CLOSED FOR INCOMPLETENESS
0
$0
0
$0
0
$0
0
$0
Aggregated Statistics For Year 1999 (Based on 1 partial tract)


 Nearest zip codes: 74054, 74063, 74020, 74035, 74070, 74073.