Estimated zip code population in 2022: 2,942 Zip code population in 2010: 2,829 Zip code population in 2000: 2,571
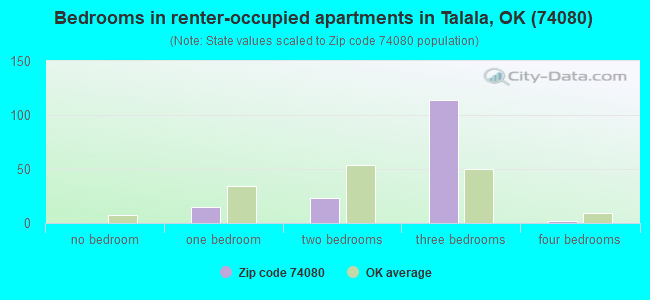
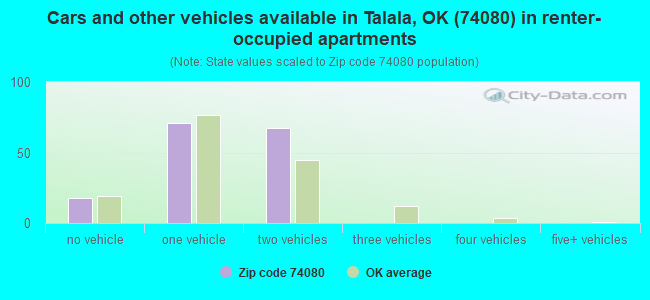
Houses and condos: 1,144 Renter-occupied apartments: 156
% of renters here:
15%
State:
35%
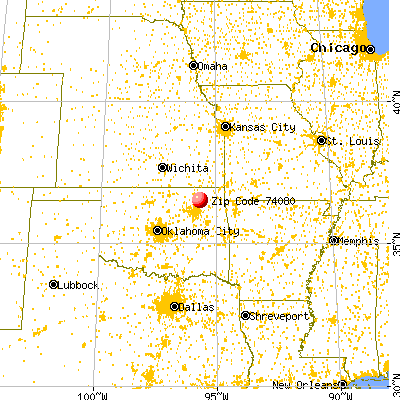
March 2022 cost of living index in zip code 74080: 79.4 (low, U.S. average is 100)
Land area: 100.1 sq. mi. Water area: 0.3 sq. mi.
Population density: 29 people per square mile
(very low).
OSM Map
General Map
Google Map
MSN Map
OSM Map
General Map
Google Map
MSN Map
OSM Map
General Map
Google Map
MSN Map
OSM Map
General Map
Google Map
MSN Map
Please wait while loading the map...
Real estate property taxes paid for housing units in 2022:
This zip code:
0.7% ($1,678)
Oklahoma:
0.8% ($1,501)
Median real estate property taxes paid for housing units with mortgages in 2022: $2,005 (0.7%) Median real estate property taxes paid for housing units with no mortgage in 2022: $1,301 (0.7%)
Business Search- 14 Million verified businesses
Males: 1,420
(48.3%)
Females: 1,521
(51.7%)
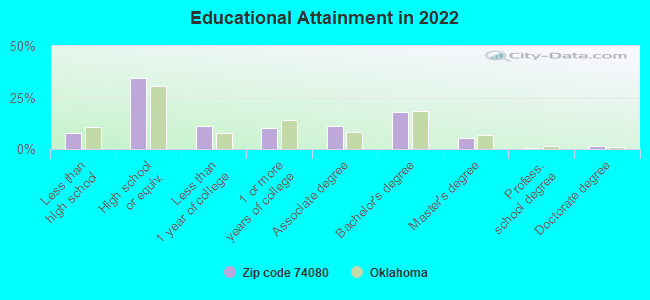
For population 25 years and over in 74080:
High school or higher: 92.7%
Bachelor's degree or higher: 25.5%
Graduate or professional degree: 7.3%
Unemployed: 2.7%
Mean travel time to work (commute): 30.7 minutes
For population 15 years and over in 74080:
Never married: 22.8%
Now married: 63.4%
Separated: 0.7%
Widowed: 5.0%
Divorced: 8.0%
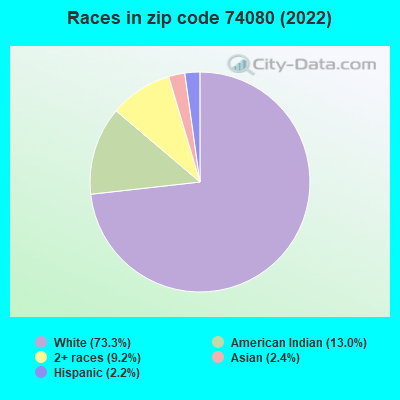
Zip code 74080 compared to state average:
Black race population percentage significantly below state average.
Hispanic race population percentage significantly below state average.
Foreign-born population percentage significantly below state average.
Renting percentage significantly below state average.
Length of stay since moving in significantly above state average.
Averages for the 2020 tax year for zip code 74080, filed in 2021:
Average Adjusted Gross Income (AGI) in 2020: $74,738 (Individual Income Tax Returns)
Here:
$74,738
State:
$63,060
Salary/wage: $61,206 (reported on 84.2% of returns)
Here:
$61,206
State:
$52,427
(% of AGI for various income ranges: 1198.9% for AGIs below $25k, 3645.5% for AGIs $25k-50k, 6089.1% for AGIs $50k-75k, 10404.4% for AGIs $75k-100k, 16648.5% for AGIs $100k-200k, 48380.0% for AGIs over 200k)
Taxable interest for individuals: $600 (reported on 34.2% of returns)
This zip code:
$600
Oklahoma:
$1,603
(% of AGI for various income ranges: 9.6% for AGIs below $25k, 20.0% for AGIs $25k-50k, 29.1% for AGIs $50k-75k, 50.0% for AGIs $75k-100k, 53.8% for AGIs $100k-200k, 80.0% for AGIs over 200k)
Ordinary dividends: $2,660 (reported on 13.2% of returns)
Here:
$2,660
State:
$7,001
(% of AGI for various income ranges: 24.5% for AGIs $25k-50k, 44.5% for AGIs $50k-75k, 43.1% for AGIs $100k-200k, 1200.0% for AGIs over 200k)
Net capital gain/loss in AGI: +$20,846 (reported on 11.4% of returns)
Here:
+$20,846
State:
+$19,855
(% of AGI for various income ranges: 20.9% for AGIs $25k-50k, 122.2% for AGIs $75k-100k, 256.2% for AGIs $100k-200k, 11105.0% for AGIs over 200k)
Profit/loss from business: +$5,705 (reported on 17.5% of returns)
Here:
+$5,705
State:
+$9,904
(% of AGI for various income ranges: 36.4% for AGIs below $25k, 203.6% for AGIs $25k-50k, 153.6% for AGIs $50k-75k, 164.4% for AGIs $75k-100k, 210.8% for AGIs $100k-200k)
Taxable individual retirement arrangement distribution: $16,012 (reported on 7.0% of returns)
74080:
$16,012
Oklahoma:
$20,476
(% of AGI for various income ranges: 128.2% for AGIs below $25k, 352.7% for AGIs $50k-75k, 410.8% for AGIs $100k-200k)
Total itemized deductions: $40,511 (reported on 7.9% of returns)
Here:
$40,511
State:
$39,736
(% of AGI for various income ranges: 743.6% for AGIs $50k-75k, 861.5% for AGIs $100k-200k, 8540.0% for AGIs over 200k)
Charity contributions: $14,071 (reported on 6.1% of returns)
Here:
$14,071
State:
$17,288
(% of AGI for various income ranges: 314.4% for AGIs $75k-100k, 3510.0% for AGIs over 200k)
Taxes paid: $6,656 (reported on 7.9% of returns)
74080:
$6,656
State:
$7,046
(% of AGI for various income ranges: 55.0% for AGIs $25k-50k, 165.4% for AGIs $100k-200k, 1315.0% for AGIs over 200k)
Earned income credit: $2,221 (reported on 16.7% of returns)
Here:
$2,221
State:
$2,435
(% of AGI for various income ranges: 86.8% for AGIs below $25k, 81.4% for AGIs $25k-50k)
Percentage of individuals using paid preparers for their 2020 taxes: 97.4%
Here:
97%
State:
94%
(% for various income ranges: 94.3% for AGIs below $25k, 96.4% for AGIs $25k-50k, 100.0% for AGIs $50k-75k, 100.0% for AGIs $75k-100k, 100.0% for AGIs $100k-200k, 100.0% for AGIs over 200k)
Averages for the 2012 tax year for zip code 74080, filed in 2013:
Average Adjusted Gross Income (AGI) in 2012: $58,825 (Individual Income Tax Returns)
Here:
$58,825
State:
$58,581
Salary/wage: $52,867 (reported on 84.0% of returns)
Here:
$52,867
State:
$45,973
(% of AGI for various income ranges: 72.1% for AGIs below $25k, 85.4% for AGIs $25k-50k, 81.1% for AGIs $50k-75k, 84.9% for AGIs $75k-100k, 79.7% for AGIs $100k-200k, 46.8% for AGIs over 200k)
Taxable interest for individuals: $830 (reported on 34.9% of returns)
This zip code:
$830
Oklahoma:
$1,625
(% of AGI for various income ranges: 2.4% for AGIs below $25k, 0.9% for AGIs $25k-50k, 0.2% for AGIs $50k-75k, 0.4% for AGIs $75k-100k, 0.3% for AGIs $100k-200k, 0.2% for AGIs over 200k)
Ordinary dividends: $1,746 (reported on 12.3% of returns)
Here:
$1,746
State:
$6,374
(% of AGI for various income ranges: 0.7% for AGIs $25k-50k, 0.2% for AGIs $50k-75k, 0.1% for AGIs $75k-100k, 0.7% for AGIs $100k-200k)
Net capital gain/loss in AGI: +$3,577 (reported on 12.3% of returns)
Here:
+$3,577
State:
+$24,023
(% of AGI for various income ranges: 0.2% for AGIs $25k-50k, 0.5% for AGIs $50k-75k, 2.2% for AGIs $75k-100k, 0.9% for AGIs $100k-200k)
Profit/loss from business: +$8,456 (reported on 17.0% of returns)
Here:
+$8,456
State:
+$11,913
(% of AGI for various income ranges: 11.5% for AGIs below $25k, 1.8% for AGIs $50k-75k, 3.2% for AGIs $75k-100k, 3.1% for AGIs $100k-200k)
Taxable individual retirement arrangement distribution: $10,450 (reported on 7.5% of returns)
74080:
$10,450
Oklahoma:
$15,242
(% of AGI for various income ranges: 5.1% for AGIs below $25k, 1.8% for AGIs $50k-75k, 2.2% for AGIs $100k-200k)
Total itemized deductions: $23,635 (21% of AGI, reported on 29.2% of returns)
Here:
$23,635
State:
$24,882
Here:
21.3% of AGI
State:
18.8% of AGI
(% of AGI for various income ranges: 13.0% for AGIs $25k-50k, 8.5% for AGIs $50k-75k, 12.2% for AGIs $75k-100k, 13.0% for AGIs $100k-200k, 16.3% for AGIs over 200k)
Charity contributions: $5,396 (reported on 23.6% of returns)
Here:
$5,396
State:
$6,591
(% of AGI for various income ranges: 1.6% for AGIs $25k-50k, 1.5% for AGIs $50k-75k, 3.2% for AGIs $75k-100k, 2.9% for AGIs $100k-200k, 1.8% for AGIs over 200k)
Taxes paid: $6,174 (reported on 29.2% of returns)
74080:
$6,174
State:
$7,196
(% of AGI for various income ranges: 1.8% for AGIs $25k-50k, 1.8% for AGIs $50k-75k, 2.9% for AGIs $75k-100k, 3.9% for AGIs $100k-200k, 5.2% for AGIs over 200k)
Earned income credit: $2,381 (reported on 15.1% of returns)
Here:
$2,381
State:
$2,354
(% of AGI for various income ranges: 6.0% for AGIs below $25k, 1.4% for AGIs $25k-50k)
Percentage of individuals using paid preparers for their 2012 taxes: 66.0%
Here:
66%
State:
56%
(% for various income ranges: 61.1% for AGIs below $25k, 65.2% for AGIs $25k-50k, 70.6% for AGIs $50k-75k, 66.7% for AGIs $75k-100k, 66.7% for AGIs $100k-200k, 100.0% for AGIs over 200k)
Averages for the 2004 tax year for zip code 74080, filed in 2005:
Average Adjusted Gross Income (AGI) in 2004: $43,480 (Individual Income Tax Returns)
Here:
$43,480
State:
$41,245
Salary/wage: $41,564 (reported on 83.1% of returns)
Here:
$41,564
State:
$35,318
(% of AGI for various income ranges: 127.6% for AGIs below $10k, 78.0% for AGIs $10k-25k, 81.9% for AGIs $25k-50k, 84.7% for AGIs $50k-75k, 79.8% for AGIs $75k-100k, 70.1% for AGIs over 100k)
Taxable interest for individuals: $1,090 (reported on 45.8% of returns)
This zip code:
$1,090
Oklahoma:
$1,745
(% of AGI for various income ranges: 7.7% for AGIs below $10k, 3.7% for AGIs $10k-25k, 1.1% for AGIs $25k-50k, 1.0% for AGIs $50k-75k, 1.0% for AGIs $75k-100k, 0.3% for AGIs over 100k)
Taxable dividends: $731 (reported on 17.4% of returns)
Here:
$731
State:
$2,920
(% of AGI for various income ranges: 1.8% for AGIs below $10k, 0.6% for AGIs $10k-25k, 0.5% for AGIs $25k-50k, 0.2% for AGIs $50k-75k, 0.2% for AGIs $75k-100k, 0.1% for AGIs over 100k)
Net capital gain/loss: +$3,544 (reported on 16.6% of returns)
Here:
+$3,544
State:
+$10,653
(% of AGI for various income ranges: 1.0% for AGIs below $10k, 0.1% for AGIs $10k-25k, 1.3% for AGIs $25k-50k, 1.7% for AGIs $50k-75k, 0.6% for AGIs $75k-100k, 2.0% for AGIs over 100k)
Profit/loss from business: +$5,608 (reported on 20.7% of returns)
Here:
+$5,608
State:
+$8,532
(% of AGI for various income ranges: 8.3% for AGIs below $10k, 9.4% for AGIs $10k-25k, 4.3% for AGIs $25k-50k, 0.5% for AGIs $50k-75k, -1.3% for AGIs $75k-100k, 3.3% for AGIs over 100k)
IRA payment deduction: $2,929 (reported on 3.1% of returns)
74080:
$2,929
Oklahoma:
$3,127
Total itemized deductions: $15,542 (21% of AGI, reported on 36.2% of returns)
Here:
$15,542
State:
$17,093
Here:
20.8% of AGI
State:
20.5% of AGI
(% of AGI for various income ranges: 10.7% for AGIs $10k-25k, 12.6% for AGIs $25k-50k, 13.1% for AGIs $50k-75k, 13.9% for AGIs $75k-100k, 13.9% for AGIs over 100k)
Charity contributions deductions: $3,094 (4% of AGI, reported on 29.7% of returns)
Here:
$3,094
State:
$4,240
Here:
4.1% of AGI
State:
4.8% of AGI
(% of AGI for various income ranges: 1.1% for AGIs $10k-25k, 2.0% for AGIs $25k-50k, 2.2% for AGIs $50k-75k, 2.3% for AGIs $75k-100k, 2.4% for AGIs over 100k)
Total tax: $5,681 (reported on 75.8% of returns)
74080:
$5,681
State:
$6,542
(% of AGI for various income ranges: 3.4% for AGIs below $10k, 4.1% for AGIs $10k-25k, 5.9% for AGIs $25k-50k, 7.9% for AGIs $50k-75k, 10.2% for AGIs $75k-100k, 17.4% for AGIs over 100k)
Earned income credit: $1,929 (reported on 14.1% of returns)
Here:
$1,929
State:
$1,830
Percentage of individuals using paid preparers for their 2004 taxes: 70.6%
Here:
71%
State:
63%
(% for various income ranges: 62.7% for AGIs below $10k, 71.4% for AGIs $10k-25k, 75.7% for AGIs $25k-50k, 70.1% for AGIs $50k-75k, 64.5% for AGIs $75k-100k, 77.4% for AGIs over 100k)
Household received Food Stamps/SNAP in the past 12 months: 84 Household did not receive Food Stamps/SNAP in the past 12 months: 961
Women who had a birth in the past 12 months: 28 (19 now married, 8 unmarried) Women who did not have a birth in the past 12 months: 628 (326 now married, 301 unmarried)
Housing units in zip code 74080 with a mortgage: 494 Houses without a mortgage: 18
Median monthly owner costs for units with a mortgage: $1,421 Median monthly owner costs for units without a mortgage: $500
Residents with income below the poverty level in 2022:
This zip code:
8.7%
Whole state:
15.7%
Residents with income below 50% of the poverty level in 2022:
This zip code:
4.6%
Whole state:
8.3%
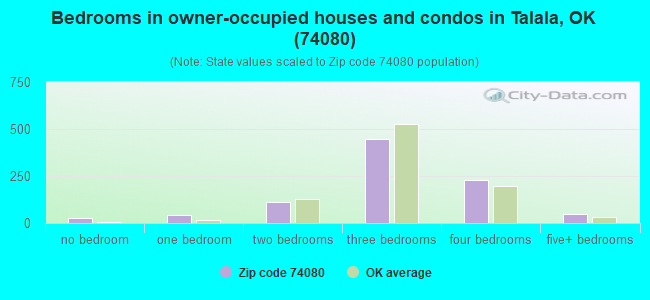
Median number of rooms in houses and condos:
Here:
5.9
State:
6.1
Median number of rooms in apartments:
Here:
4.4
State:
4.5
Notable locations in this zip code not listed on our city pages
Size of family households: 392 2-persons, 181 3-persons, 144 4-persons, 75 5-persons, 24 6-persons, 22 7-or-more-persons
Size of nonfamily households: 185 1-person, 29 2-persons
504 married couples with children.
133 single-parent households (66 men, 67 women).
95.8% of residents of 74080 zip code speak English at home.
0.5% of residents speak Spanish at home (36% very well, 64% not well).
0.7% of residents speak Asian or Pacific Island language at home (30% very well, 45% well, 25% not well).
2.9% of residents speak other language at home (4% very well, 96% well).
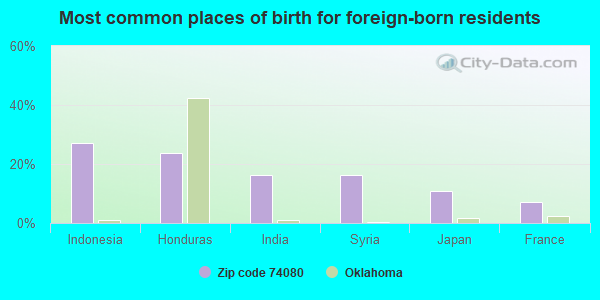
Foreign born population: 55 (1.9%) (96.5% of them are naturalized citizens)
This zip code:
1.9%
Whole state:
6.0%
27%Indonesia
24%Honduras
16%India
16%Syria
11%Japan
7%France
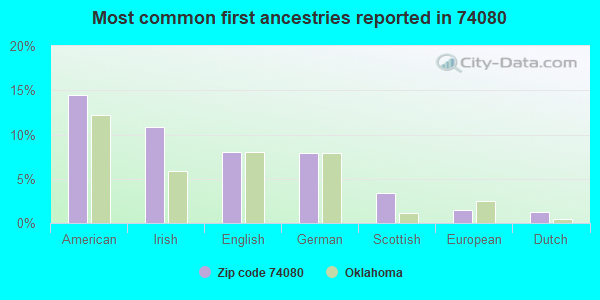
15%American
11%Irish
8%English
8%German
3%Scottish
1%European
1%Dutch
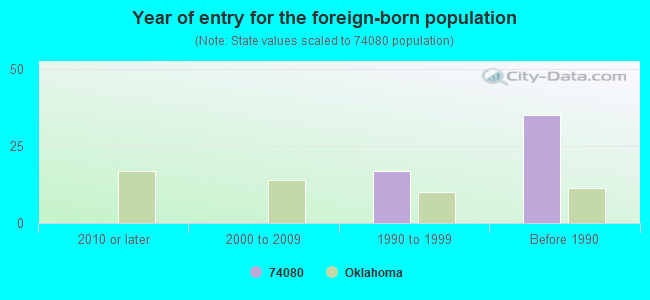
Year of entry for the foreign-born population
02010 or later
02000 to 2009
171990 to 1999
35Before 1990
Housing units lacking complete plumbing facilities: 2.3% Housing units lacking complete kitchen facilities: 5.1%
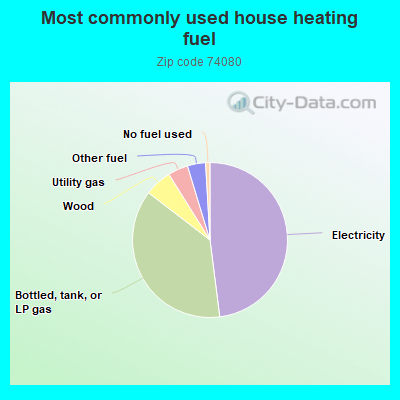
48.1%Electricity
37.5%Bottled, tank, or LP gas
5.7%Wood
4.2%Utility gas
3.8%Other fuel
0.9%No fuel used
Population in 1990: 883. Population change in the 1990s: +1,688 (+191.2%).
Place of birth for U.S.-born residents:
This state: 1,953
Northeast: 23
Midwest: 381
South: 257
West: 270
57% of the 74080 zip code residents lived in the same house 5 years ago. Out of people who lived in different houses, 48% lived in this county. Out of people who lived in different counties, 50% lived in Oklahoma.
93% of the 74080 zip code residents lived in the same house 1 year ago. Out of people who lived in different houses, 29% moved from this county. Out of people who lived in different houses, 74% moved from different county within same state. Out of people who lived in different houses, 4% moved from different state.
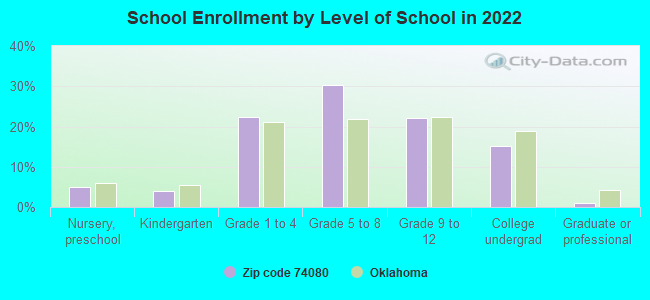
Private vs. public school enrollment:
Students in private schools in grades 1 to 8 (elementary and middle school): 97
Here:
26.7%
Oklahoma:
11.7%
Students in private schools in grades 9 to 12 (high school): 31
Here:
20.1%
Oklahoma:
11.7%
Students in private undergraduate colleges: 27
Here:
25.6%
Oklahoma:
19.3%
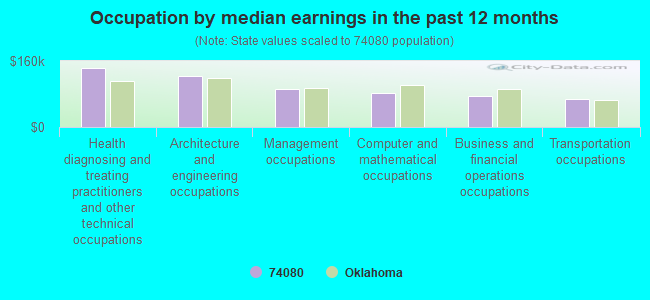
Occupation by median earnings in the past 12 months ($)
143,039Health diagnosing and treating practitioners and other technical occupations
122,528Architecture and engineering occupations
92,004Management occupations
82,634Computer and mathematical occupations
75,586Business and financial operations occupations
66,752Transportation occupations
Companies with federal contracts located in this zip code:
SWEET CLAIM SERVICE INC (207 S PINE ST in TALALA, OK; small business) 5 employees, $2500000 revenue. Woman Owned Business
$39,000 with Office of Policy, Management and Budget/Chief Financial Officer for Real Property Appraisals Services (SIC 6531). Taking place in CO. Signed on 1999-11-15. Completion date: 2000-09-15.
ROD HENRY CONSTRUCTION, INC (10425 E HENRY BLVD UNIT B in TALALA, OK; small business)
$9,750 with U.S. Army Corps of Engineers - civil program financing only for Construction of Structures and Facilities -- Sewage and Waste Facilities. Signed on 2002-01-14. Completion date: 2002-05-15.
Top industries in this zip code by the number of employees in 2005:
Accommodation and Food Services: Full-Service Restaurants (20-49 employees: 1 establishment)
Mining: Crude Petroleum and Natural Gas Extraction (10-19: 1)
Construction: Site Preparation Contractors (5-9: 1)
Finance and Insurance: Claims Adjusting (5-9: 1)
Mining: Drilling Oil and Gas Wells (5-9: 1)
Other Services (except Public Administration): Religious Organizations (5-9: 1)
Fatal accident statistics in 2014:
Fatal accident count: 1
Vehicles involved in fatal accidents: 1
Fatal accidents caused by drunken drivers: 0
Fatalities: 2
Persons involved in fatal accidents: 2
Pedestrians involved in fatal accidents: 0
Fatal accident statistics in 2013:
Fatal accident count: 1
Vehicles involved in fatal accidents: 1
Fatal accidents caused by drunken drivers: 1
Fatalities: 1
Persons involved in fatal accidents: 1
Pedestrians involved in fatal accidents: 0
Home Mortgage Disclosure Act Aggregated Statistics For Year 2009 (Based on 6 partial tracts)
A) FHA, FSA/RHS & VA Home Purchase Loans
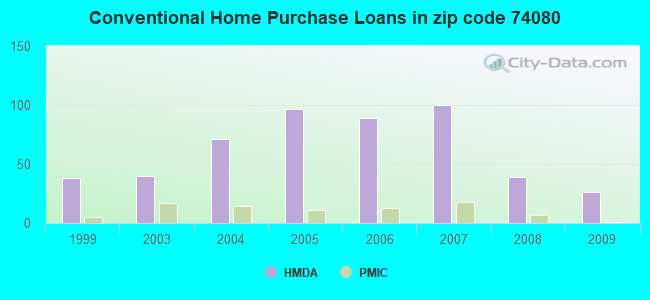
B) Conventional Home Purchase Loans
C) Refinancings
D) Home Improvement Loans
F) Non-occupant Loans on < 5 Family Dwellings (A B C & D)
G) Loans On Manufactured Home Dwelling (A B C & D)
Number
Average Value
Number
Average Value
Number
Average Value
Number
Average Value
Number
Average Value
Number
Average Value
LOANS ORIGINATED
32
$135,857
26
$116,958
121
$170,157
21
$18,608
13
$78,194
17
$45,787
APPLICATIONS APPROVED, NOT ACCEPTED
2
$117,120
8
$75,098
10
$129,016
0
$0
0
$0
3
$80,240
APPLICATIONS DENIED
8
$145,570
15
$143,583
45
$150,437
1
$109,950
3
$182,677
9
$75,296
APPLICATIONS WITHDRAWN
3
$84,987
5
$79,044
29
$139,829
3
$34,150
3
$92,693
2
$56,660
FILES CLOSED FOR INCOMPLETENESS
0
$0
0
$0
5
$136,644
0
$0
0
$0
0
$0
Aggregated Statistics For Year 2008 (Based on 6 partial tracts)
A) FHA, FSA/RHS & VA Home Purchase Loans
B) Conventional Home Purchase Loans
C) Refinancings
D) Home Improvement Loans
F) Non-occupant Loans on < 5 Family Dwellings (A B C & D)
G) Loans On Manufactured Home Dwelling (A B C & D)
Number
Average Value
Number
Average Value
Number
Average Value
Number
Average Value
Number
Average Value
Number
Average Value
LOANS ORIGINATED
32
$133,090
39
$98,393
80
$154,142
24
$49,967
19
$64,912
25
$52,113
APPLICATIONS APPROVED, NOT ACCEPTED
3
$85,950
7
$74,627
10
$164,346
4
$11,350
0
$0
7
$64,826
APPLICATIONS DENIED
6
$125,728
20
$118,246
68
$131,560
6
$53,638
4
$112,682
12
$93,540
APPLICATIONS WITHDRAWN
3
$220,660
4
$113,825
15
$151,880
2
$214,055
4
$161,045
1
$53,990
FILES CLOSED FOR INCOMPLETENESS
0
$0
4
$133,932
4
$98,380
1
$120,920
0
$0
0
$0
Aggregated Statistics For Year 2007 (Based on 6 partial tracts)
A) FHA, FSA/RHS & VA Home Purchase Loans
B) Conventional Home Purchase Loans
C) Refinancings
D) Home Improvement Loans
F) Non-occupant Loans on < 5 Family Dwellings (A B C & D)
G) Loans On Manufactured Home Dwelling (A B C & D)
Number
Average Value
Number
Average Value
Number
Average Value
Number
Average Value
Number
Average Value
Number
Average Value
LOANS ORIGINATED
19
$127,032
100
$106,506
82
$113,801
30
$40,359
14
$107,884
22
$65,273
APPLICATIONS APPROVED, NOT ACCEPTED
2
$100,825
19
$78,951
7
$129,609
7
$53,049
0
$0
6
$60,700
APPLICATIONS DENIED
2
$87,945
26
$83,964
86
$146,645
22
$71,555
2
$112,280
17
$80,848
APPLICATIONS WITHDRAWN
2
$129,675
8
$100,771
30
$140,869
2
$31,065
1
$100,390
1
$88,860
FILES CLOSED FOR INCOMPLETENESS
0
$0
0
$0
8
$103,121
0
$0
0
$0
0
$0
Aggregated Statistics For Year 2006 (Based on 6 partial tracts)
A) FHA, FSA/RHS & VA Home Purchase Loans
B) Conventional Home Purchase Loans
C) Refinancings
D) Home Improvement Loans
F) Non-occupant Loans on < 5 Family Dwellings (A B C & D)
G) Loans On Manufactured Home Dwelling (A B C & D)
Number
Average Value
Number
Average Value
Number
Average Value
Number
Average Value
Number
Average Value
Number
Average Value
LOANS ORIGINATED
13
$79,902
89
$101,916
64
$120,927
13
$76,641
9
$83,861
20
$61,930
APPLICATIONS APPROVED, NOT ACCEPTED
2
$70,065
20
$99,090
19
$116,825
5
$24,282
1
$80,700
10
$53,832
APPLICATIONS DENIED
6
$103,370
34
$88,357
63
$115,844
22
$55,908
2
$101,690
29
$71,758
APPLICATIONS WITHDRAWN
0
$0
9
$100,736
41
$124,422
10
$66,589
1
$52,020
2
$114,875
FILES CLOSED FOR INCOMPLETENESS
4
$69,930
2
$77,050
17
$112,337
0
$0
0
$0
4
$69,155
Aggregated Statistics For Year 2005 (Based on 6 partial tracts)
A) FHA, FSA/RHS & VA Home Purchase Loans
B) Conventional Home Purchase Loans
C) Refinancings
D) Home Improvement Loans
F) Non-occupant Loans on < 5 Family Dwellings (A B C & D)
G) Loans On Manufactured Home Dwelling (A B C & D)
Number
Average Value
Number
Average Value
Number
Average Value
Number
Average Value
Number
Average Value
Number
Average Value
LOANS ORIGINATED
10
$97,860
97
$102,124
83
$128,240
12
$93,532
6
$90,702
15
$56,442
APPLICATIONS APPROVED, NOT ACCEPTED
0
$0
28
$94,273
16
$142,813
2
$117,705
0
$0
19
$54,248
APPLICATIONS DENIED
4
$104,668
31
$53,334
80
$121,971
15
$41,145
0
$0
16
$55,840
APPLICATIONS WITHDRAWN
0
$0
16
$129,658
61
$143,552
4
$83,192
0
$0
2
$110,320
FILES CLOSED FOR INCOMPLETENESS
0
$0
5
$56,682
11
$124,702
2
$35,640
0
$0
0
$0
Aggregated Statistics For Year 2004 (Based on 6 partial tracts)
A) FHA, FSA/RHS & VA Home Purchase Loans
B) Conventional Home Purchase Loans
C) Refinancings
D) Home Improvement Loans
F) Non-occupant Loans on < 5 Family Dwellings (A B C & D)
G) Loans On Manufactured Home Dwelling (A B C & D)
Number
Average Value
Number
Average Value
Number
Average Value
Number
Average Value
Number
Average Value
Number
Average Value
LOANS ORIGINATED
23
$95,124
71
$85,015
83
$123,249
9
$27,264
7
$76,376
25
$56,611
APPLICATIONS APPROVED, NOT ACCEPTED
0
$0
14
$66,155
19
$139,681
0
$0
0
$0
6
$53,512
APPLICATIONS DENIED
4
$135,938
49
$65,157
68
$106,205
18
$18,446
3
$62,317
41
$60,056
APPLICATIONS WITHDRAWN
2
$70,335
11
$83,499
49
$122,811
0
$0
2
$70,010
2
$99,435
FILES CLOSED FOR INCOMPLETENESS
0
$0
2
$153,815
7
$95,949
1
$19,400
0
$0
0
$0
Aggregated Statistics For Year 2003 (Based on 6 partial tracts)
A) FHA, FSA/RHS & VA Home Purchase Loans
B) Conventional Home Purchase Loans
C) Refinancings
D) Home Improvement Loans
F) Non-occupant Loans on < 5 Family Dwellings (A B C & D)
Number
Average Value
Number
Average Value
Number
Average Value
Number
Average Value
Number
Average Value
LOANS ORIGINATED
9
$116,607
40
$89,280
211
$109,126
7
$26,507
2
$89,550
APPLICATIONS APPROVED, NOT ACCEPTED
1
$49,490
6
$68,793
26
$99,187
2
$10,835
2
$99,200
APPLICATIONS DENIED
1
$82,110
43
$68,846
85
$107,321
11
$14,431
4
$46,872
APPLICATIONS WITHDRAWN
2
$129,910
7
$123,174
49
$115,619
0
$0
0
$0
FILES CLOSED FOR INCOMPLETENESS
1
$56,520
0
$0
8
$99,216
1
$17,430
0
$0
Aggregated Statistics For Year 1999 (Based on 2 partial tracts)
A) FHA, FSA/RHS & VA Home Purchase Loans
B) Conventional Home Purchase Loans
C) Refinancings
D) Home Improvement Loans
E) Loans on Dwellings For 5+ Families
F) Non-occupant Loans on < 5 Family Dwellings (A B C & D)
Detailed PMIC statistics for the following Tracts:0508.01
, 0508.02
2002 - 2018 National Fire Incident Reporting System (NFIRS) incidents
According to the data from the years 2002 - 2018 the average number of fire incidents per year is 21. The highest number of fires - 58 took place in 2006, and the least - 0 in 2008. The data has a declining trend.
When looking into fire subcategories, the most reports belonged to: Outside Fires (71.5%), and Structure Fires (13.2%).
Fire incident types reported to NFIRS in Zip Code 74080


 Nearest zip codes: 74053, 74061, 74082, 74048, 74021, 74051.


 According to the data from the years 2002 - 2018 the average number of fire incidents per year is 21. The highest number of fires - 58 took place in 2006, and the least - 0 in 2008. The data has a declining trend.
 When looking into fire subcategories, the most reports belonged to: Outside Fires (71.5%), and Structure Fires (13.2%).