Estimated zip code population in 2022: 1,511 Zip code population in 2010: 1,347 Zip code population in 2000: 1,450
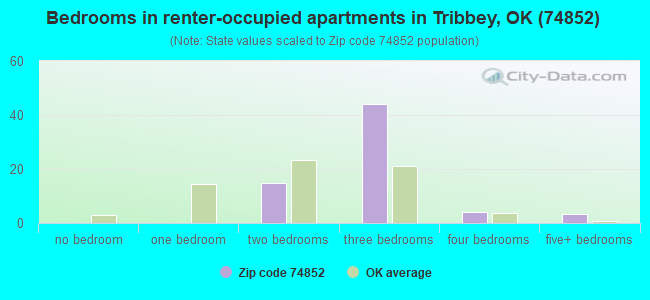
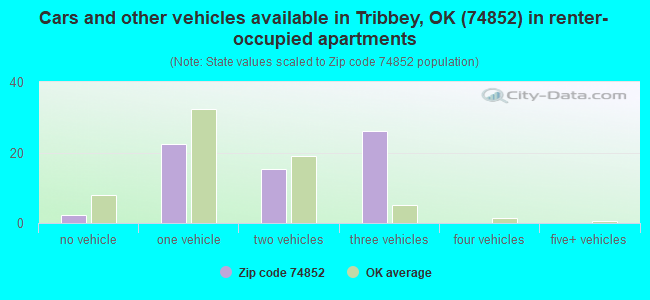
Houses and condos: 661 Renter-occupied apartments: 67
% of renters here:
12%
State:
35%
March 2022 cost of living index in zip code 74852: 78.8 (low, U.S. average is 100)
Land area: 72.7 sq. mi. Water area: 0.1 sq. mi.
Population density: 21 people per square mile
(very low).
OSM Map
General Map
Google Map
MSN Map
OSM Map
General Map
Google Map
MSN Map
OSM Map
General Map
Google Map
MSN Map
OSM Map
General Map
Google Map
MSN Map
Please wait while loading the map...
Real estate property taxes paid for housing units in 2022:
This zip code:
0.4% ($612)
Oklahoma:
0.8% ($1,501)
Median real estate property taxes paid for housing units with mortgages in 2022: $1,059 (0.6%) Median real estate property taxes paid for housing units with no mortgage in 2022: $510 (0.5%)
Business Search- 14 Million verified businesses
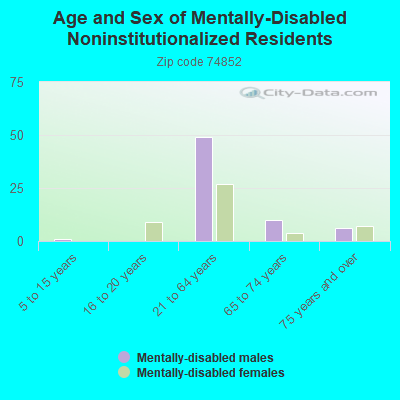
Males: 774
(51.2%)
Females: 737
(48.8%)
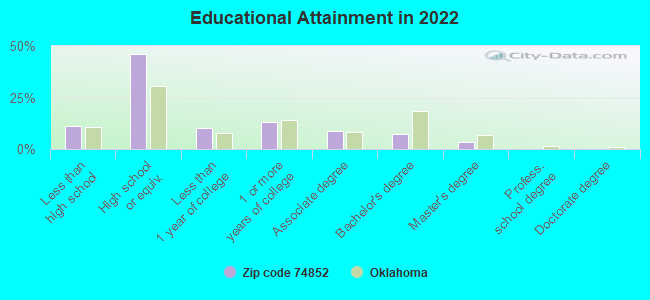
For population 25 years and over in 74852:
High school or higher: 87.6%
Bachelor's degree or higher: 10.7%
Graduate or professional degree: 3.7%
Unemployed: 5.4%
Mean travel time to work (commute): 35.5 minutes
For population 15 years and over in 74852:
Never married: 21.5%
Now married: 59.9%
Separated: 3.2%
Widowed: 6.9%
Divorced: 8.5%
Zip code 74852 compared to state average:
Black race population percentage significantly below state average.
Median age above state average.
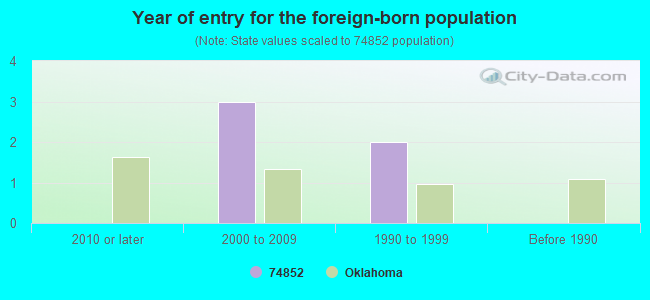
Foreign-born population percentage significantly below state average.
Renting percentage significantly below state average.
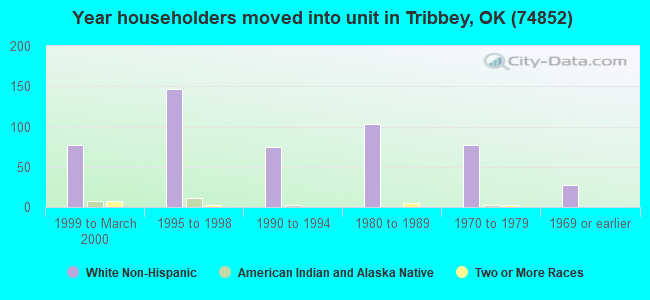
Length of stay since moving in significantly above state average.
Percentage of population with a bachelor's degree or higher significantly below state average.
Averages for the 2020 tax year for zip code 74852, filed in 2021:
Average Adjusted Gross Income (AGI) in 2020: $43,511 (Individual Income Tax Returns)
Here:
$43,511
State:
$63,060
Salary/wage: $39,908 (reported on 81.5% of returns)
Here:
$39,908
State:
$52,427
(% of AGI for various income ranges: 1008.0% for AGIs below $25k, 3235.6% for AGIs $25k-50k, 7006.7% for AGIs $50k-75k, 8520.0% for AGIs $75k-100k, 18996.7% for AGIs $100k-200k)
Taxable interest for individuals: $536 (reported on 21.5% of returns)
This zip code:
$536
Oklahoma:
$1,603
(% of AGI for various income ranges: 10.0% for AGIs below $25k, 18.3% for AGIs $25k-50k, 21.7% for AGIs $50k-75k, 30.0% for AGIs $100k-200k)
Ordinary dividends: $1,400 (reported on 6.2% of returns)
Here:
$1,400
State:
$7,001
(% of AGI for various income ranges: 93.3% for AGIs $50k-75k)
Net capital gain/loss in AGI: +$1,900 (reported on 7.7% of returns)
Here:
+$1,900
State:
+$19,855
(% of AGI for various income ranges: 19.5% for AGIs below $25k, 93.3% for AGIs $50k-75k)
Profit/loss from business: +$11,600 (reported on 15.4% of returns)
Here:
+$11,600
State:
+$9,904
(% of AGI for various income ranges: 94.5% for AGIs below $25k, 112.2% for AGIs $25k-50k, 1281.7% for AGIs $50k-75k)
Taxable individual retirement arrangement distribution: $11,167 (reported on 4.6% of returns)
74852:
$11,167
Oklahoma:
$20,476
(% of AGI for various income ranges: 167.5% for AGIs below $25k)
Earned income credit: $2,853 (reported on 26.2% of returns)
Here:
$2,853
State:
$2,435
(% of AGI for various income ranges: 152.0% for AGIs below $25k, 100.6% for AGIs $25k-50k)
Percentage of individuals using paid preparers for their 2020 taxes: 95.4%
Here:
95%
State:
94%
(% for various income ranges: 95.8% for AGIs below $25k, 95.2% for AGIs $25k-50k, 88.9% for AGIs $50k-75k, 100.0% for AGIs $75k-100k, 100.0% for AGIs $100k-200k)
Averages for the 2012 tax year for zip code 74852, filed in 2013:
Average Adjusted Gross Income (AGI) in 2012: $37,803 (Individual Income Tax Returns)
Here:
$37,803
State:
$58,581
Salary/wage: $36,080 (reported on 80.3% of returns)
Here:
$36,080
State:
$45,973
(% of AGI for various income ranges: 73.3% for AGIs below $25k, 79.6% for AGIs $25k-50k, 78.4% for AGIs $50k-75k, 91.5% for AGIs $75k-100k, 60.4% for AGIs $100k-200k)
Taxable interest for individuals: $667 (reported on 24.6% of returns)
This zip code:
$667
Oklahoma:
$1,625
(% of AGI for various income ranges: 1.1% for AGIs below $25k, 0.6% for AGIs $25k-50k, 0.4% for AGIs $50k-75k, 0.2% for AGIs $75k-100k)
Ordinary dividends: $875 (reported on 6.6% of returns)
Here:
$875
State:
$6,374
Profit/loss from business: +$9,825 (reported on 13.1% of returns)
Here:
+$9,825
State:
+$11,913
(% of AGI for various income ranges: 8.1% for AGIs below $25k, 1.2% for AGIs $25k-50k, 8.4% for AGIs $50k-75k)
Taxable individual retirement arrangement distribution: $6,600 (reported on 4.9% of returns)
74852:
$6,600
Oklahoma:
$15,242
Total itemized deductions: $17,855 (24% of AGI, reported on 18.0% of returns)
Here:
$17,855
State:
$24,882
Here:
23.8% of AGI
State:
18.8% of AGI
(% of AGI for various income ranges: 15.4% for AGIs $25k-50k, 9.4% for AGIs $75k-100k, 14.8% for AGIs $100k-200k)
Charity contributions: $4,675 (reported on 13.1% of returns)
Here:
$4,675
State:
$6,591
(% of AGI for various income ranges: 3.0% for AGIs below $25k, 2.8% for AGIs $50k-75k, 2.9% for AGIs $100k-200k)
Taxes paid: $3,518 (reported on 18.0% of returns)
74852:
$3,518
State:
$7,196
(% of AGI for various income ranges: 2.2% for AGIs $25k-50k, 2.2% for AGIs $75k-100k, 3.8% for AGIs $100k-200k)
Earned income credit: $2,629 (reported on 23.0% of returns)
Here:
$2,629
State:
$2,354
(% of AGI for various income ranges: 9.1% for AGIs below $25k, 1.0% for AGIs $25k-50k)
Percentage of individuals using paid preparers for their 2012 taxes: 57.4%
Here:
57%
State:
56%
(% for various income ranges: 55.6% for AGIs below $25k, 58.8% for AGIs $25k-50k, 55.6% for AGIs $50k-75k, 60.0% for AGIs $75k-100k, 66.7% for AGIs $100k-200k)
Averages for the 2004 tax year for zip code 74852, filed in 2005:
Average Adjusted Gross Income (AGI) in 2004: $28,455 (Individual Income Tax Returns)
Here:
$28,455
State:
$41,245
Salary/wage: $28,591 (reported on 83.0% of returns)
Here:
$28,591
State:
$35,318
(% of AGI for various income ranges: 93.1% for AGIs below $10k, 76.2% for AGIs $10k-25k, 85.6% for AGIs $25k-50k, 89.5% for AGIs $50k-75k, 80.4% for AGIs $75k-100k, 68.9% for AGIs over 100k)
Taxable interest for individuals: $707 (reported on 29.2% of returns)
This zip code:
$707
Oklahoma:
$1,745
(% of AGI for various income ranges: 4.0% for AGIs below $10k, 1.9% for AGIs $10k-25k, 0.4% for AGIs $25k-50k, 0.4% for AGIs $50k-75k, 0.3% for AGIs $75k-100k)
Taxable dividends: $467 (reported on 7.9% of returns)
Here:
$467
State:
$2,920
Net capital gain/loss: +$121 (reported on 5.8% of returns)
Here:
+$121
State:
+$10,653
Profit/loss from business: +$5,477 (reported on 19.1% of returns)
Here:
+$5,477
State:
+$8,532
(% of AGI for various income ranges: 23.0% for AGIs below $10k, 8.4% for AGIs $10k-25k, 3.6% for AGIs $25k-50k, 0.7% for AGIs $50k-75k)
IRA payment deduction: $1,900 (reported on 1.8% of returns)
74852:
$1,900
Oklahoma:
$3,127
Total itemized deductions: $14,600 (29% of AGI, reported on 20.1% of returns)
Here:
$14,600
State:
$17,093
Here:
28.9% of AGI
State:
20.5% of AGI
(% of AGI for various income ranges: 10.1% for AGIs $10k-25k, 8.9% for AGIs $25k-50k, 12.6% for AGIs $50k-75k, 20.8% for AGIs $75k-100k)
Charity contributions deductions: $2,461 (5% of AGI, reported on 13.3% of returns)
Here:
$2,461
State:
$4,240
Here:
4.5% of AGI
State:
4.8% of AGI
(% of AGI for various income ranges: 0.5% for AGIs $10k-25k, 0.8% for AGIs $25k-50k, 2.0% for AGIs $50k-75k, 2.6% for AGIs $75k-100k)
Total tax: $2,898 (reported on 66.7% of returns)
74852:
$2,898
State:
$6,542
(% of AGI for various income ranges: 4.2% for AGIs below $10k, 3.8% for AGIs $10k-25k, 5.3% for AGIs $25k-50k, 8.1% for AGIs $50k-75k, 9.4% for AGIs $75k-100k, 13.8% for AGIs over 100k)
Earned income credit: $1,761 (reported on 24.2% of returns)
Here:
$1,761
State:
$1,830
Percentage of individuals using paid preparers for their 2004 taxes: 67.8%
Here:
68%
State:
63%
(% for various income ranges: 63.8% for AGIs below $10k, 69.5% for AGIs $10k-25k, 67.1% for AGIs $25k-50k, 72.2% for AGIs $50k-75k, 105.3% for AGIs $75k-100k)
Household received Food Stamps/SNAP in the past 12 months: 133 Household did not receive Food Stamps/SNAP in the past 12 months: 443
Women who had a birth in the past 12 months: 19 (11 now married, 7 unmarried) Women who did not have a birth in the past 12 months: 290 (178 now married, 112 unmarried)
Housing units in zip code 74852 with a mortgage: 153 (9 second mortgage) Median monthly owner costs for units with a mortgage: $1,167 Median monthly owner costs for units without a mortgage: $399
Residents with income below the poverty level in 2022:
This zip code:
17.1%
Whole state:
15.7%
Residents with income below 50% of the poverty level in 2022:
This zip code:
12.5%
Whole state:
8.3%
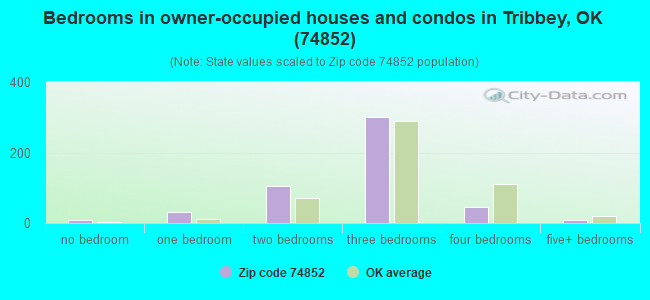
Median number of rooms in houses and condos:
Here:
5.3
State:
6.1
Median number of rooms in apartments:
Here:
5.6
State:
4.5
Notable locations in this zip code not listed on our city pages
Cemeteries: Friendship Cemetery (1), Mars Hill Cemetery (2), Pleasant Valley Cemetery (3), Prairie View Cemetery (4), Prospect Cemetery (5), Romulus Cemetery (6), Tribbey Cemetery (7). Display/hide their locations on the map
Reservoirs: Salt Creek Site 3 Reservoir (A), Salt Creek Site 2 Reservoir (B), Salt Creek Site 1 Reservoir (C), Rocky Reservoir (D), Oknoname 12513 Reservoir (E), E T Cope Reservoir (F), Jesse McGaha Reservoir (G), Glen Nix Reservoir (H). Display/hide their locations on the map
Size of family households: 151 2-persons, 149 3-persons, 48 4-persons, 44 5-persons, 22 6-persons, 5 7-or-more-persons
Size of nonfamily households: 121 1-person, 24 2-persons
228 married couples with children.
63 single-parent households (26 men, 37 women).
92.6% of residents of 74852 zip code speak English at home.
4.4% of residents speak Spanish at home (48% very well, 45% not well, 6% not at all).
0.8% of residents speak other Indo-European language at home (55% well, 45% not well).
1.3% of residents speak Asian or Pacific Island language at home (83% very well, 17% well).
0.6% of residents speak other language at home (62% very well, 38% well).
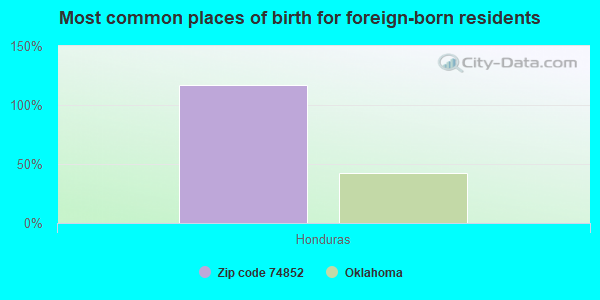
Foreign born population: 6 (0.5%) (100.0% of them are naturalized citizens)
This zip code:
0.5%
Whole state:
6.0%
117%Honduras
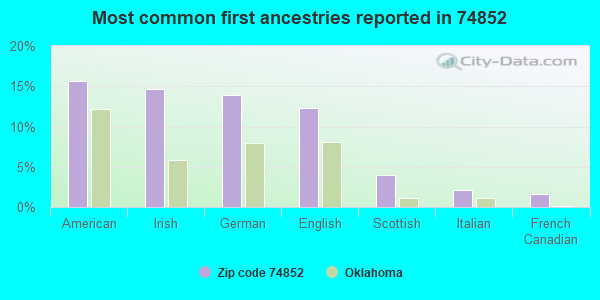
16%American
15%Irish
14%German
12%English
4%Scottish
2%Italian
2%French Canadian
Year of entry for the foreign-born population
02010 or later
32000 to 2009
21990 to 1999
0Before 1990
Facilities with environmental interests located in this zip code:
MACOMB ES (HWY 59B & MAIN ST. in MACOMB, OK)
(National Center for Education Statistics) - STATE ID-63-I004-110
MACOMB HS (HWY 59B & MAIN ST. in MACOMB, OK)
(National Center for Education Statistics) - STATE ID-63-I004-705
BP PIPELINES - TRIBBEY STATION (18.5M SOUTH OF I-40 ON HWY 102 in MACOMB, OK)
(Resource Conservation and Recovery Act (tracking hazardous waste)) Organizations: BP PIPELINES (NORTH AMERICA) INC (CONTACT/OWNER)
Alternative names: AMOCO PIPELINE CO TRIBBEY PUMP STATION
BP PIPELINES NORTH /TRIBBEY STA (3 MI W & 3 MI S in MACOMB, OK)
AIR MINOR (AIRS/AFS) Business SIC classification: CRUDE PETROLEUM PIPELINES Alternative names: AMOCO PIPELINE CO /TRIBBEY STA
MACOMB PUBLIC SCHOOLS (MACOMB RD (P O BOX 101) in MACOMB, OK)
COMPLIANCE ACTIVITY (Tracking inspections of insecticide, fungicide, and rodenticide, and toxic substances)
Housing units lacking complete plumbing facilities: 8.2% Housing units lacking complete kitchen facilities: 5.2%
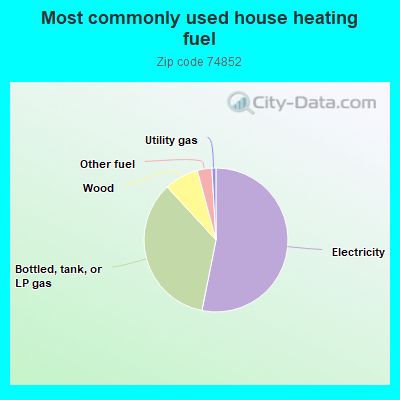
53.4%Electricity
35.2%Bottled, tank, or LP gas
7.7%Wood
3.3%Other fuel
0.9%Utility gas
Population in 1990: 1,005. Population change in the 1990s: +445 (+44.3%).
Place of birth for U.S.-born residents:
This state: 1,044
Northeast: 24
Midwest: 143
South: 179
West: 112
59% of the 74852 zip code residents lived in the same house 5 years ago. Out of people who lived in different houses, 39% lived in this county. Out of people who lived in different counties, 50% lived in Oklahoma.
91% of the 74852 zip code residents lived in the same house 1 year ago. Out of people who lived in different houses, 24% moved from this county. Out of people who lived in different houses, 73% moved from different county within same state. Out of people who lived in different houses, 4% moved from different state. Out of people who lived in different houses, 2% moved from abroad.
Private vs. public school enrollment:
Students in private schools in grades 1 to 8 (elementary and middle school): 25
Here:
23.0%
Oklahoma:
11.7%
Students in private schools in grades 9 to 12 (high school): 23
Here:
16.9%
Oklahoma:
11.7%
Students in private undergraduate colleges: 10
Here:
15.9%
Oklahoma:
19.3%
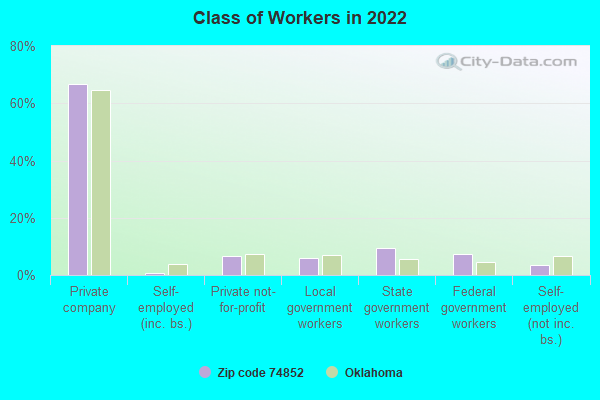
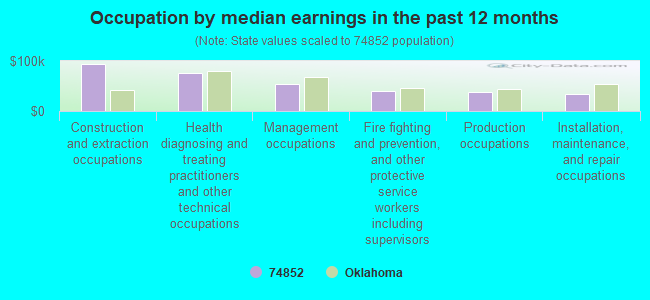
Occupation by median earnings in the past 12 months ($)
93,689Construction and extraction occupations
75,016Health diagnosing and treating practitioners and other technical occupations
53,846Management occupations
39,952Fire fighting and prevention, and other protective service workers including supervisors
37,089Production occupations
34,953Installation, maintenance, and repair occupations
Top industries in this zip code by the number of employees in 2005:
Health Care and Social Assistance: Services for the Elderly and Persons with Disabilities (20-49 employees: 1 establishment)
Professional, Scientific, and Technical Services: Engineering Services (10-19: 1)
Construction: Water and Sewer Line and Related Structures Construction (5-9: 1)
Construction: Tile and Terrazzo Contractors (5-9: 1)
Construction: Plumbing, Heating, and Air-Conditioning Contractors (5-9: 1)
Administrative and Support and Waste Management and Remediation Services: Janitorial Services (1-4: 1)
Other Services (except Public Administration): Religious Organizations (1-4: 1)
Construction: Roofing Contractors (1-4: 1)
Fatal accident statistics in 2012:
Fatal accident count: 1
Vehicles involved in fatal accidents: 2
Fatal accidents caused by drunken drivers: 0
Fatalities: 4
Persons involved in fatal accidents: 4
Pedestrians involved in fatal accidents: 0
Home Mortgage Disclosure Act Aggregated Statistics For Year 2003 (Based on 4 partial tracts)
A) FHA, FSA/RHS & VA Home Purchase Loans
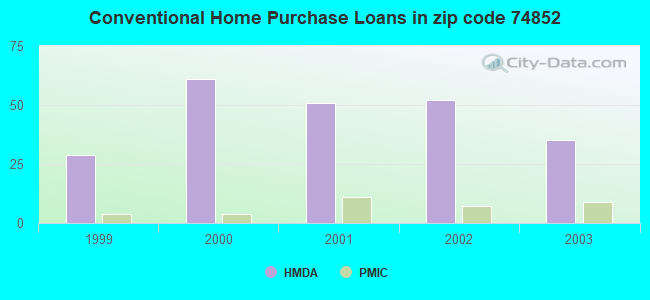
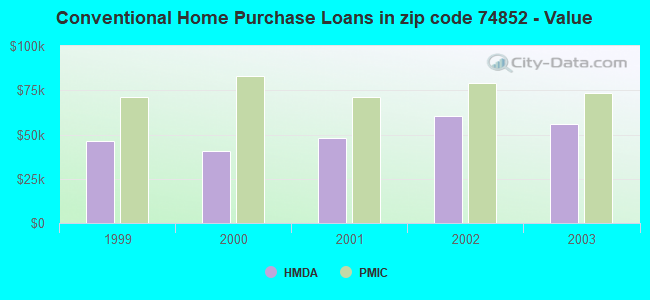
B) Conventional Home Purchase Loans
C) Refinancings
D) Home Improvement Loans
F) Non-occupant Loans on < 5 Family Dwellings (A B C & D)
Number
Average Value
Number
Average Value
Number
Average Value
Number
Average Value
Number
Average Value
LOANS ORIGINATED
15
$81,719
35
$55,757
122
$69,351
32
$17,714
14
$37,107
APPLICATIONS APPROVED, NOT ACCEPTED
1
$38,550
6
$54,908
18
$79,273
1
$5,060
1
$39,180
APPLICATIONS DENIED
3
$68,257
17
$54,537
66
$75,958
9
$12,857
3
$34,757
APPLICATIONS WITHDRAWN
1
$79,000
4
$62,725
26
$85,515
1
$10,680
0
$0
FILES CLOSED FOR INCOMPLETENESS
2
$77,105
3
$71,417
8
$67,400
0
$0
0
$0
Aggregated Statistics For Year 2002 (Based on 4 partial tracts)
A) FHA, FSA/RHS & VA Home Purchase Loans
B) Conventional Home Purchase Loans
C) Refinancings
D) Home Improvement Loans
F) Non-occupant Loans on < 5 Family Dwellings (A B C & D)
Number
Average Value
Number
Average Value
Number
Average Value
Number
Average Value
Number
Average Value
LOANS ORIGINATED
14
$66,444
52
$60,280
87
$62,786
31
$15,187
14
$39,946
APPLICATIONS APPROVED, NOT ACCEPTED
1
$100,490
6
$50,433
12
$67,367
3
$24,820
1
$6,320
APPLICATIONS DENIED
3
$76,260
24
$38,873
49
$53,396
14
$9,691
2
$10,745
APPLICATIONS WITHDRAWN
0
$0
6
$74,260
22
$68,223
3
$21,067
1
$6,320
FILES CLOSED FOR INCOMPLETENESS
2
$69,520
1
$81,530
10
$102,546
0
$0
0
$0
Aggregated Statistics For Year 2001 (Based on 4 partial tracts)
A) FHA, FSA/RHS & VA Home Purchase Loans
B) Conventional Home Purchase Loans
C) Refinancings
D) Home Improvement Loans
F) Non-occupant Loans on < 5 Family Dwellings (A B C & D)
Number
Average Value
Number
Average Value
Number
Average Value
Number
Average Value
Number
Average Value
LOANS ORIGINATED
10
$70,591
51
$47,858
69
$64,230
25
$21,789
13
$28,405
APPLICATIONS APPROVED, NOT ACCEPTED
2
$56,530
10
$44,080
8
$40,211
4
$18,670
0
$0
APPLICATIONS DENIED
1
$58,140
28
$47,808
63
$46,583
17
$16,578
2
$75,260
APPLICATIONS WITHDRAWN
2
$63,830
6
$44,522
30
$63,217
9
$24,087
2
$27,175
FILES CLOSED FOR INCOMPLETENESS
0
$0
1
$18,330
7
$52,456
0
$0
1
$12,640
Aggregated Statistics For Year 2000 (Based on 4 partial tracts)
A) FHA, FSA/RHS & VA Home Purchase Loans
B) Conventional Home Purchase Loans
C) Refinancings
D) Home Improvement Loans
F) Non-occupant Loans on < 5 Family Dwellings (A B C & D)
Number
Average Value
Number
Average Value
Number
Average Value
Number
Average Value
Number
Average Value
LOANS ORIGINATED
9
$64,113
61
$40,942
53
$44,526
25
$14,216
13
$32,988
APPLICATIONS APPROVED, NOT ACCEPTED
1
$41,080
10
$56,279
17
$38,888
4
$27,808
1
$13,270
APPLICATIONS DENIED
4
$47,395
57
$38,279
48
$44,269
24
$13,690
3
$14,110
APPLICATIONS WITHDRAWN
0
$0
8
$47,409
24
$48,165
3
$32,003
1
$42,340
FILES CLOSED FOR INCOMPLETENESS
1
$37,920
1
$55,620
5
$58,384
0
$0
0
$0
Aggregated Statistics For Year 1999 (Based on 2 partial tracts)
A) FHA, FSA/RHS & VA Home Purchase Loans
B) Conventional Home Purchase Loans
C) Refinancings
D) Home Improvement Loans
F) Non-occupant Loans on < 5 Family Dwellings (A B C & D)
Detailed PMIC statistics for the following Tracts:5011.02
, 5012.01
2004 - 2018 National Fire Incident Reporting System (NFIRS) incidents
According to the data from the years 2004 - 2018 the average number of fire incidents per year is 10. The highest number of fires - 20 took place in 2014, and the least - 1 in 2010. The data has an increasing trend.
When looking into fire subcategories, the most incidents belonged to: Outside Fires (68.5%), and Structure Fires (28.9%).
Fire incident types reported to NFIRS in Zip Code 74852

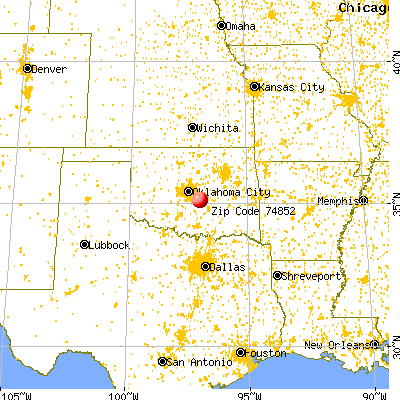


 Nearest zip codes: 74873, 74878, 74826, 74801, 74831, 74840.


 According to the data from the years 2004 - 2018 the average number of fire incidents per year is 10. The highest number of fires - 20 took place in 2014, and the least - 1 in 2010. The data has an increasing trend.
 When looking into fire subcategories, the most incidents belonged to: Outside Fires (68.5%), and Structure Fires (28.9%).