Estimated zip code population in 2022: 1,952 Zip code population in 2010: 1,992 Zip code population in 2000: 2,215
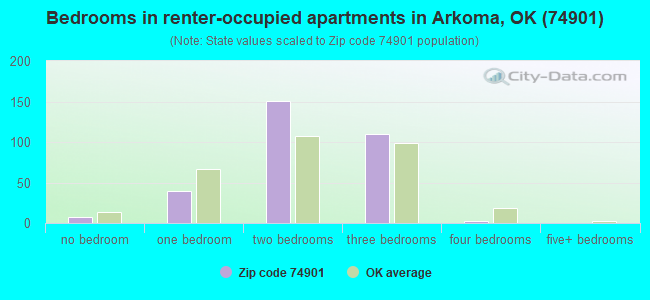
Houses and condos: 850 Renter-occupied apartments: 309
% of renters here:
41%
State:
35%
March 2022 cost of living index in zip code 74901: 77.6 (low, U.S. average is 100)
Land area: 11.8 sq. mi. Water area: 0.4 sq. mi.
Population density: 166 people per square mile
(very low).
OSM Map
General Map
Google Map
MSN Map
OSM Map
General Map
Google Map
MSN Map
OSM Map
General Map
Google Map
MSN Map
OSM Map
General Map
Google Map
MSN Map
Please wait while loading the map...
Real estate property taxes paid for housing units in 2022:
This zip code:
0.5% ($316)
Oklahoma:
0.8% ($1,501)
Median real estate property taxes paid for housing units with mortgages in 2022: $464 (0.5%) Median real estate property taxes paid for housing units with no mortgage in 2022: $256 (0.5%)
Business Search- 14 Million verified businesses
Males: 958
(49.1%)
Females: 994
(50.9%)
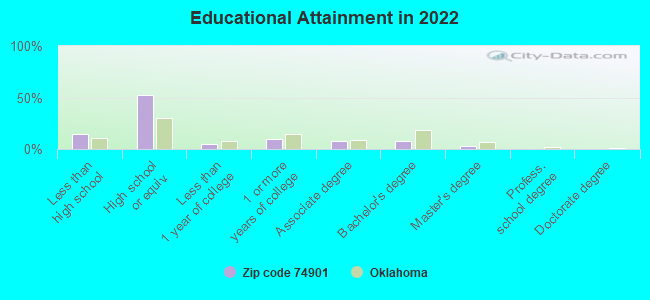
For population 25 years and over in 74901:
High school or higher: 84.5%
Bachelor's degree or higher: 11.1%
Graduate or professional degree: 3.2%
Unemployed: 8.9%
Mean travel time to work (commute): 18.8 minutes
For population 15 years and over in 74901:
Never married: 31.1%
Now married: 37.9%
Separated: 4.9%
Widowed: 10.9%
Divorced: 15.1%
Zip code 74901 compared to state average:
Median household income below state average.
Median house value significantly below state average.
Unemployed percentage above state average.
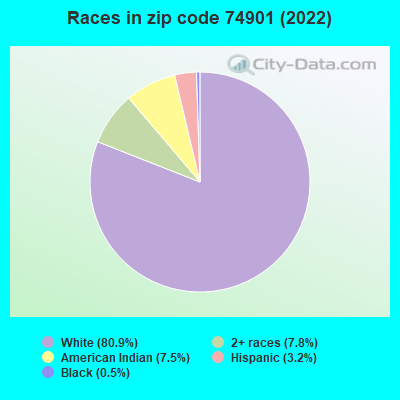
Black race population percentage significantly below state average.
Hispanic race population percentage significantly below state average.
Foreign-born population percentage significantly below state average.
Length of stay since moving in significantly above state average.
Number of college students significantly below state average.
Percentage of population with a bachelor's degree or higher significantly below state average.
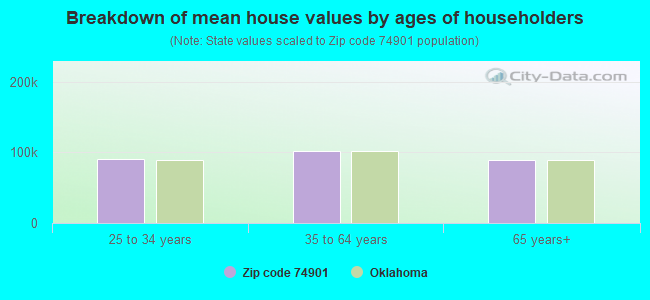
Estimated median house/condo value in 2022: $65,661
74901:
$65,661
Oklahoma:
$191,700
According to our research of Oklahoma and other state lists, there were 4 registered sex offenders living in 74901 zip code as of May 28, 2024. The ratio of all residents to sex offenders in zip code 74901 is 485 to 1. The ratio of registered sex offenders to all residents in this zip code is near the state average.
Median resident age:
This zip code:
35.6 years
Oklahoma median age:
37.1 years
Average household size:
This zip code:
2.5 people
Oklahoma:
2.5 people
Averages for the 2020 tax year for zip code 74901, filed in 2021:
Average Adjusted Gross Income (AGI) in 2020: $34,395 (Individual Income Tax Returns)
Here:
$34,395
State:
$63,060
Salary/wage: $31,747 (reported on 81.5% of returns)
Here:
$31,747
State:
$52,427
(% of AGI for various income ranges: 1207.5% for AGIs below $25k, 3164.1% for AGIs $25k-50k, 6407.1% for AGIs $50k-75k, 10160.0% for AGIs $75k-100k)
Taxable interest for individuals: $112 (reported on 12.3% of returns)
This zip code:
$112
Oklahoma:
$1,603
(% of AGI for various income ranges: 2.1% for AGIs below $25k, 1.2% for AGIs $25k-50k, 5.0% for AGIs $75k-100k)
Profit/loss from business: +$4,786 (reported on 10.8% of returns)
Here:
+$4,786
State:
+$9,904
(% of AGI for various income ranges: 108.7% for AGIs below $25k, 43.5% for AGIs $25k-50k)
Taxable individual retirement arrangement distribution: $8,500 (reported on 4.6% of returns)
74901:
$8,500
Oklahoma:
$20,476
(% of AGI for various income ranges: 106.2% for AGIs below $25k)
Earned income credit: $2,840 (reported on 30.8% of returns)
Here:
$2,840
State:
$2,435
(% of AGI for various income ranges: 153.8% for AGIs below $25k, 117.1% for AGIs $25k-50k)
Percentage of individuals using paid preparers for their 2020 taxes: 96.9%
Here:
97%
State:
94%
(% for various income ranges: 96.7% for AGIs below $25k, 94.7% for AGIs $25k-50k, 100.0% for AGIs $50k-75k, 100.0% for AGIs $75k-100k, 100.0% for AGIs $100k-200k)
Averages for the 2012 tax year for zip code 74901, filed in 2013:
Average Adjusted Gross Income (AGI) in 2012: $30,986 (Individual Income Tax Returns)
Here:
$30,986
State:
$58,581
Salary/wage: $26,658 (reported on 85.5% of returns)
Here:
$26,658
State:
$45,973
(% of AGI for various income ranges: 81.0% for AGIs below $25k, 79.5% for AGIs $25k-50k, 74.9% for AGIs $50k-75k, 129.3% for AGIs $75k-100k)
Taxable interest for individuals: $491 (reported on 15.9% of returns)
This zip code:
$491
Oklahoma:
$1,625
(% of AGI for various income ranges: 0.4% for AGIs below $25k, 0.1% for AGIs $25k-50k, 0.3% for AGIs $50k-75k, 0.4% for AGIs $75k-100k)
Ordinary dividends: $767 (reported on 4.3% of returns)
Here:
$767
State:
$6,374
Profit/loss from business: +$6,800 (reported on 10.1% of returns)
Here:
+$6,800
State:
+$11,913
(% of AGI for various income ranges: 5.6% for AGIs below $25k, 3.1% for AGIs $25k-50k)
Taxable individual retirement arrangement distribution: $8,550 (reported on 5.8% of returns)
74901:
$8,550
Oklahoma:
$15,242
Total itemized deductions: $15,712 (25% of AGI, reported on 11.6% of returns)
Here:
$15,712
State:
$24,882
Here:
24.6% of AGI
State:
18.8% of AGI
(% of AGI for various income ranges: 6.1% for AGIs below $25k, 9.2% for AGIs $50k-75k, 20.8% for AGIs $75k-100k)
Charity contributions: $3,950 (reported on 5.8% of returns)
Here:
$3,950
State:
$6,591
Taxes paid: $3,288 (reported on 11.6% of returns)
74901:
$3,288
State:
$7,196
(% of AGI for various income ranges: 0.7% for AGIs below $25k, 1.8% for AGIs $50k-75k, 5.9% for AGIs $75k-100k)
Earned income credit: $2,332 (reported on 36.2% of returns)
Here:
$2,332
State:
$2,354
(% of AGI for various income ranges: 9.4% for AGIs below $25k, 1.6% for AGIs $25k-50k)
Percentage of individuals using paid preparers for their 2012 taxes: 66.7%
Here:
67%
State:
56%
(% for various income ranges: 64.1% for AGIs below $25k, 64.7% for AGIs $25k-50k, 75.0% for AGIs $50k-75k, 133.3% for AGIs $75k-100k)
Averages for the 2004 tax year for zip code 74901, filed in 2005:
Average Adjusted Gross Income (AGI) in 2004: $25,766 (Individual Income Tax Returns)
Here:
$25,766
State:
$41,245
Salary/wage: $24,953 (reported on 87.2% of returns)
Here:
$24,953
State:
$35,318
(% of AGI for various income ranges: 91.6% for AGIs below $10k, 83.2% for AGIs $10k-25k, 87.2% for AGIs $25k-50k, 83.9% for AGIs $50k-75k, 77.6% for AGIs $75k-100k)
Taxable interest for individuals: $1,142 (reported on 21.4% of returns)
This zip code:
$1,142
Oklahoma:
$1,745
(% of AGI for various income ranges: 3.1% for AGIs below $10k, 1.3% for AGIs $10k-25k, 0.8% for AGIs $25k-50k, 0.9% for AGIs $50k-75k, 0.2% for AGIs $75k-100k)
Taxable dividends: $312 (reported on 6.6% of returns)
Here:
$312
State:
$2,920
Net capital gain/loss: +$143 (reported on 5.8% of returns)
Here:
+$143
State:
+$10,653
Profit/loss from business: +$4,407 (reported on 11.9% of returns)
Here:
+$4,407
State:
+$8,532
(% of AGI for various income ranges: 6.4% for AGIs below $10k, 6.1% for AGIs $10k-25k, 0.4% for AGIs $25k-50k, 0.4% for AGIs $50k-75k)
Total itemized deductions: $12,758 (25% of AGI, reported on 12.6% of returns)
Here:
$12,758
State:
$17,093
Here:
24.6% of AGI
State:
20.5% of AGI
Charity contributions deductions: $3,487 (7% of AGI, reported on 10.5% of returns)
Here:
$3,487
State:
$4,240
Here:
6.9% of AGI
State:
4.8% of AGI
Total tax: $2,457 (reported on 65.8% of returns)
74901:
$2,457
State:
$6,542
(% of AGI for various income ranges: 2.7% for AGIs below $10k, 3.3% for AGIs $10k-25k, 6.1% for AGIs $25k-50k, 7.9% for AGIs $50k-75k, 11.1% for AGIs $75k-100k)
Earned income credit: $1,938 (reported on 30.9% of returns)
Here:
$1,938
State:
$1,830
Percentage of individuals using paid preparers for their 2004 taxes: 75.0%
Here:
75%
State:
63%
(% for various income ranges: 70.9% for AGIs below $10k, 78.5% for AGIs $10k-25k, 75.8% for AGIs $25k-50k, 66.7% for AGIs $50k-75k, 80.0% for AGIs $75k-100k)
Household received Food Stamps/SNAP in the past 12 months: 261 Household did not receive Food Stamps/SNAP in the past 12 months: 518
Women who had a birth in the past 12 months: 35 (19 now married, 15 unmarried) Women who did not have a birth in the past 12 months: 357 (133 now married, 224 unmarried)
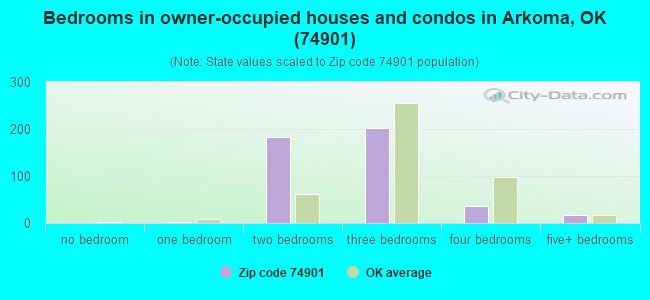
Housing units in zip code 74901 with a mortgage: 186 (1 second mortgage) Median monthly owner costs for units with a mortgage: $849 Median monthly owner costs for units without a mortgage: $290
Residents with income below the poverty level in 2022:
This zip code:
27.0%
Whole state:
15.7%
Residents with income below 50% of the poverty level in 2022:
This zip code:
16.0%
Whole state:
8.3%
Median number of rooms in houses and condos:
Here:
5.3
State:
6.1
Median number of rooms in apartments:
Here:
4.4
State:
4.5
Notable locations in this zip code not listed on our city pages
Churches in zip code 74901 include: Bethel Missionary Baptist Church (A), Arkoma Free Will Baptist Church (B), Assembly of God Church (C). Display/hide their locations on the map
In group quarters: 39 (-1 institutionalized population)
Size of family households: 222 2-persons, 89 3-persons, 82 4-persons, 43 5-persons, 13 6-persons, 7 7-or-more-persons
Size of nonfamily households: 263 1-person, 28 2-persons, 3 3-persons
208 married couples with children.
182 single-parent households (20 men, 162 women).
98.6% of residents of 74901 zip code speak English at home.
1.1% of residents speak Spanish at home (75% very well, 25% not well).
0.2% of residents speak Asian or Pacific Island language at home (100% very well).
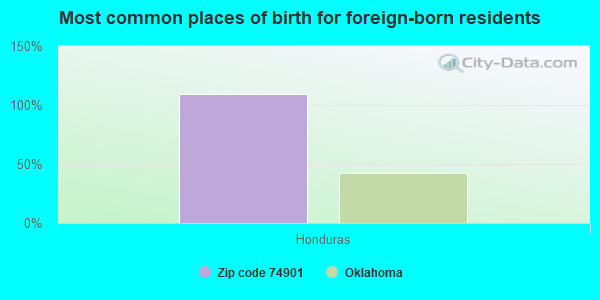
Foreign born population: 11 (0.6%) (41.8% of them are naturalized citizens)
This zip code:
0.6%
Whole state:
6.0%
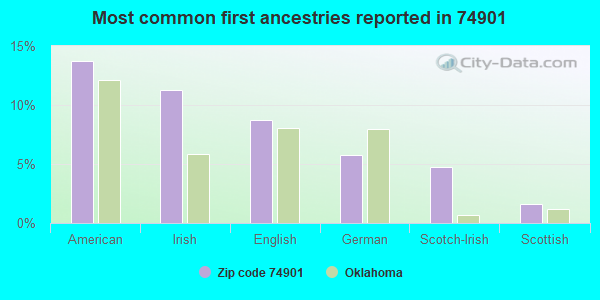
109%Honduras
14%American
11%Irish
9%English
6%German
5%Scotch-Irish
2%Scottish
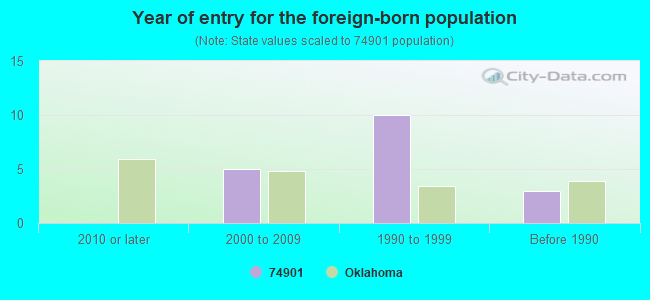
Year of entry for the foreign-born population
02010 or later
52000 to 2009
101990 to 1999
3Before 1990
Facilities with environmental interests located in this zip code:
ARKOMA JHS (100 BLOCKER in ARKOMA, OK)
(National Center for Education Statistics) - STATE ID-40-I091-615 (National Center for Education Statistics) - STATE ID-40-I091-715
ARKOMA ES (622 COOK STREET in ARKOMA, OK)
(National Center for Education Statistics) - STATE ID-40-I091-105
Housing units lacking complete plumbing facilities: 0.5% Housing units lacking complete kitchen facilities: 4.0%
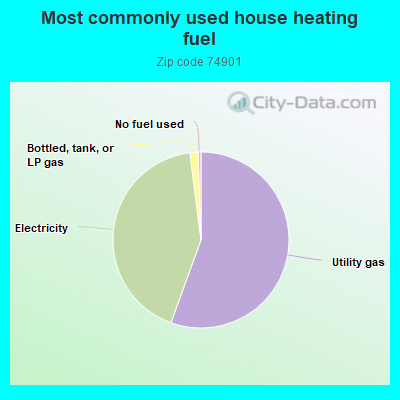
55.5%Utility gas
42.4%Electricity
1.5%Bottled, tank, or LP gas
0.5%No fuel used
Population in 1990: 2,764.
Place of birth for U.S.-born residents:
This state: 394
Northeast: 27
Midwest: 101
South: 1,219
West: 211
64% of the 74901 zip code residents lived in the same house 5 years ago. Out of people who lived in different houses, 50% lived in this county. Out of people who lived in different counties, 50% lived in Oklahoma.
92% of the 74901 zip code residents lived in the same house 1 year ago. Out of people who lived in different houses, 37% moved from this county. Out of people who lived in different houses, 20% moved from different county within same state. Out of people who lived in different houses, 50% moved from different state.
Private vs. public school enrollment:
Students in private schools in grades 1 to 8 (elementary and middle school): 27
Here:
12.1%
Oklahoma:
11.7%
Students in private schools in grades 9 to 12 (high school):
Here:
0.0%
Oklahoma:
11.7%
Students in private undergraduate colleges: 3
Here:
18.4%
Oklahoma:
19.3%
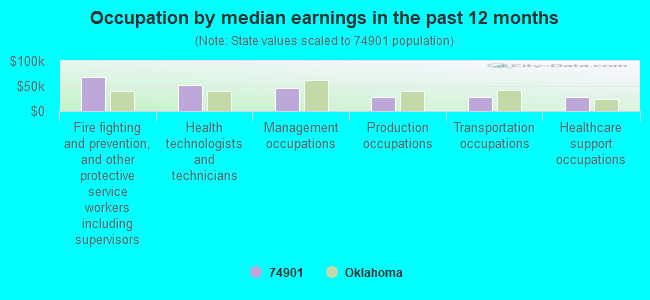
Occupation by median earnings in the past 12 months ($)
67,043Fire fighting and prevention, and other protective service workers including supervisors
52,029Health technologists and technicians
46,188Management occupations
28,853Production occupations
27,970Transportation occupations
27,116Healthcare support occupations
Top industries in this zip code by the number of employees in 2005:
Construction: Water and Sewer Line and Related Structures Construction (20-49 employees: 1 establishment)
Health Care and Social Assistance: Nursing Care Facilities (20-49: 1)
Administrative and Support and Waste Management and Remediation Services: Repossession Services (20-49: 1)
Accommodation and Food Services: Snack and Nonalcoholic Beverage Bars (20-49: 1)
Mining: Crude Petroleum and Natural Gas Extraction (10-19: 1)
Health Care and Social Assistance: Child Day Care Services (5-9: 1, 1-4: 1)
Other Services (except Public Administration): Religious Organizations (5-9: 1)
Finance and Insurance: Consumer Lending (1-4: 3)
Administrative and Support and Waste Management and Remediation Services: Office Administrative Services (1-4: 1)
People in group quarters in 2010:
47 people in nursing facilities/skilled-nursing facilities
People in group quarters in 2000:
46 people in nursing homes
Home Mortgage Disclosure Act Aggregated Statistics For Year 2009 (Based on 4 partial tracts)
A) FHA, FSA/RHS & VA Home Purchase Loans
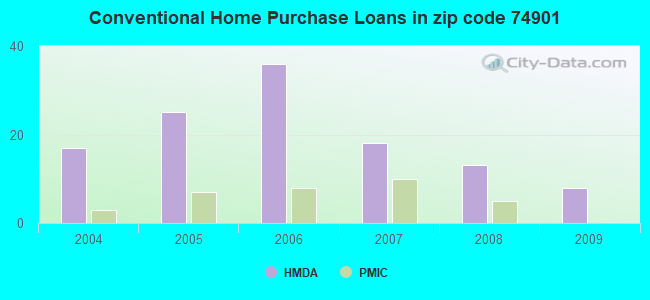
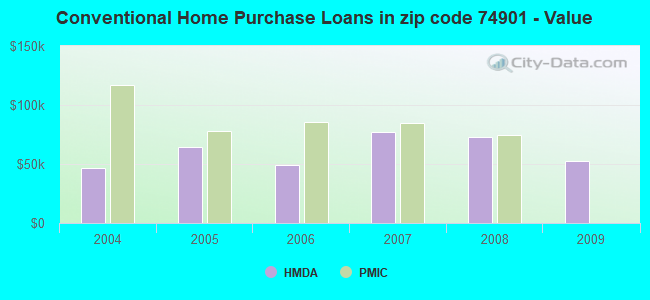
B) Conventional Home Purchase Loans
C) Refinancings
D) Home Improvement Loans
F) Non-occupant Loans on < 5 Family Dwellings (A B C & D)
G) Loans On Manufactured Home Dwelling (A B C & D)
Number
Average Value
Number
Average Value
Number
Average Value
Number
Average Value
Number
Average Value
Number
Average Value
LOANS ORIGINATED
8
$91,701
8
$52,164
31
$80,075
7
$13,011
3
$32,017
3
$4,417
APPLICATIONS APPROVED, NOT ACCEPTED
0
$0
0
$0
2
$51,335
3
$15,457
0
$0
0
$0
APPLICATIONS DENIED
8
$61,065
5
$51,668
15
$74,079
5
$54,316
0
$0
0
$0
APPLICATIONS WITHDRAWN
2
$71,210
0
$0
3
$66,240
0
$0
0
$0
0
$0
FILES CLOSED FOR INCOMPLETENESS
0
$0
0
$0
0
$0
0
$0
0
$0
0
$0
Aggregated Statistics For Year 2008 (Based on 4 partial tracts)
A) FHA, FSA/RHS & VA Home Purchase Loans
B) Conventional Home Purchase Loans
C) Refinancings
D) Home Improvement Loans
F) Non-occupant Loans on < 5 Family Dwellings (A B C & D)
G) Loans On Manufactured Home Dwelling (A B C & D)
Number
Average Value
Number
Average Value
Number
Average Value
Number
Average Value
Number
Average Value
Number
Average Value
LOANS ORIGINATED
5
$90,418
13
$72,482
20
$64,418
12
$27,048
3
$29,257
2
$28,150
APPLICATIONS APPROVED, NOT ACCEPTED
2
$19,870
2
$42,230
5
$61,934
2
$15,730
0
$0
3
$41,400
APPLICATIONS DENIED
2
$88,595
3
$38,087
15
$68,559
12
$22,770
2
$27,325
2
$14,075
APPLICATIONS WITHDRAWN
0
$0
2
$103,500
12
$88,320
3
$52,440
0
$0
0
$0
FILES CLOSED FOR INCOMPLETENESS
0
$0
5
$93,398
2
$67,070
0
$0
0
$0
2
$26,495
Aggregated Statistics For Year 2007 (Based on 4 partial tracts)
A) FHA, FSA/RHS & VA Home Purchase Loans
B) Conventional Home Purchase Loans
C) Refinancings
D) Home Improvement Loans
F) Non-occupant Loans on < 5 Family Dwellings (A B C & D)
G) Loans On Manufactured Home Dwelling (A B C & D)
Number
Average Value
Number
Average Value
Number
Average Value
Number
Average Value
Number
Average Value
Number
Average Value
LOANS ORIGINATED
10
$93,067
18
$77,096
25
$58,092
10
$25,668
3
$20,423
0
$0
APPLICATIONS APPROVED, NOT ACCEPTED
2
$32,290
2
$48,850
0
$0
2
$4,970
0
$0
2
$32,290
APPLICATIONS DENIED
5
$82,468
10
$52,992
20
$73,030
22
$30,561
2
$12,420
8
$34,155
APPLICATIONS WITHDRAWN
3
$89,977
10
$48,355
10
$74,354
3
$72,863
0
$0
0
$0
FILES CLOSED FOR INCOMPLETENESS
0
$0
2
$82,800
2
$65,410
0
$0
0
$0
0
$0
Aggregated Statistics For Year 2006 (Based on 4 partial tracts)
A) FHA, FSA/RHS & VA Home Purchase Loans
B) Conventional Home Purchase Loans
C) Refinancings
D) Home Improvement Loans
F) Non-occupant Loans on < 5 Family Dwellings (A B C & D)
G) Loans On Manufactured Home Dwelling (A B C & D)
Number
Average Value
Number
Average Value
Number
Average Value
Number
Average Value
Number
Average Value
Number
Average Value
LOANS ORIGINATED
8
$109,296
36
$49,220
33
$59,666
8
$18,216
3
$27,047
3
$38,087
APPLICATIONS APPROVED, NOT ACCEPTED
0
$0
3
$62,377
2
$47,195
0
$0
0
$0
0
$0
APPLICATIONS DENIED
5
$70,876
10
$47,693
25
$59,351
17
$34,192
0
$0
2
$15,730
APPLICATIONS WITHDRAWN
0
$0
5
$71,208
15
$75,293
5
$15,236
0
$0
2
$16,560
FILES CLOSED FOR INCOMPLETENESS
0
$0
3
$70,657
2
$62,100
0
$0
0
$0
0
$0
Aggregated Statistics For Year 2005 (Based on 4 partial tracts)
A) FHA, FSA/RHS & VA Home Purchase Loans
B) Conventional Home Purchase Loans
C) Refinancings
D) Home Improvement Loans
F) Non-occupant Loans on < 5 Family Dwellings (A B C & D)
G) Loans On Manufactured Home Dwelling (A B C & D)
Number
Average Value
Number
Average Value
Number
Average Value
Number
Average Value
Number
Average Value
Number
Average Value
LOANS ORIGINATED
8
$72,658
25
$64,385
22
$50,132
23
$25,848
3
$49,127
0
$0
APPLICATIONS APPROVED, NOT ACCEPTED
0
$0
5
$45,044
7
$61,271
5
$29,146
0
$0
3
$45,263
APPLICATIONS DENIED
2
$50,510
25
$55,642
25
$55,509
26
$23,120
0
$0
8
$57,132
APPLICATIONS WITHDRAWN
7
$55,594
8
$37,260
26
$79,934
3
$30,360
7
$91,317
2
$6,625
FILES CLOSED FOR INCOMPLETENESS
0
$0
0
$0
2
$96,875
2
$41,400
0
$0
0
$0
Aggregated Statistics For Year 2004 (Based on 4 partial tracts)
A) FHA, FSA/RHS & VA Home Purchase Loans
B) Conventional Home Purchase Loans
C) Refinancings
D) Home Improvement Loans
F) Non-occupant Loans on < 5 Family Dwellings (A B C & D)
G) Loans On Manufactured Home Dwelling (A B C & D)
Detailed PMIC statistics for the following Tracts:0401.98
2005 - 2018 National Fire Incident Reporting System (NFIRS) incidents
Based on the data from the years 2005 - 2018 the average number of fires per year is 20. The highest number of fire incidents - 44 took place in 2016, and the least - 1 in 2005. The data has a rising trend.
When looking into fire subcategories, the most incidents belonged to: Outside Fires (45.9%), and Structure Fires (35.1%).
Fire incident types reported to NFIRS in Zip Code 74901

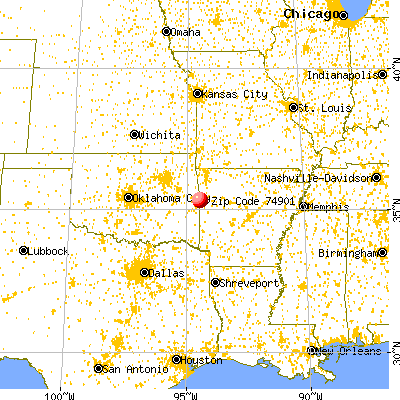


 Nearest zip codes: 72901, 74946, 72908, 72904, 72903, 74954.


 Based on the data from the years 2005 - 2018 the average number of fires per year is 20. The highest number of fire incidents - 44 took place in 2016, and the least - 1 in 2005. The data has a rising trend.
 When looking into fire subcategories, the most incidents belonged to: Outside Fires (45.9%), and Structure Fires (35.1%).