Estimated zip code population in 2022: 1,520 Zip code population in 2010: 1,153 Zip code population in 2000: 1,301
Houses and condos: 606 Renter-occupied apartments: 140
% of renters here:
27%
State:
35%
March 2022 cost of living index in zip code 74936: 78.9 (low, U.S. average is 100)
Land area: 24.5 sq. mi. Water area: 1.3 sq. mi.
Population density: 62 people per square mile
(very low).
OSM Map
General Map
Google Map
MSN Map
OSM Map
General Map
Google Map
MSN Map
OSM Map
General Map
Google Map
MSN Map
OSM Map
General Map
Google Map
MSN Map
Please wait while loading the map...
Real estate property taxes paid for housing units in 2022:
This zip code:
0.3% ($385)
Oklahoma:
0.8% ($1,501)
Median real estate property taxes paid for housing units with mortgages in 2022: $556 (0.3%) Median real estate property taxes paid for housing units with no mortgage in 2022: $256 (0.2%)
Business Search- 14 Million verified businesses
Males: 878
(57.8%)
Females: 642
(42.2%)
For population 25 years and over in 74936:
High school or higher: 81.9%
Bachelor's degree or higher: 15.6%
Graduate or professional degree: 3.9%
Unemployed: 6.9%
Mean travel time to work (commute): 29.1 minutes
For population 15 years and over in 74936:
Never married: 28.7%
Now married: 50.6%
Separated: 3.2%
Widowed: 4.5%
Divorced: 13.0%
Zip code 74936 compared to state average:
Median house value below state average.
Black race population percentage significantly below state average.
Hispanic race population percentage below state average.
Foreign-born population percentage significantly below state average.
Length of stay since moving in significantly above state average.
Number of college students below state average.
Percentage of population with a bachelor's degree or higher below state average.
Averages for the 2020 tax year for zip code 74936, filed in 2021:
Average Adjusted Gross Income (AGI) in 2020: $37,654 (Individual Income Tax Returns)
Here:
$37,654
State:
$63,060
Salary/wage: $35,308 (reported on 84.8% of returns)
Here:
$35,308
State:
$52,427
(% of AGI for various income ranges: 1380.0% for AGIs below $25k, 3737.3% for AGIs $25k-50k, 6588.0% for AGIs $50k-75k, 10737.5% for AGIs $75k-100k)
Taxable interest for individuals: $143 (reported on 15.2% of returns)
This zip code:
$143
Oklahoma:
$1,603
(% of AGI for various income ranges: 4.7% for AGIs below $25k, 6.0% for AGIs $50k-75k)
Ordinary dividends: $1,250 (reported on 4.3% of returns)
Here:
$1,250
State:
$7,001
(% of AGI for various income ranges: 16.7% for AGIs below $25k)
Net capital gain/loss in AGI: +$5,050 (reported on 4.3% of returns)
Here:
+$5,050
State:
+$19,855
(% of AGI for various income ranges: 67.3% for AGIs below $25k)
Profit/loss from business: +$5,443 (reported on 15.2% of returns)
Here:
+$5,443
State:
+$9,904
(% of AGI for various income ranges: 187.3% for AGIs below $25k, 90.9% for AGIs $25k-50k)
Earned income credit: $2,514 (reported on 30.4% of returns)
Here:
$2,514
State:
$2,435
(% of AGI for various income ranges: 155.3% for AGIs below $25k, 108.2% for AGIs $25k-50k)
Percentage of individuals using paid preparers for their 2020 taxes: 95.7%
Here:
96%
State:
94%
(% for various income ranges: 95.5% for AGIs below $25k, 92.3% for AGIs $25k-50k, 100.0% for AGIs $50k-75k, 100.0% for AGIs $75k-100k, 100.0% for AGIs $100k-200k)
Averages for the 2012 tax year for zip code 74936, filed in 2013:
Average Adjusted Gross Income (AGI) in 2012: $31,838 (Individual Income Tax Returns)
Here:
$31,838
State:
$58,581
Salary/wage: $29,678 (reported on 85.7% of returns)
Here:
$29,678
State:
$45,973
(% of AGI for various income ranges: 79.2% for AGIs below $25k, 88.0% for AGIs $25k-50k, 86.3% for AGIs $50k-75k, 62.2% for AGIs $75k-100k)
Taxable interest for individuals: $217 (reported on 14.3% of returns)
This zip code:
$217
Oklahoma:
$1,625
Ordinary dividends: $400 (reported on 4.8% of returns)
Here:
$400
State:
$6,374
Profit/loss from business: +$4,957 (reported on 16.7% of returns)
Here:
+$4,957
State:
+$11,913
Total itemized deductions: $24,650 (36% of AGI, reported on 9.5% of returns)
Here:
$24,650
State:
$24,882
Here:
36.0% of AGI
State:
18.8% of AGI
Charity contributions: $2,433 (reported on 7.1% of returns)
Here:
$2,433
State:
$6,591
Taxes paid: $3,150 (reported on 9.5% of returns)
74936:
$3,150
State:
$7,196
Earned income credit: $2,413 (reported on 35.7% of returns)
Here:
$2,413
State:
$2,354
(% of AGI for various income ranges: 10.4% for AGIs below $25k, 1.8% for AGIs $25k-50k)
Percentage of individuals using paid preparers for their 2012 taxes: 76.2%
Here:
76%
State:
56%
(% for various income ranges: 72.7% for AGIs below $25k, 81.8% for AGIs $25k-50k, 66.7% for AGIs $50k-75k, 100.0% for AGIs $75k-100k)
Averages for the 2004 tax year for zip code 74936, filed in 2005:
Average Adjusted Gross Income (AGI) in 2004: $24,808 (Individual Income Tax Returns)
Here:
$24,808
State:
$41,245
Salary/wage: $25,054 (reported on 87.1% of returns)
Here:
$25,054
State:
$35,318
(% of AGI for various income ranges: 117.1% for AGIs below $10k, 82.4% for AGIs $10k-25k, 92.4% for AGIs $25k-50k, 90.4% for AGIs $50k-75k, 66.0% for AGIs $75k-100k)
Taxable interest for individuals: $750 (reported on 20.6% of returns)
This zip code:
$750
Oklahoma:
$1,745
(% of AGI for various income ranges: 4.8% for AGIs below $10k, 1.6% for AGIs $10k-25k, 0.3% for AGIs $25k-50k, 0.1% for AGIs $50k-75k)
Taxable dividends: $100 (reported on 7.0% of returns)
Here:
$100
State:
$2,920
Profit/loss from business: +$4,500 (reported on 19.7% of returns)
Here:
+$4,500
State:
+$8,532
Total itemized deductions: $12,958 (26% of AGI, reported on 11.2% of returns)
Here:
$12,958
State:
$17,093
Here:
26.1% of AGI
State:
20.5% of AGI
Charity contributions deductions: $2,455 (5% of AGI, reported on 7.7% of returns)
Here:
$2,455
State:
$4,240
Here:
4.9% of AGI
State:
4.8% of AGI
Total tax: $2,434 (reported on 60.0% of returns)
74936:
$2,434
State:
$6,542
(% of AGI for various income ranges: 3.8% for AGIs below $10k, 3.3% for AGIs $10k-25k, 4.9% for AGIs $25k-50k, 8.1% for AGIs $50k-75k, 10.4% for AGIs $75k-100k)
Earned income credit: $1,776 (reported on 36.5% of returns)
Here:
$1,776
State:
$1,830
Percentage of individuals using paid preparers for their 2004 taxes: 77.0%
Here:
77%
State:
63%
(% for various income ranges: 72.6% for AGIs below $10k, 84.7% for AGIs $10k-25k, 77.9% for AGIs $25k-50k, 61.4% for AGIs $50k-75k, 84.6% for AGIs $75k-100k)
Household received Food Stamps/SNAP in the past 12 months: 105 Household did not receive Food Stamps/SNAP in the past 12 months: 427
Women who had a birth in the past 12 months: 19 (11 now married, 7 unmarried) Women who did not have a birth in the past 12 months: 290 (168 now married, 121 unmarried)
Housing units in zip code 74936 with a mortgage: 134 (1 second mortgage, 1 both second mortgage and home equity loan) Median monthly owner costs for units with a mortgage: $1,037 Median monthly owner costs for units without a mortgage: $333
Residents with income below the poverty level in 2022:
This zip code:
17.9%
Whole state:
15.7%
Residents with income below 50% of the poverty level in 2022:
This zip code:
10.7%
Whole state:
8.3%
Median number of rooms in houses and condos:
Here:
5.2
State:
6.1
Median number of rooms in apartments:
Here:
5.0
State:
4.5
Notable locations in this zip code not listed on our city pages
Size of family households: 129 2-persons, 106 3-persons, 88 4-persons, 25 5-persons, 12 6-persons, 4 7-or-more-persons
Size of nonfamily households: 149 1-person, 4 2-persons, 7 4-persons
231 married couples with children.
87 single-parent households (33 men, 54 women).
95.0% of residents of 74936 zip code speak English at home.
4.6% of residents speak Spanish at home (62% very well, 23% well, 15% not well).
0.4% of residents speak Asian or Pacific Island language at home (100% very well).
Foreign born population: 35 (2.3%) (0.0% of them are naturalized citizens)
:
2.3%
Whole state:
6.0%
97%Honduras
6%Sweden
3%United Kingdom, excluding England and Scotland
5%English
3%German
3%Irish
2%American
1%European
1%French
1%Scotch-Irish
Year of entry for the foreign-born population
162010 or later
332000 to 2009
01990 to 1999
6Before 1990
Facilities with environmental interests located in this zip code:
GANS ES (HIGHWAY 141 in GANS, OK)
(National Center for Education Statistics) - STATE ID-68-I004-105
GANS HS (HIGHWAY 141 in GANS, OK)
(National Center for Education Statistics) - STATE ID-68-I004-715
AMERICAN TEL & TEL CO LONG LINES (HWY 64 2M N H141 in GANS, OK) . Tribal Land
(Resource Conservation and Recovery Act (tracking hazardous waste))
Housing units lacking complete plumbing facilities: 6.0% Housing units lacking complete kitchen facilities: 4.8%
58.0%Electricity
25.7%Utility gas
9.8%Bottled, tank, or LP gas
6.7%Wood
Place of birth for U.S.-born residents:
This state: 610
Northeast: 2
Midwest: 107
South: 624
West: 128
60% of the 74936 zip code residents lived in the same house 5 years ago. Out of people who lived in different houses, 73% lived in this county. Out of people who lived in different counties, 50% lived in Oklahoma.
95% of the 74936 zip code residents lived in the same house 1 year ago. Out of people who lived in different houses, 80% moved from this county. Out of people who lived in different houses, 6% moved from different county within same state. Out of people who lived in different houses, 16% moved from different state.
Private vs. public school enrollment:
Students in private schools in grades 1 to 8 (elementary and middle school):
Here:
0.0%
Oklahoma:
11.7%
Students in private schools in grades 9 to 12 (high school): 12
Here:
11.4%
Oklahoma:
11.7%
Students in private undergraduate colleges: 2
Here:
7.1%
Oklahoma:
19.3%
Occupation by median earnings in the past 12 months ($)
118,476Health diagnosing and treating practitioners and other technical occupations
76,373Transportation occupations
66,783Building and grounds cleaning and maintenance occupations
53,368Management occupations
51,702Education, training, and library occupations
51,544Community and social service occupations
Top industries in this zip code by the number of employees in 2005:
Administrative and Support and Waste Management and Remediation Services: All Other Miscellaneous Waste Management Services (5-9 employees: 1 establishment)
Construction: Commercial and Institutional Building Construction (1-4: 1)
Other Services (except Public Administration): Religious Organizations (1-4: 1)
Health Care and Social Assistance: Child Day Care Services (1-4: 1)
Fatal accident statistics in 2014:
Fatal accident count: 1
Vehicles involved in fatal accidents: 1
Fatal accidents caused by drunken drivers: 0
Fatalities: 1
Persons involved in fatal accidents: 1
Pedestrians involved in fatal accidents: 0
Fatal accident statistics in 2013:
Fatal accident count: 1
Vehicles involved in fatal accidents: 1
Fatal accidents caused by drunken drivers: 0
Fatalities: 2
Persons involved in fatal accidents: 5
Pedestrians involved in fatal accidents: 0
Home Mortgage Disclosure Act Aggregated Statistics For Year 2009 (Based on 2 partial tracts)
A) FHA, FSA/RHS & VA Home Purchase Loans
B) Conventional Home Purchase Loans
C) Refinancings
D) Home Improvement Loans
F) Non-occupant Loans on < 5 Family Dwellings (A B C & D)
G) Loans On Manufactured Home Dwelling (A B C & D)
Number
Average Value
Number
Average Value
Number
Average Value
Number
Average Value
Number
Average Value
Number
Average Value
LOANS ORIGINATED
6
$86,533
12
$87,267
16
$115,100
5
$15,360
4
$42,000
6
$38,533
APPLICATIONS APPROVED, NOT ACCEPTED
0
$0
2
$54,800
0
$0
0
$0
0
$0
1
$31,200
APPLICATIONS DENIED
1
$54,400
6
$61,467
14
$93,943
4
$14,000
0
$0
6
$55,067
APPLICATIONS WITHDRAWN
0
$0
0
$0
3
$242,933
2
$16,000
0
$0
0
$0
FILES CLOSED FOR INCOMPLETENESS
2
$130,400
2
$30,400
2
$64,000
0
$0
0
$0
1
$22,400
Aggregated Statistics For Year 2008 (Based on 2 partial tracts)
A) FHA, FSA/RHS & VA Home Purchase Loans
B) Conventional Home Purchase Loans
C) Refinancings
D) Home Improvement Loans
F) Non-occupant Loans on < 5 Family Dwellings (A B C & D)
G) Loans On Manufactured Home Dwelling (A B C & D)
Number
Average Value
Number
Average Value
Number
Average Value
Number
Average Value
Number
Average Value
Number
Average Value
LOANS ORIGINATED
10
$101,440
16
$53,150
12
$114,533
6
$28,400
8
$48,700
6
$32,533
APPLICATIONS APPROVED, NOT ACCEPTED
1
$49,600
2
$39,200
0
$0
0
$0
0
$0
2
$29,200
APPLICATIONS DENIED
2
$192,000
9
$85,333
8
$63,600
2
$14,000
1
$30,400
8
$44,100
APPLICATIONS WITHDRAWN
0
$0
3
$129,333
3
$90,133
2
$56,400
0
$0
1
$54,400
FILES CLOSED FOR INCOMPLETENESS
0
$0
0
$0
0
$0
0
$0
0
$0
0
$0
Aggregated Statistics For Year 2007 (Based on 2 partial tracts)
A) FHA, FSA/RHS & VA Home Purchase Loans
B) Conventional Home Purchase Loans
C) Refinancings
D) Home Improvement Loans
F) Non-occupant Loans on < 5 Family Dwellings (A B C & D)
G) Loans On Manufactured Home Dwelling (A B C & D)
Number
Average Value
Number
Average Value
Number
Average Value
Number
Average Value
Number
Average Value
Number
Average Value
LOANS ORIGINATED
6
$80,400
10
$98,560
15
$74,667
10
$31,520
2
$42,400
5
$23,520
APPLICATIONS APPROVED, NOT ACCEPTED
0
$0
2
$59,200
2
$111,200
2
$59,600
2
$27,600
1
$25,600
APPLICATIONS DENIED
2
$61,600
14
$87,486
10
$88,960
3
$8,267
2
$14,000
2
$47,200
APPLICATIONS WITHDRAWN
2
$94,800
6
$75,333
5
$74,880
4
$42,600
0
$0
2
$26,400
FILES CLOSED FOR INCOMPLETENESS
0
$0
1
$79,200
1
$60,000
0
$0
0
$0
0
$0
Aggregated Statistics For Year 2006 (Based on 2 partial tracts)
A) FHA, FSA/RHS & VA Home Purchase Loans
B) Conventional Home Purchase Loans
C) Refinancings
D) Home Improvement Loans
F) Non-occupant Loans on < 5 Family Dwellings (A B C & D)
G) Loans On Manufactured Home Dwelling (A B C & D)
Number
Average Value
Number
Average Value
Number
Average Value
Number
Average Value
Number
Average Value
Number
Average Value
LOANS ORIGINATED
4
$129,600
17
$80,847
23
$81,496
12
$23,267
3
$27,733
5
$38,400
APPLICATIONS APPROVED, NOT ACCEPTED
0
$0
0
$0
1
$43,200
0
$0
0
$0
0
$0
APPLICATIONS DENIED
0
$0
5
$33,760
10
$100,400
6
$10,133
1
$20,000
2
$25,600
APPLICATIONS WITHDRAWN
0
$0
3
$61,067
7
$78,857
1
$8,000
0
$0
1
$33,600
FILES CLOSED FOR INCOMPLETENESS
0
$0
1
$26,400
1
$24,800
0
$0
0
$0
0
$0
Aggregated Statistics For Year 2005 (Based on 2 partial tracts)
A) FHA, FSA/RHS & VA Home Purchase Loans
B) Conventional Home Purchase Loans
C) Refinancings
D) Home Improvement Loans
F) Non-occupant Loans on < 5 Family Dwellings (A B C & D)
G) Loans On Manufactured Home Dwelling (A B C & D)
Number
Average Value
Number
Average Value
Number
Average Value
Number
Average Value
Number
Average Value
Number
Average Value
LOANS ORIGINATED
5
$85,920
12
$47,733
18
$50,711
10
$20,560
7
$33,714
6
$36,800
APPLICATIONS APPROVED, NOT ACCEPTED
0
$0
2
$72,800
2
$53,200
0
$0
0
$0
2
$72,800
APPLICATIONS DENIED
0
$0
9
$39,111
6
$57,733
6
$26,933
2
$39,600
6
$42,133
APPLICATIONS WITHDRAWN
0
$0
4
$31,000
8
$96,700
0
$0
0
$0
2
$44,000
FILES CLOSED FOR INCOMPLETENESS
1
$60,800
0
$0
0
$0
0
$0
0
$0
0
$0
Aggregated Statistics For Year 2004 (Based on 2 partial tracts)
A) FHA, FSA/RHS & VA Home Purchase Loans
B) Conventional Home Purchase Loans
C) Refinancings
D) Home Improvement Loans
F) Non-occupant Loans on < 5 Family Dwellings (A B C & D)
G) Loans On Manufactured Home Dwelling (A B C & D)
Number
Average Value
Number
Average Value
Number
Average Value
Number
Average Value
Number
Average Value
Number
Average Value
LOANS ORIGINATED
9
$77,600
17
$47,106
28
$66,514
11
$28,218
7
$38,743
10
$27,120
APPLICATIONS APPROVED, NOT ACCEPTED
0
$0
2
$49,600
0
$0
0
$0
0
$0
1
$32,000
APPLICATIONS DENIED
1
$106,400
10
$36,000
10
$53,200
6
$28,267
1
$2,400
8
$34,000
APPLICATIONS WITHDRAWN
0
$0
1
$72,000
6
$82,400
0
$0
0
$0
1
$48,800
FILES CLOSED FOR INCOMPLETENESS
0
$0
0
$0
0
$0
0
$0
0
$0
0
$0
Aggregated Statistics For Year 2003 (Based on 2 partial tracts)
A) FHA, FSA/RHS & VA Home Purchase Loans
B) Conventional Home Purchase Loans
C) Refinancings
D) Home Improvement Loans
F) Non-occupant Loans on < 5 Family Dwellings (A B C & D)
Number
Average Value
Number
Average Value
Number
Average Value
Number
Average Value
Number
Average Value
LOANS ORIGINATED
5
$72,800
15
$70,293
49
$68,588
6
$19,067
5
$41,600
APPLICATIONS APPROVED, NOT ACCEPTED
0
$0
0
$0
2
$67,200
0
$0
0
$0
APPLICATIONS DENIED
1
$60,000
6
$47,600
11
$83,491
1
$44,000
0
$0
APPLICATIONS WITHDRAWN
1
$49,600
0
$0
7
$71,086
1
$12,800
0
$0
FILES CLOSED FOR INCOMPLETENESS
1
$32,000
0
$0
0
$0
0
$0
0
$0
Aggregated Statistics For Year 2002 (Based on 2 partial tracts)
A) FHA, FSA/RHS & VA Home Purchase Loans
B) Conventional Home Purchase Loans
C) Refinancings
D) Home Improvement Loans
F) Non-occupant Loans on < 5 Family Dwellings (A B C & D)
Number
Average Value
Number
Average Value
Number
Average Value
Number
Average Value
Number
Average Value
LOANS ORIGINATED
6
$60,267
14
$40,171
43
$62,251
12
$21,533
5
$23,040
APPLICATIONS APPROVED, NOT ACCEPTED
0
$0
4
$48,200
10
$61,120
0
$0
0
$0
APPLICATIONS DENIED
2
$57,200
10
$38,000
11
$45,382
6
$23,733
0
$0
APPLICATIONS WITHDRAWN
1
$51,200
1
$80,000
6
$40,267
2
$33,600
0
$0
FILES CLOSED FOR INCOMPLETENESS
0
$0
0
$0
0
$0
0
$0
0
$0
Aggregated Statistics For Year 2001 (Based on 2 partial tracts)
A) FHA, FSA/RHS & VA Home Purchase Loans
B) Conventional Home Purchase Loans
C) Refinancings
D) Home Improvement Loans
F) Non-occupant Loans on < 5 Family Dwellings (A B C & D)
Number
Average Value
Number
Average Value
Number
Average Value
Number
Average Value
Number
Average Value
LOANS ORIGINATED
5
$58,080
21
$41,029
29
$64,331
10
$16,640
2
$35,600
APPLICATIONS APPROVED, NOT ACCEPTED
0
$0
7
$43,314
4
$70,200
1
$8,000
0
$0
APPLICATIONS DENIED
2
$40,400
18
$44,622
25
$43,424
4
$17,000
2
$45,600
APPLICATIONS WITHDRAWN
1
$55,200
2
$44,000
8
$67,000
2
$7,600
0
$0
FILES CLOSED FOR INCOMPLETENESS
0
$0
0
$0
1
$52,000
0
$0
0
$0
Aggregated Statistics For Year 2000 (Based on 2 partial tracts)
A) FHA, FSA/RHS & VA Home Purchase Loans
B) Conventional Home Purchase Loans
C) Refinancings
D) Home Improvement Loans
F) Non-occupant Loans on < 5 Family Dwellings (A B C & D)
Number
Average Value
Number
Average Value
Number
Average Value
Number
Average Value
Number
Average Value
LOANS ORIGINATED
9
$59,378
42
$46,343
32
$50,300
6
$31,600
6
$65,467
APPLICATIONS APPROVED, NOT ACCEPTED
2
$36,800
13
$42,646
7
$46,857
1
$29,600
1
$44,000
APPLICATIONS DENIED
6
$34,667
35
$41,280
26
$66,554
9
$18,222
4
$32,800
APPLICATIONS WITHDRAWN
1
$39,200
6
$49,733
9
$38,400
2
$12,800
0
$0
FILES CLOSED FOR INCOMPLETENESS
1
$32,000
1
$38,400
2
$110,400
0
$0
0
$0
Aggregated Statistics For Year 1999 (Based on 1 partial tract)
A) FHA, FSA/RHS & VA Home Purchase Loans
B) Conventional Home Purchase Loans
C) Refinancings
D) Home Improvement Loans
F) Non-occupant Loans on < 5 Family Dwellings (A B C & D)

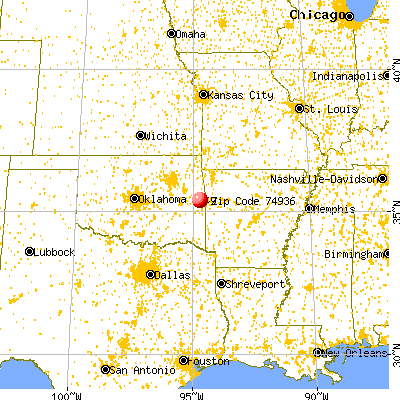


 Nearest zip codes: 74955, 74959, 74948, 74941, 74930, 74951.


