Estimated zip code population in 2022: 5,384 Zip code population in 2010: 5,959 Zip code population in 2000: 5,296
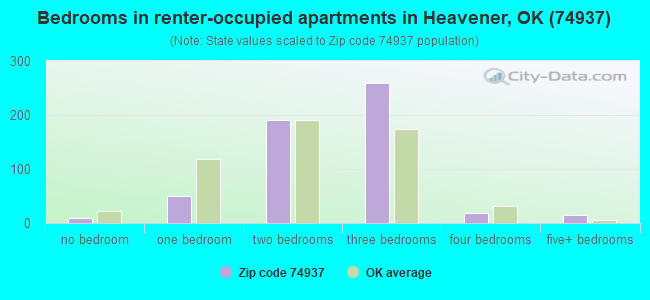
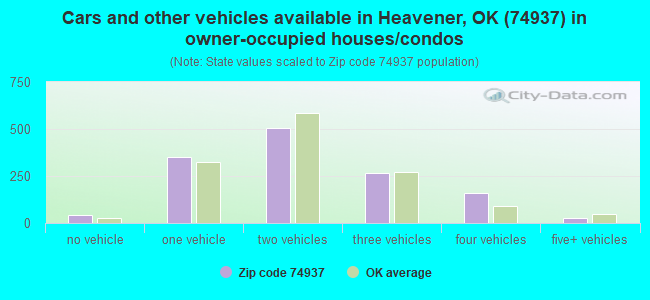
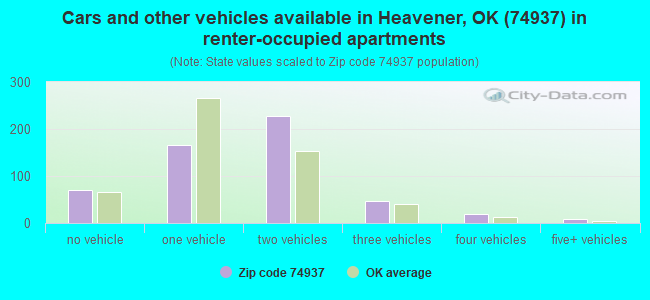
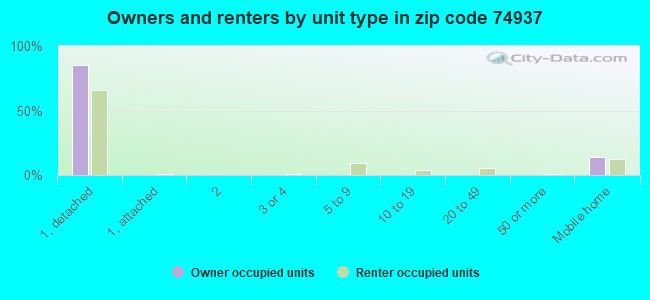
Houses and condos: 2,412 Renter-occupied apartments: 545
% of renters here:
29%
State:
35%
March 2022 cost of living index in zip code 74937: 78.1 (low, U.S. average is 100)
Land area: 207.0 sq. mi. Water area: 1.9 sq. mi.
Population density: 26 people per square mile
(very low).
OSM Map
General Map
Google Map
MSN Map
OSM Map
General Map
Google Map
MSN Map
OSM Map
General Map
Google Map
MSN Map
OSM Map
General Map
Google Map
MSN Map
Please wait while loading the map...
Real estate property taxes paid for housing units in 2022:
This zip code:
0.6% ($585)
Oklahoma:
0.8% ($1,501)
Median real estate property taxes paid for housing units with mortgages in 2022: $879 (0.6%) Median real estate property taxes paid for housing units with no mortgage in 2022: $432 (0.6%)
Estimated median house/condo value in 2022: $91,859
74937:
$91,859
Oklahoma:
$191,700
According to our research of Oklahoma and other state lists, there were 11 registered sex offenders living in 74937 zip code as of May 28, 2024. The ratio of all residents to sex offenders in zip code 74937 is 530 to 1. The ratio of registered sex offenders to all residents in this zip code is near the state average.
Median resident age:
This zip code:
37.6 years
Oklahoma median age:
37.1 years
Average household size:
This zip code:
2.8 people
Oklahoma:
2.5 people
Averages for the 2020 tax year for zip code 74937, filed in 2021:
Average Adjusted Gross Income (AGI) in 2020: $39,183 (Individual Income Tax Returns)
Here:
$39,183
State:
$63,060
Salary/wage: $36,701 (reported on 80.8% of returns)
Here:
$36,701
State:
$52,427
(% of AGI for various income ranges: 1213.8% for AGIs below $25k, 3606.2% for AGIs $25k-50k, 6235.6% for AGIs $50k-75k, 9468.8% for AGIs $75k-100k, 17556.2% for AGIs $100k-200k)
Taxable interest for individuals: $684 (reported on 16.2% of returns)
This zip code:
$684
Oklahoma:
$1,603
(% of AGI for various income ranges: 5.3% for AGIs below $25k, 15.8% for AGIs $25k-50k, 29.4% for AGIs $50k-75k, 6.2% for AGIs $75k-100k, 60.0% for AGIs $100k-200k)
Ordinary dividends: $2,313 (reported on 7.6% of returns)
Here:
$2,313
State:
$7,001
(% of AGI for various income ranges: 9.5% for AGIs below $25k, 21.7% for AGIs $25k-50k, 73.8% for AGIs $75k-100k, 137.5% for AGIs $100k-200k)
Net capital gain/loss in AGI: +$10,993 (reported on 7.6% of returns)
Here:
+$10,993
State:
+$19,855
(% of AGI for various income ranges: 5.0% for AGIs below $25k, 3.4% for AGIs $25k-50k, 18.1% for AGIs $50k-75k, 680.0% for AGIs $75k-100k, 1281.2% for AGIs $100k-200k)
Profit/loss from business: +$8,303 (reported on 18.2% of returns)
Here:
+$8,303
State:
+$9,904
(% of AGI for various income ranges: 218.8% for AGIs below $25k, 174.5% for AGIs $25k-50k, 128.1% for AGIs $50k-75k, 268.8% for AGIs $75k-100k, 250.0% for AGIs $100k-200k)
Taxable individual retirement arrangement distribution: $10,457 (reported on 3.5% of returns)
74937:
$10,457
Oklahoma:
$20,476
(% of AGI for various income ranges: 59.2% for AGIs below $25k, 213.1% for AGIs $50k-75k)
Total itemized deductions: $27,000 (reported on 2.0% of returns)
Here:
$27,000
State:
$39,736
(% of AGI for various income ranges: 675.0% for AGIs $50k-75k)
Charity contributions: $11,050 (reported on 1.0% of returns)
Here:
$11,050
State:
$17,288
(% of AGI for various income ranges: 41.7% for AGIs $25k-50k)
Taxes paid: $4,250 (reported on 2.0% of returns)
74937:
$4,250
State:
$7,046
(% of AGI for various income ranges: 106.2% for AGIs $50k-75k)
Earned income credit: $2,785 (reported on 30.8% of returns)
Here:
$2,785
State:
$2,435
(% of AGI for various income ranges: 158.9% for AGIs below $25k, 122.6% for AGIs $25k-50k)
Percentage of individuals using paid preparers for their 2020 taxes: 96.0%
Here:
96%
State:
94%
(% for various income ranges: 95.4% for AGIs below $25k, 96.9% for AGIs $25k-50k, 95.2% for AGIs $50k-75k, 100.0% for AGIs $75k-100k, 92.9% for AGIs $100k-200k)
Averages for the 2012 tax year for zip code 74937, filed in 2013:
Average Adjusted Gross Income (AGI) in 2012: $35,781 (Individual Income Tax Returns)
Here:
$35,781
State:
$58,581
Salary/wage: $33,015 (reported on 84.1% of returns)
Here:
$33,015
State:
$45,973
(% of AGI for various income ranges: 78.2% for AGIs below $25k, 80.2% for AGIs $25k-50k, 79.0% for AGIs $50k-75k, 81.3% for AGIs $75k-100k, 70.6% for AGIs $100k-200k)
Taxable interest for individuals: $622 (reported on 18.5% of returns)
This zip code:
$622
Oklahoma:
$1,625
(% of AGI for various income ranges: 0.6% for AGIs below $25k, 0.3% for AGIs $25k-50k, 0.3% for AGIs $50k-75k, 0.1% for AGIs $75k-100k, 0.2% for AGIs $100k-200k)
Ordinary dividends: $2,060 (reported on 7.7% of returns)
Here:
$2,060
State:
$6,374
(% of AGI for various income ranges: 0.4% for AGIs below $25k, 0.6% for AGIs $25k-50k, 0.3% for AGIs $50k-75k, 0.5% for AGIs $75k-100k, 0.4% for AGIs $100k-200k)
Net capital gain/loss in AGI: +$2,162 (reported on 6.7% of returns)
Here:
+$2,162
State:
+$24,023
(% of AGI for various income ranges: 0.3% for AGIs below $25k, 0.6% for AGIs $25k-50k, 0.3% for AGIs $50k-75k, 1.1% for AGIs $75k-100k)
Profit/loss from business: +$7,280 (reported on 15.4% of returns)
Here:
+$7,280
State:
+$11,913
(% of AGI for various income ranges: 9.9% for AGIs below $25k, 3.2% for AGIs $25k-50k, 1.6% for AGIs $50k-75k, 0.9% for AGIs $75k-100k)
Taxable individual retirement arrangement distribution: $9,712 (reported on 4.1% of returns)
74937:
$9,712
Oklahoma:
$15,242
(% of AGI for various income ranges: 0.7% for AGIs below $25k, 1.6% for AGIs $25k-50k, 4.2% for AGIs $75k-100k)
Total itemized deductions: $21,411 (26% of AGI, reported on 17.9% of returns)
Here:
$21,411
State:
$24,882
Here:
25.6% of AGI
State:
18.8% of AGI
(% of AGI for various income ranges: 2.9% for AGIs below $25k, 6.9% for AGIs $25k-50k, 15.1% for AGIs $50k-75k, 14.7% for AGIs $75k-100k, 15.0% for AGIs $100k-200k)
Charity contributions: $5,395 (reported on 10.8% of returns)
Here:
$5,395
State:
$6,591
(% of AGI for various income ranges: 1.5% for AGIs $25k-50k, 1.9% for AGIs $50k-75k, 2.9% for AGIs $75k-100k, 2.1% for AGIs $100k-200k)
Taxes paid: $3,709 (reported on 17.9% of returns)
74937:
$3,709
State:
$7,196
(% of AGI for various income ranges: 0.2% for AGIs below $25k, 0.8% for AGIs $25k-50k, 2.3% for AGIs $50k-75k, 2.6% for AGIs $75k-100k, 3.6% for AGIs $100k-200k)
Earned income credit: $2,563 (reported on 32.3% of returns)
Here:
$2,563
State:
$2,354
(% of AGI for various income ranges: 9.3% for AGIs below $25k, 2.3% for AGIs $25k-50k)
Percentage of individuals using paid preparers for their 2012 taxes: 82.6%
Here:
83%
State:
56%
(% for various income ranges: 79.6% for AGIs below $25k, 83.7% for AGIs $25k-50k, 87.0% for AGIs $50k-75k, 90.9% for AGIs $75k-100k, 88.9% for AGIs $100k-200k)
Averages for the 2004 tax year for zip code 74937, filed in 2005:
Average Adjusted Gross Income (AGI) in 2004: $26,818 (Individual Income Tax Returns)
Here:
$26,818
State:
$41,245
Salary/wage: $25,802 (reported on 82.2% of returns)
Here:
$25,802
State:
$35,318
(% of AGI for various income ranges: 107.0% for AGIs below $10k, 77.4% for AGIs $10k-25k, 83.9% for AGIs $25k-50k, 82.4% for AGIs $50k-75k, 77.8% for AGIs $75k-100k, 41.5% for AGIs over 100k)
Taxable interest for individuals: $1,290 (reported on 27.5% of returns)
This zip code:
$1,290
Oklahoma:
$1,745
(% of AGI for various income ranges: 6.4% for AGIs below $10k, 1.6% for AGIs $10k-25k, 1.1% for AGIs $25k-50k, 0.7% for AGIs $50k-75k, 0.7% for AGIs $75k-100k, 1.8% for AGIs over 100k)
Taxable dividends: $1,130 (reported on 9.2% of returns)
Here:
$1,130
State:
$2,920
(% of AGI for various income ranges: 0.9% for AGIs below $10k, 0.1% for AGIs $10k-25k, 0.6% for AGIs $25k-50k, 0.3% for AGIs $50k-75k, 0.3% for AGIs $75k-100k, 0.2% for AGIs over 100k)
Net capital gain/loss: +$2,134 (reported on 10.2% of returns)
Here:
+$2,134
State:
+$10,653
(% of AGI for various income ranges: -0.7% for AGIs below $10k, 0.1% for AGIs $10k-25k, 0.5% for AGIs $25k-50k, 1.5% for AGIs $50k-75k, 1.6% for AGIs $75k-100k, 1.4% for AGIs over 100k)
Profit/loss from business: +$7,329 (reported on 17.2% of returns)
Here:
+$7,329
State:
+$8,532
(% of AGI for various income ranges: 12.8% for AGIs below $10k, 7.6% for AGIs $10k-25k, 2.8% for AGIs $25k-50k, 0.5% for AGIs $50k-75k, 2.1% for AGIs $75k-100k, 17.7% for AGIs over 100k)
IRA payment deduction: $3,360 (reported on 1.4% of returns)
74937:
$3,360
Oklahoma:
$3,127
Total itemized deductions: $14,964 (27% of AGI, reported on 20.6% of returns)
Here:
$14,964
State:
$17,093
Here:
26.8% of AGI
State:
20.5% of AGI
(% of AGI for various income ranges: 4.0% for AGIs $10k-25k, 10.2% for AGIs $25k-50k, 16.6% for AGIs $50k-75k, 17.8% for AGIs $75k-100k, 18.9% for AGIs over 100k)
Charity contributions deductions: $3,505 (6% of AGI, reported on 16.8% of returns)
Here:
$3,505
State:
$4,240
Here:
6.1% of AGI
State:
4.8% of AGI
(% of AGI for various income ranges: 0.9% for AGIs $10k-25k, 1.7% for AGIs $25k-50k, 3.8% for AGIs $50k-75k, 3.2% for AGIs $75k-100k, 2.9% for AGIs over 100k)
Total tax: $2,804 (reported on 60.6% of returns)
74937:
$2,804
State:
$6,542
(% of AGI for various income ranges: 3.8% for AGIs below $10k, 3.2% for AGIs $10k-25k, 4.6% for AGIs $25k-50k, 7.4% for AGIs $50k-75k, 9.3% for AGIs $75k-100k, 16.3% for AGIs over 100k)
Earned income credit: $2,073 (reported on 30.4% of returns)
Here:
$2,073
State:
$1,830
Percentage of individuals using paid preparers for their 2004 taxes: 83.4%
Here:
83%
State:
63%
(% for various income ranges: 79.6% for AGIs below $10k, 85.7% for AGIs $10k-25k, 82.3% for AGIs $25k-50k, 85.8% for AGIs $50k-75k, 83.3% for AGIs $75k-100k, 100.0% for AGIs over 100k)
Likely homosexual households (counted as self-reported same-sex unmarried-partner households)
Lesbian couples: 0.0% of all households
Gay men: 0.4% of all households
Household received Food Stamps/SNAP in the past 12 months: 373 Household did not receive Food Stamps/SNAP in the past 12 months: 1,538
Women who had a birth in the past 12 months: 46 (36 now married, 9 unmarried) Women who did not have a birth in the past 12 months: 1,093 (510 now married, 582 unmarried)
Housing units in zip code 74937 with a mortgage: 567 (6 second mortgage, 3 both second mortgage and home equity loan) Houses without a mortgage: 14
Median monthly owner costs for units with a mortgage: $979 Median monthly owner costs for units without a mortgage: $344
Residents with income below the poverty level in 2022:
This zip code:
27.6%
Whole state:
15.7%
Residents with income below 50% of the poverty level in 2022:
This zip code:
17.0%
Whole state:
8.3%
Median number of rooms in houses and condos:
Here:
5.8
State:
6.1
Median number of rooms in apartments:
Here:
5.3
State:
4.5
Notable locations in this zip code not listed on our city pages
Notable locations in zip code 74937: Forrester (A), Heavener (B), Vertao Electronic Site (C), Kerr Natural Center (D), Settlement (E), Emergency Medical Services of Le Flore County Station 8 Heavener (F), Haw Creek Rural Fire Department (G), Heavener Fire Department West Side Station (H), Heavener Fire Department Downtown Station (I), Reichert Community Fire Association (J). Display/hide their locations on the map
Churches in zip code 74937 include: Trinity Baptist Church (A), Heavener Church of Nazarene (B), Free Will Baptist Church (C), First United Methodist Church (D), First Baptist Church (E), Church of Christ (F), Assembly of God Church (G), Big Creek Church (H), Jesus Name Church (I). Display/hide their locations on the map
Cemeteries: Loving Cemetery (1), Naylor Cemetery (2), McClure Cemetery (3), Page Cemetery (4), Reichert Cemetery (5), Heavener Memorial Park (6), Hontubby Cemetery (7). Display/hide their locations on the map
Streams, rivers, and creeks: Hontubby Creek (A), Line Creek (B), Crooked Branch (C), Merle Branch (D), Anderson Branch (E), Britton Branch (F), Black Fork (G), Cedar Creek (H), Conser Creek (I). Display/hide their locations on the map
844 married couples with children.
425 single-parent households (171 men, 254 women).
83.3% of residents of 74937 zip code speak English at home.
16.7% of residents speak Spanish at home (42% very well, 24% well, 23% not well, 11% not at all).
0.1% of residents speak other Indo-European language at home (100% very well).
0.1% of residents speak Asian or Pacific Island language at home (100% not well).
0.2% of residents speak other language at home (100% not well).
Foreign born population: 453 (8.4%) (11.0% of them are naturalized citizens)
This zip code:
8.4%
Whole state:
6.0%
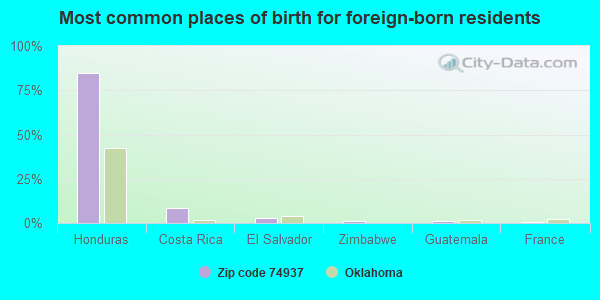
85%Honduras
8%Costa Rica
3%El Salvador
1%Zimbabwe
1%Guatemala
0%France
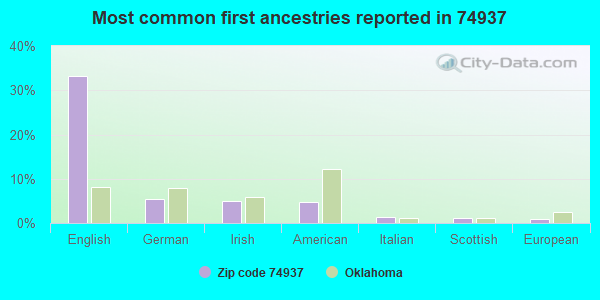
33%English
5%German
5%Irish
5%American
1%Italian
1%Scottish
1%European
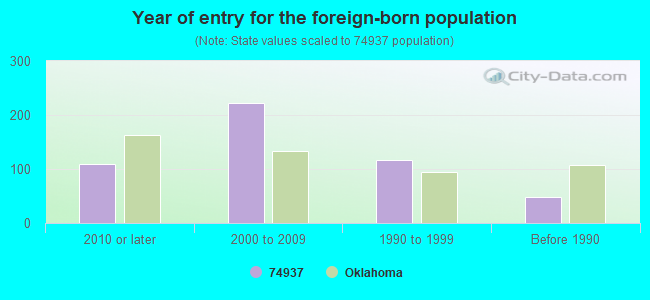
Year of entry for the foreign-born population
1102010 or later
2232000 to 2009
1171990 to 1999
49Before 1990
Facilities with environmental interests located in this zip code:
CITY OF HEAVENER (103 EAST AVENUE B in HEAVENER, OK)
National Pollutant Discharge Elimination System NON-MAJOR (Tracking pollutant discharge elimination systems) - permit Business SIC classification: WATER SUPPLY Alternative names: HEAVENER UTILITY AUTHORITY
FARRELL COOPER MINI/HEAVENER EAST 2 (SHA (9 MI E ON HWY 128 in HEAVENER, OK)
AIR MINOR (AIRS/AFS)
FARRELL COOPER,-HEAVENER E #3 (2 MLS SE OF HEAVENER VIA HY128 in HEAVENER, OK)
National Pollutant Discharge Elimination System NON-MAJOR (Tracking pollutant discharge elimination systems) - permit Business SIC classification: BITUMINOUS COAL AND LIGNITE SURFACE MINING Alternative names: FARRELL COOPER MINING CO., FARRELL-COOPER MINING - HEAVEN
FARRELL-COOPER -HEAVENER E NO2 (2 MLS SE HEAVENER,VIA HWY 128 in HEAVENER, OK)
National Pollutant Discharge Elimination System NON-MAJOR (Tracking pollutant discharge elimination systems) - permit Business SIC classification: BITUMINOUS COAL AND LIGNITE SURFACE MINING Alternative names: FARRELL-COOPER MINING CO. INC-
FARRELL-COOPER,HEAVENER E MINE (2 MLS SE HEAVENER VIA HWY 128 in HEAVENER, OK)
National Pollutant Discharge Elimination System NON-MAJOR (Tracking pollutant discharge elimination systems) - permit Business SIC classification: BITUMINOUS COAL AND LIGNITE SURFACE MINING Alternative names: FARRELL-COOPER MINING CO., FARRELL-COOPER MINING CO.-HEAV
FARRELL-COOPER,PINE MOUNTAIN (0.5 MILS SW OF HEAVENER in HEAVENER, OK)
National Pollutant Discharge Elimination System NON-MAJOR (Tracking pollutant discharge elimination systems) - permit Business SIC classification: BITUMINOUS COAL AND LIGNITE SURFACE MINING Alternative names: FARRELL-COOPER MINING CO., FARRELL-COOPER MINING CO.-PINE
Housing units lacking complete plumbing facilities: 8.1% Housing units lacking complete kitchen facilities: 6.6%
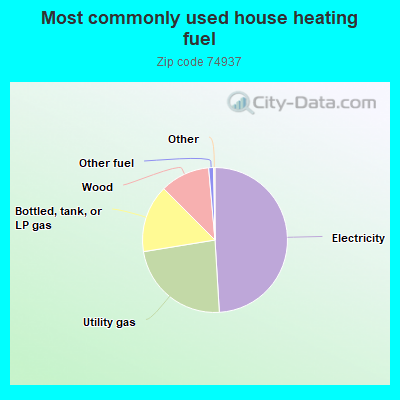
49.1%Electricity
23.4%Utility gas
15.1%Bottled, tank, or LP gas
11.1%Wood
1.1%Other fuel
Population in 1990: 5,628.
Place of birth for U.S.-born residents:
This state: 2,565
Northeast: 96
Midwest: 306
South: 1,242
West: 694
56% of the 74937 zip code residents lived in the same house 5 years ago. Out of people who lived in different houses, 67% lived in this county. Out of people who lived in different counties, 50% lived in Oklahoma.
94% of the 74937 zip code residents lived in the same house 1 year ago. Out of people who lived in different houses, 52% moved from this county. Out of people who lived in different houses, 13% moved from different county within same state. Out of people who lived in different houses, 42% moved from different state.
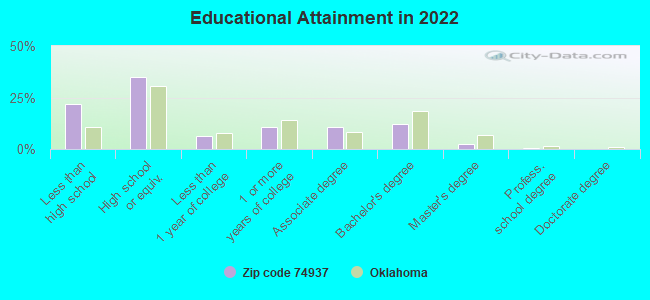
Private vs. public school enrollment:
Students in private schools in grades 1 to 8 (elementary and middle school): 39
Here:
7.0%
Oklahoma:
11.7%
Students in private schools in grades 9 to 12 (high school): 30
Here:
8.4%
Oklahoma:
11.7%
Students in private undergraduate colleges: 13
Here:
12.4%
Oklahoma:
19.3%
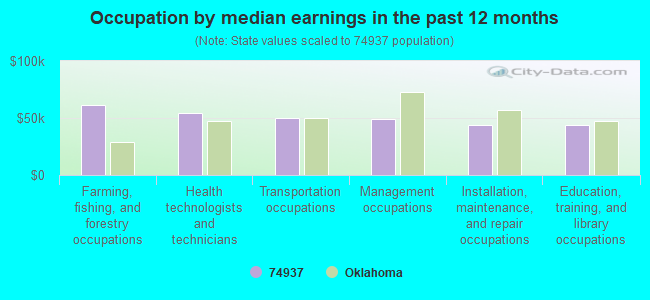
Occupation by median earnings in the past 12 months ($)
61,757Farming, fishing, and forestry occupations
54,332Health technologists and technicians
49,898Transportation occupations
49,459Management occupations
43,882Installation, maintenance, and repair occupations
43,564Education, training, and library occupations
Companies with federal contracts located in this zip code:
RON CALHOUN (23141 INDEPENDENCE ROAD in HEAVENER, OK; small business) : $8,960 in 4 contractsin 2004
$4,480 with U.S. Army Corps of Engineers - civil program financing only for Other Administrative Support Services. Signed on 2004-03-09. Completion date: 2004-02-19.
$4,480 with Army for Other Administrative Support Services. Signed on 2004-03-09. Completion date: 2004-02-19.
$0 with U.S. Army Corps of Engineers - civil program financing only for Other Administrative Support Services. Signed on 2004-03-09. Completion date: 2004-02-19.
$0 with Army for Other Administrative Support Services. Signed on 2004-03-09. Completion date: 2004-02-19.
Top industries in this zip code by the number of employees in 2005:
Health Care and Social Assistance: Nursing Care Facilities (20-49 employees: 2 establishments, 1-4 employees: 1 establishment)
Accommodation and Food Services: Limited-Service Restaurants (20-49: 1, 10-19: 1)
Finance and Insurance: Commercial Banking (20-49: 1, 5-9: 1)
Mining: Bituminous Coal and Lignite Surface Mining (20-49: 1)
Construction: Water and Sewer Line and Related Structures Construction (20-49: 1)
Other Services (except Public Administration): Religious Organizations (10-19: 1, 1-4: 3)
Health Care and Social Assistance: Offices of Physicians (except Mental Health Specialists) (10-19: 1, 1-4: 1)
Accommodation and Food Services: Full-Service Restaurants (5-9: 1, 1-4: 1)
People in group quarters in 2010:
65 people in nursing facilities/skilled-nursing facilities
People in group quarters in 2000:
77 people in nursing homes
Fatal accident statistics in 2013:
Fatal accident count: 2
Vehicles involved in fatal accidents: 3
Fatal accidents caused by drunken drivers: 1
Fatalities: 2
Persons involved in fatal accidents: 7
Pedestrians involved in fatal accidents: 0
Fatal accident statistics in 2012:
Fatal accident count: 1
Vehicles involved in fatal accidents: 1
Fatal accidents caused by drunken drivers: 1
Fatalities: 1
Persons involved in fatal accidents: 1
Pedestrians involved in fatal accidents: 0
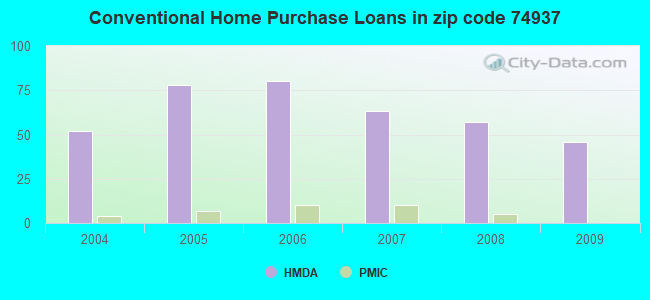
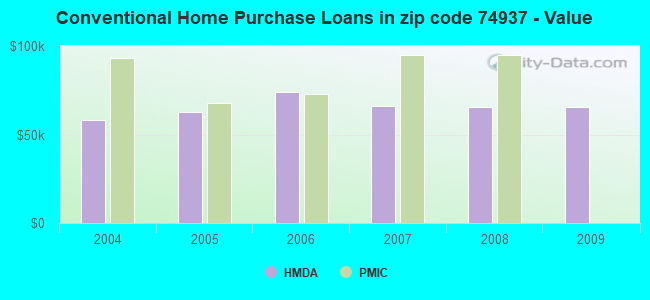
Home Mortgage Disclosure Act Aggregated Statistics For Year 2009 (Based on 8 partial tracts)
A) FHA, FSA/RHS & VA Home Purchase Loans
B) Conventional Home Purchase Loans
C) Refinancings
D) Home Improvement Loans
F) Non-occupant Loans on < 5 Family Dwellings (A B C & D)
G) Loans On Manufactured Home Dwelling (A B C & D)
Number
Average Value
Number
Average Value
Number
Average Value
Number
Average Value
Number
Average Value
Number
Average Value
LOANS ORIGINATED
19
$114,958
46
$65,457
92
$84,679
18
$27,683
22
$47,760
14
$43,577
APPLICATIONS APPROVED, NOT ACCEPTED
0
$0
10
$86,004
5
$64,574
2
$18,450
0
$0
5
$46,542
APPLICATIONS DENIED
5
$113,384
15
$55,156
41
$108,523
12
$41,679
4
$122,212
15
$56,855
APPLICATIONS WITHDRAWN
0
$0
3
$93,657
25
$94,688
4
$33,305
2
$55,850
1
$30,780
FILES CLOSED FOR INCOMPLETENESS
4
$83,018
1
$77,940
4
$134,062
1
$10,250
0
$0
0
$0
Aggregated Statistics For Year 2008 (Based on 8 partial tracts)
A) FHA, FSA/RHS & VA Home Purchase Loans
B) Conventional Home Purchase Loans
C) Refinancings
D) Home Improvement Loans
F) Non-occupant Loans on < 5 Family Dwellings (A B C & D)
G) Loans On Manufactured Home Dwelling (A B C & D)
Number
Average Value
Number
Average Value
Number
Average Value
Number
Average Value
Number
Average Value
Number
Average Value
LOANS ORIGINATED
27
$85,755
57
$65,268
110
$62,078
24
$25,498
25
$38,710
31
$37,926
APPLICATIONS APPROVED, NOT ACCEPTED
3
$51,580
11
$46,886
6
$127,493
1
$46,170
0
$0
10
$46,950
APPLICATIONS DENIED
6
$85,772
35
$59,693
41
$105,074
12
$45,278
3
$68,007
18
$58,324
APPLICATIONS WITHDRAWN
2
$69,205
10
$91,927
16
$119,556
3
$46,800
0
$0
3
$48,883
FILES CLOSED FOR INCOMPLETENESS
1
$107,600
4
$66,892
3
$96,060
0
$0
0
$0
0
$0
Aggregated Statistics For Year 2007 (Based on 8 partial tracts)
A) FHA, FSA/RHS & VA Home Purchase Loans
B) Conventional Home Purchase Loans
C) Refinancings
D) Home Improvement Loans
F) Non-occupant Loans on < 5 Family Dwellings (A B C & D)
G) Loans On Manufactured Home Dwelling (A B C & D)
Number
Average Value
Number
Average Value
Number
Average Value
Number
Average Value
Number
Average Value
Number
Average Value
LOANS ORIGINATED
4
$92,548
63
$66,065
103
$67,804
18
$25,757
27
$41,434
26
$36,987
APPLICATIONS APPROVED, NOT ACCEPTED
0
$0
16
$47,371
11
$104,960
1
$7,200
1
$57,520
12
$48,188
APPLICATIONS DENIED
1
$96,440
45
$55,618
58
$81,434
24
$25,835
7
$32,243
24
$45,109
APPLICATIONS WITHDRAWN
1
$152,810
15
$60,327
26
$63,918
2
$97,895
4
$67,130
4
$90,698
FILES CLOSED FOR INCOMPLETENESS
0
$0
0
$0
9
$95,902
0
$0
0
$0
0
$0
Aggregated Statistics For Year 2006 (Based on 8 partial tracts)
A) FHA, FSA/RHS & VA Home Purchase Loans
B) Conventional Home Purchase Loans
C) Refinancings
D) Home Improvement Loans
E) Loans on Dwellings For 5+ Families
F) Non-occupant Loans on < 5 Family Dwellings (A B C & D)
G) Loans On Manufactured Home Dwelling (A B C & D)
Number
Average Value
Number
Average Value
Number
Average Value
Number
Average Value
Number
Average Value
Number
Average Value
Number
Average Value
LOANS ORIGINATED
9
$65,600
80
$74,102
123
$71,292
30
$24,775
1
$5,120
32
$40,622
27
$39,295
APPLICATIONS APPROVED, NOT ACCEPTED
1
$29,750
27
$66,771
15
$108,714
2
$27,680
0
$0
0
$0
19
$54,541
APPLICATIONS DENIED
3
$109,687
62
$62,523
83
$84,467
21
$20,654
0
$0
8
$54,074
36
$40,976
APPLICATIONS WITHDRAWN
0
$0
9
$65,726
43
$97,307
5
$32,810
0
$0
0
$0
1
$20,500
FILES CLOSED FOR INCOMPLETENESS
0
$0
0
$0
6
$134,460
0
$0
0
$0
0
$0
0
$0
Aggregated Statistics For Year 2005 (Based on 8 partial tracts)
A) FHA, FSA/RHS & VA Home Purchase Loans
B) Conventional Home Purchase Loans
C) Refinancings
D) Home Improvement Loans
F) Non-occupant Loans on < 5 Family Dwellings (A B C & D)
G) Loans On Manufactured Home Dwelling (A B C & D)
Number
Average Value
Number
Average Value
Number
Average Value
Number
Average Value
Number
Average Value
Number
Average Value
LOANS ORIGINATED
9
$78,943
78
$62,738
93
$59,931
30
$28,533
28
$57,812
13
$36,056
APPLICATIONS APPROVED, NOT ACCEPTED
1
$60,460
27
$49,171
11
$78,109
2
$29,725
2
$44,580
16
$44,922
APPLICATIONS DENIED
3
$65,943
42
$48,501
75
$73,257
23
$26,213
4
$37,150
32
$45,807
APPLICATIONS WITHDRAWN
2
$89,215
16
$88,857
58
$79,266
6
$87,505
6
$52,780
0
$0
FILES CLOSED FOR INCOMPLETENESS
2
$56,875
3
$71,773
10
$112,429
4
$28,182
2
$35,355
0
$0
Aggregated Statistics For Year 2004 (Based on 8 partial tracts)
A) FHA, FSA/RHS & VA Home Purchase Loans
B) Conventional Home Purchase Loans
C) Refinancings
D) Home Improvement Loans
F) Non-occupant Loans on < 5 Family Dwellings (A B C & D)
G) Loans On Manufactured Home Dwelling (A B C & D)
Detailed PMIC statistics for the following Tracts:0405.00
, 0406.00
2006 - 2018 National Fire Incident Reporting System (NFIRS) incidents
According to the data from the years 2006 - 2018 the average number of fire incidents per year is 24. The highest number of fire incidents - 48 took place in 2016, and the least - 0 in 2008. The data has an increasing trend.
When looking into fire subcategories, the most reports belonged to: Outside Fires (57.0%), and Structure Fires (27.1%).
Fire incident types reported to NFIRS in Zip Code 74937


 Nearest zip codes: 74939, 74940, 74949, 74953, 74577, 72938.


 According to the data from the years 2006 - 2018 the average number of fire incidents per year is 24. The highest number of fire incidents - 48 took place in 2016, and the least - 0 in 2008. The data has an increasing trend.
 When looking into fire subcategories, the most reports belonged to: Outside Fires (57.0%), and Structure Fires (27.1%).