Cities: Frisco, TX (72.64%) ,
The Colony, TX (4.34%) ,
Little Elm, TX (2.63%) ,
Hackberry, TX (1.26%) Counties: Denton County, TX (62.85%) ,
Collin County, TX (37.15%) Estimated zip code population in 2022: 50,059
Zip code population in 2010: 72,723
Zip code population in 2000: 16,101
Houses and condos: 23,226
Renter-occupied apartments: 13,002
% of renters here:
59%State:
38%
March 2022 cost of living index in zip code 75034: 99.3
(near average, U.S. average is 100)
Land area: 50.0
sq. mi.
Water area: 3.9
sq. mi.
Population density: 1,001 people per square mile (low).
OSM Map
General Map
Google Map
MSN Map
OSM Map
General Map
Google Map
MSN Map
OSM Map
General Map
Google Map
MSN Map
OSM Map
General Map
Google Map
MSN Map
Please wait while loading the map...
Real estate property taxes paid for housing units in 2022:
This zip code:
1.4% ($10,460)Texas:
1.5% ($4,050)
Median real estate property taxes paid for housing units with mortgages in 2022: $10,505 (1.4%)
Median real estate property taxes paid for housing units with no mortgage in 2022: $10,700 (1.4%)
Profiles of local businesses
Business Search - 14 Million verified businesses
Males: 23,833 Females: 26,226
For population 25 years and over in 75034:
High school or higher: 99.2%Bachelor's degree or higher: 68.1%Graduate or professional degree: 29.8%Unemployed: 2.5%Mean travel time to work (commute): 23.6 minutes
For population 15 years and over in 75034:
Never married: 31.6%Now married: 54.9%Separated: 2.1%Widowed: 3.5%Divorced: 7.9%
Zip code 75034 compared to state average:
Median house value significantly above state average. Unemployed percentage below state average. Hispanic race population percentage below state average. Renting percentage above state average. Length of stay since moving in above state average. Number of rooms per house below state average. House age significantly below state average. Percentage of population with a bachelor's degree or higher above state average. 26,458 52.9% White 9,211 18.4% Asian 7,303 14.6% Hispanic or Latino 4,653 9.3% Black 2,327 4.6% Two or more races 62 0.1% Some other race 24 0.05% Native Hawaiian and Other 17 0.03% American Indian
Data:
Median household income ($)
Median household income (% change since 2000)
Household income diversity
Ratio of average income to average house value (%)
Ratio of average income to average rent
Median household income ($) - White
Median household income ($) - Black or African American
Median household income ($) - Asian
Median household income ($) - Hispanic or Latino
Median household income ($) - American Indian and Alaska Native
Median household income ($) - Multirace
Median household income ($) - Other Race
Median household income for houses/condos with a mortgage ($)
Median household income for apartments without a mortgage ($)
Races - White alone (%)
Races - White alone (% change since 2000)
Races - Black alone (%)
Races - Black alone (% change since 2000)
Races - American Indian alone (%)
Races - American Indian alone (% change since 2000)
Races - Asian alone (%)
Races - Asian alone (% change since 2000)
Races - Hispanic (%)
Races - Hispanic (% change since 2000)
Races - Native Hawaiian and Other Pacific Islander alone (%)
Races - Native Hawaiian and Other Pacific Islander alone (% change since 2000)
Races - Two or more races (%)
Races - Two or more races (% change since 2000)
Races - Other race alone (%)
Races - Other race alone (% change since 2000)
Racial diversity
Unemployment (%)
Unemployment (% change since 2000)
Unemployment (%) - White
Unemployment (%) - Black or African American
Unemployment (%) - Asian
Unemployment (%) - Hispanic or Latino
Unemployment (%) - American Indian and Alaska Native
Unemployment (%) - Multirace
Unemployment (%) - Other Race
Population density (people per square mile)
Population - Males (%)
Population - Females (%)
Population - Males (%) - White
Population - Males (%) - Black or African American
Population - Males (%) - Asian
Population - Males (%) - Hispanic or Latino
Population - Males (%) - American Indian and Alaska Native
Population - Males (%) - Multirace
Population - Males (%) - Other Race
Population - Females (%) - White
Population - Females (%) - Black or African American
Population - Females (%) - Asian
Population - Females (%) - Hispanic or Latino
Population - Females (%) - American Indian and Alaska Native
Population - Females (%) - Multirace
Population - Females (%) - Other Race
Coronavirus confirmed cases (May 28, 2024)
Deaths caused by coronavirus (May 28, 2024)
Coronavirus confirmed cases (per 100k population) (May 28, 2024)
Deaths caused by coronavirus (per 100k population) (May 28, 2024)
Daily increase in number of cases (May 28, 2024)
Weekly increase in number of cases (May 28, 2024)
Cases doubled (in days) (May 28, 2024)
Hospitalized patients (Apr 18, 2022)
Negative test results (Apr 18, 2022)
Total test results (Apr 18, 2022)
COVID Vaccine doses distributed (per 100k population) (Sep 19, 2023)
COVID Vaccine doses administered (per 100k population) (Sep 19, 2023)
COVID Vaccine doses distributed (Sep 19, 2023)
COVID Vaccine doses administered (Sep 19, 2023)
Likely homosexual households (%)
Likely homosexual households (% change since 2000)
Likely homosexual households - Lesbian couples (%)
Likely homosexual households - Lesbian couples (% change since 2000)
Likely homosexual households - Gay men (%)
Likely homosexual households - Gay men (% change since 2000)
Cost of living index
Median gross rent ($)
Median contract rent ($)
Median monthly housing costs ($)
Median house or condo value ($)
Median house or condo value ($ change since 2000)
Mean house or condo value by units in structure - 1, detached ($)
Mean house or condo value by units in structure - 1, attached ($)
Mean house or condo value by units in structure - 2 ($)
Mean house or condo value by units in structure by units in structure - 3 or 4 ($)
Mean house or condo value by units in structure - 5 or more ($)
Mean house or condo value by units in structure - Boat, RV, van, etc. ($)
Mean house or condo value by units in structure - Mobile home ($)
Median house or condo value ($) - White
Median house or condo value ($) - Black or African American
Median house or condo value ($) - Asian
Median house or condo value ($) - Hispanic or Latino
Median house or condo value ($) - American Indian and Alaska Native
Median house or condo value ($) - Multirace
Median house or condo value ($) - Other Race
Median resident age
Resident age diversity
Median resident age - Males
Median resident age - Females
Median resident age - White
Median resident age - Black or African American
Median resident age - Asian
Median resident age - Hispanic or Latino
Median resident age - American Indian and Alaska Native
Median resident age - Multirace
Median resident age - Other Race
Median resident age - Males - White
Median resident age - Males - Black or African American
Median resident age - Males - Asian
Median resident age - Males - Hispanic or Latino
Median resident age - Males - American Indian and Alaska Native
Median resident age - Males - Multirace
Median resident age - Males - Other Race
Median resident age - Females - White
Median resident age - Females - Black or African American
Median resident age - Females - Asian
Median resident age - Females - Hispanic or Latino
Median resident age - Females - American Indian and Alaska Native
Median resident age - Females - Multirace
Median resident age - Females - Other Race
Commute - mean travel time to work (minutes)
Travel time to work - Less than 5 minutes (%)
Travel time to work - Less than 5 minutes (% change since 2000)
Travel time to work - 5 to 9 minutes (%)
Travel time to work - 5 to 9 minutes (% change since 2000)
Travel time to work - 10 to 19 minutes (%)
Travel time to work - 10 to 19 minutes (% change since 2000)
Travel time to work - 20 to 29 minutes (%)
Travel time to work - 20 to 29 minutes (% change since 2000)
Travel time to work - 30 to 39 minutes (%)
Travel time to work - 30 to 39 minutes (% change since 2000)
Travel time to work - 40 to 59 minutes (%)
Travel time to work - 40 to 59 minutes (% change since 2000)
Travel time to work - 60 to 89 minutes (%)
Travel time to work - 60 to 89 minutes (% change since 2000)
Travel time to work - 90 or more minutes (%)
Travel time to work - 90 or more minutes (% change since 2000)
Marital status - Never married (%)
Marital status - Now married (%)
Marital status - Separated (%)
Marital status - Widowed (%)
Marital status - Divorced (%)
Median family income ($)
Median family income (% change since 2000)
Median non-family income ($)
Median non-family income (% change since 2000)
Median per capita income ($)
Median per capita income (% change since 2000)
Median family income ($) - White
Median family income ($) - Black or African American
Median family income ($) - Asian
Median family income ($) - Hispanic or Latino
Median family income ($) - American Indian and Alaska Native
Median family income ($) - Multirace
Median family income ($) - Other Race
Median year house/condo built
Median year apartment built
Year house built - Built 2005 or later (%)
Year house built - Built 2000 to 2004 (%)
Year house built - Built 1990 to 1999 (%)
Year house built - Built 1980 to 1989 (%)
Year house built - Built 1970 to 1979 (%)
Year house built - Built 1960 to 1969 (%)
Year house built - Built 1950 to 1959 (%)
Year house built - Built 1940 to 1949 (%)
Year house built - Built 1939 or earlier (%)
Average household size
Household density (households per square mile)
Average household size - White
Average household size - Black or African American
Average household size - Asian
Average household size - Hispanic or Latino
Average household size - American Indian and Alaska Native
Average household size - Multirace
Average household size - Other Race
Occupied housing units (%)
Vacant housing units (%)
Owner occupied housing units (%)
Renter occupied housing units (%)
Vacancy status - For rent (%)
Vacancy status - For sale only (%)
Vacancy status - Rented or sold, not occupied (%)
Vacancy status - For seasonal, recreational, or occasional use (%)
Vacancy status - For migrant workers (%)
Vacancy status - Other vacant (%)
Residents with income below the poverty level (%)
Residents with income below 50% of the poverty level (%)
Children below poverty level (%)
Poor families by family type - Married-couple family (%)
Poor families by family type - Male, no wife present (%)
Poor families by family type - Female, no husband present (%)
Poverty status for native-born residents (%)
Poverty status for foreign-born residents (%)
Poverty among high school graduates not in families (%)
Poverty among people who did not graduate high school not in families (%)
Residents with income below the poverty level (%) - White
Residents with income below the poverty level (%) - Black or African American
Residents with income below the poverty level (%) - Asian
Residents with income below the poverty level (%) - Hispanic or Latino
Residents with income below the poverty level (%) - American Indian and Alaska Native
Residents with income below the poverty level (%) - Multirace
Residents with income below the poverty level (%) - Other Race
Air pollution - Air Quality Index (AQI)
Air pollution - CO
Air pollution - NO2
Air pollution - SO2
Air pollution - Ozone
Air pollution - PM10
Air pollution - PM25
Air pollution - Pb
Crime - Murders per 100,000 population
Crime - Rapes per 100,000 population
Crime - Robberies per 100,000 population
Crime - Assaults per 100,000 population
Crime - Burglaries per 100,000 population
Crime - Thefts per 100,000 population
Crime - Auto thefts per 100,000 population
Crime - Arson per 100,000 population
Crime - City-data.com crime index
Crime - Violent crime index
Crime - Property crime index
Crime - Murders per 100,000 population (5 year average)
Crime - Rapes per 100,000 population (5 year average)
Crime - Robberies per 100,000 population (5 year average)
Crime - Assaults per 100,000 population (5 year average)
Crime - Burglaries per 100,000 population (5 year average)
Crime - Thefts per 100,000 population (5 year average)
Crime - Auto thefts per 100,000 population (5 year average)
Crime - Arson per 100,000 population (5 year average)
Crime - City-data.com crime index (5 year average)
Crime - Violent crime index (5 year average)
Crime - Property crime index (5 year average)
1996 Presidential Elections Results (%) - Democratic Party (Clinton)
1996 Presidential Elections Results (%) - Republican Party (Dole)
1996 Presidential Elections Results (%) - Other
2000 Presidential Elections Results (%) - Democratic Party (Gore)
2000 Presidential Elections Results (%) - Republican Party (Bush)
2000 Presidential Elections Results (%) - Other
2004 Presidential Elections Results (%) - Democratic Party (Kerry)
2004 Presidential Elections Results (%) - Republican Party (Bush)
2004 Presidential Elections Results (%) - Other
2008 Presidential Elections Results (%) - Democratic Party (Obama)
2008 Presidential Elections Results (%) - Republican Party (McCain)
2008 Presidential Elections Results (%) - Other
2012 Presidential Elections Results (%) - Democratic Party (Obama)
2012 Presidential Elections Results (%) - Republican Party (Romney)
2012 Presidential Elections Results (%) - Other
2016 Presidential Elections Results (%) - Democratic Party (Clinton)
2016 Presidential Elections Results (%) - Republican Party (Trump)
2016 Presidential Elections Results (%) - Other
2020 Presidential Elections Results (%) - Democratic Party (Biden)
2020 Presidential Elections Results (%) - Republican Party (Trump)
2020 Presidential Elections Results (%) - Other
Ancestries Reported - Arab (%)
Ancestries Reported - Czech (%)
Ancestries Reported - Danish (%)
Ancestries Reported - Dutch (%)
Ancestries Reported - English (%)
Ancestries Reported - French (%)
Ancestries Reported - French Canadian (%)
Ancestries Reported - German (%)
Ancestries Reported - Greek (%)
Ancestries Reported - Hungarian (%)
Ancestries Reported - Irish (%)
Ancestries Reported - Italian (%)
Ancestries Reported - Lithuanian (%)
Ancestries Reported - Norwegian (%)
Ancestries Reported - Polish (%)
Ancestries Reported - Portuguese (%)
Ancestries Reported - Russian (%)
Ancestries Reported - Scotch-Irish (%)
Ancestries Reported - Scottish (%)
Ancestries Reported - Slovak (%)
Ancestries Reported - Subsaharan African (%)
Ancestries Reported - Swedish (%)
Ancestries Reported - Swiss (%)
Ancestries Reported - Ukrainian (%)
Ancestries Reported - United States (%)
Ancestries Reported - Welsh (%)
Ancestries Reported - West Indian (%)
Ancestries Reported - Other (%)
Educational Attainment - No schooling completed (%)
Educational Attainment - Less than high school (%)
Educational Attainment - High school or equivalent (%)
Educational Attainment - Less than 1 year of college (%)
Educational Attainment - 1 or more years of college (%)
Educational Attainment - Associate degree (%)
Educational Attainment - Bachelor's degree (%)
Educational Attainment - Master's degree (%)
Educational Attainment - Professional school degree (%)
Educational Attainment - Doctorate degree (%)
School Enrollment - Nursery, preschool (%)
School Enrollment - Kindergarten (%)
School Enrollment - Grade 1 to 4 (%)
School Enrollment - Grade 5 to 8 (%)
School Enrollment - Grade 9 to 12 (%)
School Enrollment - College undergrad (%)
School Enrollment - Graduate or professional (%)
School Enrollment - Not enrolled in school (%)
School enrollment - Public schools (%)
School enrollment - Private schools (%)
School enrollment - Not enrolled (%)
Median number of rooms in houses and condos
Median number of rooms in apartments
Housing units lacking complete plumbing facilities (%)
Housing units lacking complete kitchen facilities (%)
Density of houses
Urban houses (%)
Rural houses (%)
Households with people 60 years and over (%)
Households with people 65 years and over (%)
Households with people 75 years and over (%)
Households with one or more nonrelatives (%)
Households with no nonrelatives (%)
Population in households (%)
Family households (%)
Nonfamily households (%)
Population in families (%)
Family households with own children (%)
Median number of bedrooms in owner occupied houses
Mean number of bedrooms in owner occupied houses
Median number of bedrooms in renter occupied houses
Mean number of bedrooms in renter occupied houses
Median number of vehichles in owner occupied houses
Mean number of vehichles in owner occupied houses
Median number of vehichles in renter occupied houses
Mean number of vehichles in renter occupied houses
Mortgage status - with mortgage (%)
Mortgage status - with second mortgage (%)
Mortgage status - with home equity loan (%)
Mortgage status - with both second mortgage and home equity loan (%)
Mortgage status - without a mortgage (%)
Average family size
Average family size - White
Average family size - Black or African American
Average family size - Asian
Average family size - Hispanic or Latino
Average family size - American Indian and Alaska Native
Average family size - Multirace
Average family size - Other Race
Geographical mobility - Same house 1 year ago (%)
Geographical mobility - Moved within same county (%)
Geographical mobility - Moved from different county within same state (%)
Geographical mobility - Moved from different state (%)
Geographical mobility - Moved from abroad (%)
Place of birth - Born in state of residence (%)
Place of birth - Born in other state (%)
Place of birth - Native, outside of US (%)
Place of birth - Foreign born (%)
Housing units in structures - 1, detached (%)
Housing units in structures - 1, attached (%)
Housing units in structures - 2 (%)
Housing units in structures - 3 or 4 (%)
Housing units in structures - 5 to 9 (%)
Housing units in structures - 10 to 19 (%)
Housing units in structures - 20 to 49 (%)
Housing units in structures - 50 or more (%)
Housing units in structures - Mobile home (%)
Housing units in structures - Boat, RV, van, etc. (%)
House/condo owner moved in on average (years ago)
Renter moved in on average (years ago)
Year householder moved into unit - Moved in 1999 to March 2000 (%)
Year householder moved into unit - Moved in 1995 to 1998 (%)
Year householder moved into unit - Moved in 1990 to 1994 (%)
Year householder moved into unit - Moved in 1980 to 1989 (%)
Year householder moved into unit - Moved in 1970 to 1979 (%)
Year householder moved into unit - Moved in 1969 or earlier (%)
Means of transportation to work - Drove car alone (%)
Means of transportation to work - Carpooled (%)
Means of transportation to work - Public transportation (%)
Means of transportation to work - Bus or trolley bus (%)
Means of transportation to work - Streetcar or trolley car (%)
Means of transportation to work - Subway or elevated (%)
Means of transportation to work - Railroad (%)
Means of transportation to work - Ferryboat (%)
Means of transportation to work - Taxicab (%)
Means of transportation to work - Motorcycle (%)
Means of transportation to work - Bicycle (%)
Means of transportation to work - Walked (%)
Means of transportation to work - Other means (%)
Working at home (%)
Industry diversity
Most Common Industries - Agriculture, forestry, fishing and hunting, and mining (%)
Most Common Industries - Agriculture, forestry, fishing and hunting (%)
Most Common Industries - Mining, quarrying, and oil and gas extraction (%)
Most Common Industries - Construction (%)
Most Common Industries - Manufacturing (%)
Most Common Industries - Wholesale trade (%)
Most Common Industries - Retail trade (%)
Most Common Industries - Transportation and warehousing, and utilities (%)
Most Common Industries - Transportation and warehousing (%)
Most Common Industries - Utilities (%)
Most Common Industries - Information (%)
Most Common Industries - Finance and insurance, and real estate and rental and leasing (%)
Most Common Industries - Finance and insurance (%)
Most Common Industries - Real estate and rental and leasing (%)
Most Common Industries - Professional, scientific, and management, and administrative and waste management services (%)
Most Common Industries - Professional, scientific, and technical services (%)
Most Common Industries - Management of companies and enterprises (%)
Most Common Industries - Administrative and support and waste management services (%)
Most Common Industries - Educational services, and health care and social assistance (%)
Most Common Industries - Educational services (%)
Most Common Industries - Health care and social assistance (%)
Most Common Industries - Arts, entertainment, and recreation, and accommodation and food services (%)
Most Common Industries - Arts, entertainment, and recreation (%)
Most Common Industries - Accommodation and food services (%)
Most Common Industries - Other services, except public administration (%)
Most Common Industries - Public administration (%)
Occupation diversity
Most Common Occupations - Management, business, science, and arts occupations (%)
Most Common Occupations - Management, business, and financial occupations (%)
Most Common Occupations - Management occupations (%)
Most Common Occupations - Business and financial operations occupations (%)
Most Common Occupations - Computer, engineering, and science occupations (%)
Most Common Occupations - Computer and mathematical occupations (%)
Most Common Occupations - Architecture and engineering occupations (%)
Most Common Occupations - Life, physical, and social science occupations (%)
Most Common Occupations - Education, legal, community service, arts, and media occupations (%)
Most Common Occupations - Community and social service occupations (%)
Most Common Occupations - Legal occupations (%)
Most Common Occupations - Education, training, and library occupations (%)
Most Common Occupations - Arts, design, entertainment, sports, and media occupations (%)
Most Common Occupations - Healthcare practitioners and technical occupations (%)
Most Common Occupations - Health diagnosing and treating practitioners and other technical occupations (%)
Most Common Occupations - Health technologists and technicians (%)
Most Common Occupations - Service occupations (%)
Most Common Occupations - Healthcare support occupations (%)
Most Common Occupations - Protective service occupations (%)
Most Common Occupations - Fire fighting and prevention, and other protective service workers including supervisors (%)
Most Common Occupations - Law enforcement workers including supervisors (%)
Most Common Occupations - Food preparation and serving related occupations (%)
Most Common Occupations - Building and grounds cleaning and maintenance occupations (%)
Most Common Occupations - Personal care and service occupations (%)
Most Common Occupations - Sales and office occupations (%)
Most Common Occupations - Sales and related occupations (%)
Most Common Occupations - Office and administrative support occupations (%)
Most Common Occupations - Natural resources, construction, and maintenance occupations (%)
Most Common Occupations - Farming, fishing, and forestry occupations (%)
Most Common Occupations - Construction and extraction occupations (%)
Most Common Occupations - Installation, maintenance, and repair occupations (%)
Most Common Occupations - Production, transportation, and material moving occupations (%)
Most Common Occupations - Production occupations (%)
Most Common Occupations - Transportation occupations (%)
Most Common Occupations - Material moving occupations (%)
People in Group quarters - Institutionalized population (%)
People in Group quarters - Correctional institutions (%)
People in Group quarters - Federal prisons and detention centers (%)
People in Group quarters - Halfway houses (%)
People in Group quarters - Local jails and other confinement facilities (including police lockups) (%)
People in Group quarters - Military disciplinary barracks (%)
People in Group quarters - State prisons (%)
People in Group quarters - Other types of correctional institutions (%)
People in Group quarters - Nursing homes (%)
People in Group quarters - Hospitals/wards, hospices, and schools for the handicapped (%)
People in Group quarters - Hospitals/wards and hospices for chronically ill (%)
People in Group quarters - Hospices or homes for chronically ill (%)
People in Group quarters - Military hospitals or wards for chronically ill (%)
People in Group quarters - Other hospitals or wards for chronically ill (%)
People in Group quarters - Hospitals or wards for drug/alcohol abuse (%)
People in Group quarters - Mental (Psychiatric) hospitals or wards (%)
People in Group quarters - Schools, hospitals, or wards for the mentally retarded (%)
People in Group quarters - Schools, hospitals, or wards for the physically handicapped (%)
People in Group quarters - Institutions for the deaf (%)
People in Group quarters - Institutions for the blind (%)
People in Group quarters - Orthopedic wards and institutions for the physically handicapped (%)
People in Group quarters - Wards in general hospitals for patients who have no usual home elsewhere (%)
People in Group quarters - Wards in military hospitals for patients who have no usual home elsewhere (%)
People in Group quarters - Juvenile institutions (%)
People in Group quarters - Long-term care (%)
People in Group quarters - Homes for abused, dependent, and neglected children (%)
People in Group quarters - Residential treatment centers for emotionally disturbed children (%)
People in Group quarters - Training schools for juvenile delinquents (%)
People in Group quarters - Short-term care, detention or diagnostic centers for delinquent children (%)
People in Group quarters - Type of juvenile institution unknown (%)
People in Group quarters - Noninstitutionalized population (%)
People in Group quarters - College dormitories (includes college quarters off campus) (%)
People in Group quarters - Military quarters (%)
People in Group quarters - On base (%)
People in Group quarters - Barracks, unaccompanied personnel housing (UPH), (Enlisted/Officer), ;and similar group living quarters for military personnel (%)
People in Group quarters - Transient quarters for temporary residents (%)
People in Group quarters - Military ships (%)
People in Group quarters - Group homes (%)
People in Group quarters - Homes or halfway houses for drug/alcohol abuse (%)
People in Group quarters - Homes for the mentally ill (%)
People in Group quarters - Homes for the mentally retarded (%)
People in Group quarters - Homes for the physically handicapped (%)
People in Group quarters - Other group homes (%)
People in Group quarters - Religious group quarters (%)
People in Group quarters - Dormitories (%)
People in Group quarters - Agriculture workers' dormitories on farms (%)
People in Group quarters - Job Corps and vocational training facilities (%)
People in Group quarters - Other workers' dormitories (%)
People in Group quarters - Crews of maritime vessels (%)
People in Group quarters - Other nonhousehold living situations (%)
People in Group quarters - Other noninstitutional group quarters (%)
Residents speaking English at home (%)
Residents speaking English at home - Born in the United States (%)
Residents speaking English at home - Native, born elsewhere (%)
Residents speaking English at home - Foreign born (%)
Residents speaking Spanish at home (%)
Residents speaking Spanish at home - Born in the United States (%)
Residents speaking Spanish at home - Native, born elsewhere (%)
Residents speaking Spanish at home - Foreign born (%)
Residents speaking other language at home (%)
Residents speaking other language at home - Born in the United States (%)
Residents speaking other language at home - Native, born elsewhere (%)
Residents speaking other language at home - Foreign born (%)
Class of Workers - Employee of private company (%)
Class of Workers - Self-employed in own incorporated business (%)
Class of Workers - Private not-for-profit wage and salary workers (%)
Class of Workers - Local government workers (%)
Class of Workers - State government workers (%)
Class of Workers - Federal government workers (%)
Class of Workers - Self-employed workers in own not incorporated business and Unpaid family workers (%)
House heating fuel used in houses and condos - Utility gas (%)
House heating fuel used in houses and condos - Bottled, tank, or LP gas (%)
House heating fuel used in houses and condos - Electricity (%)
House heating fuel used in houses and condos - Fuel oil, kerosene, etc. (%)
House heating fuel used in houses and condos - Coal or coke (%)
House heating fuel used in houses and condos - Wood (%)
House heating fuel used in houses and condos - Solar energy (%)
House heating fuel used in houses and condos - Other fuel (%)
House heating fuel used in houses and condos - No fuel used (%)
House heating fuel used in apartments - Utility gas (%)
House heating fuel used in apartments - Bottled, tank, or LP gas (%)
House heating fuel used in apartments - Electricity (%)
House heating fuel used in apartments - Fuel oil, kerosene, etc. (%)
House heating fuel used in apartments - Coal or coke (%)
House heating fuel used in apartments - Wood (%)
House heating fuel used in apartments - Solar energy (%)
House heating fuel used in apartments - Other fuel (%)
House heating fuel used in apartments - No fuel used (%)
Armed forces status - In Armed Forces (%)
Armed forces status - Civilian (%)
Armed forces status - Civilian - Veteran (%)
Armed forces status - Civilian - Nonveteran (%)
Fatal accidents locations in years 2005-2021
Fatal accidents locations in 2005
Fatal accidents locations in 2006
Fatal accidents locations in 2007
Fatal accidents locations in 2008
Fatal accidents locations in 2009
Fatal accidents locations in 2010
Fatal accidents locations in 2011
Fatal accidents locations in 2012
Fatal accidents locations in 2013
Fatal accidents locations in 2014
Fatal accidents locations in 2015
Fatal accidents locations in 2016
Fatal accidents locations in 2017
Fatal accidents locations in 2018
Fatal accidents locations in 2019
Fatal accidents locations in 2020
Fatal accidents locations in 2021
Alcohol use - People drinking some alcohol every month (%)
Alcohol use - People not drinking at all (%)
Alcohol use - Average days/month drinking alcohol
Alcohol use - Average drinks/week
Alcohol use - Average days/year people drink much
Audiometry - Average condition of hearing (%)
Audiometry - People that can hear a whisper from across a quiet room (%)
Audiometry - People that can hear normal voice from across a quiet room (%)
Audiometry - Ears ringing, roaring, buzzing (%)
Audiometry - Had a job exposure to loud noise (%)
Audiometry - Had off-work exposure to loud noise (%)
Blood Pressure & Cholesterol - Has high blood pressure (%)
Blood Pressure & Cholesterol - Checking blood pressure at home (%)
Blood Pressure & Cholesterol - Frequently checking blood cholesterol (%)
Blood Pressure & Cholesterol - Has high cholesterol level (%)
Consumer Behavior - Money monthly spent on food at supermarket/grocery store
Consumer Behavior - Money monthly spent on food at other stores
Consumer Behavior - Money monthly spent on eating out
Consumer Behavior - Money monthly spent on carryout/delivered foods
Consumer Behavior - Income spent on food at supermarket/grocery store (%)
Consumer Behavior - Income spent on food at other stores (%)
Consumer Behavior - Income spent on eating out (%)
Consumer Behavior - Income spent on carryout/delivered foods (%)
Current Health Status - General health condition (%)
Current Health Status - Blood donors (%)
Current Health Status - Has blood ever tested for HIV virus (%)
Current Health Status - Left-handed people (%)
Dermatology - People using sunscreen (%)
Diabetes - Diabetics (%)
Diabetes - Had a blood test for high blood sugar (%)
Diabetes - People taking insulin (%)
Diet Behavior & Nutrition - Diet health (%)
Diet Behavior & Nutrition - Milk product consumption (# of products/month)
Diet Behavior & Nutrition - Meals not home prepared (#/week)
Diet Behavior & Nutrition - Meals from fast food or pizza place (#/week)
Diet Behavior & Nutrition - Ready-to-eat foods (#/month)
Diet Behavior & Nutrition - Frozen meals/pizza (#/month)
Drug Use - People that ever used marijuana or hashish (%)
Drug Use - Ever used hard drugs (%)
Drug Use - Ever used any form of cocaine (%)
Drug Use - Ever used heroin (%)
Drug Use - Ever used methamphetamine (%)
Health Insurance - People covered by health insurance (%)
Kidney Conditions-Urology - Avg. # of times urinating at night
Medical Conditions - People with asthma (%)
Medical Conditions - People with anemia (%)
Medical Conditions - People with psoriasis (%)
Medical Conditions - People with overweight (%)
Medical Conditions - Elderly people having difficulties in thinking or remembering (%)
Medical Conditions - People who ever received blood transfusion (%)
Medical Conditions - People having trouble seeing even with glass/contacts (%)
Medical Conditions - People with arthritis (%)
Medical Conditions - People with gout (%)
Medical Conditions - People with congestive heart failure (%)
Medical Conditions - People with coronary heart disease (%)
Medical Conditions - People with angina pectoris (%)
Medical Conditions - People who ever had heart attack (%)
Medical Conditions - People who ever had stroke (%)
Medical Conditions - People with emphysema (%)
Medical Conditions - People with thyroid problem (%)
Medical Conditions - People with chronic bronchitis (%)
Medical Conditions - People with any liver condition (%)
Medical Conditions - People who ever had cancer or malignancy (%)
Mental Health - People who have little interest in doing things (%)
Mental Health - People feeling down, depressed, or hopeless (%)
Mental Health - People who have trouble sleeping or sleeping too much (%)
Mental Health - People feeling tired or having little energy (%)
Mental Health - People with poor appetite or overeating (%)
Mental Health - People feeling bad about themself (%)
Mental Health - People who have trouble concentrating on things (%)
Mental Health - People moving or speaking slowly or too fast (%)
Mental Health - People having thoughts they would be better off dead (%)
Oral Health - Average years since last visit a dentist
Oral Health - People embarrassed because of mouth (%)
Oral Health - People with gum disease (%)
Oral Health - General health of teeth and gums (%)
Oral Health - Average days a week using dental floss/device
Oral Health - Average days a week using mouthwash for dental problem
Oral Health - Average number of teeth
Pesticide Use - Households using pesticides to control insects (%)
Pesticide Use - Households using pesticides to kill weeds (%)
Physical Activity - People doing vigorous-intensity work activities (%)
Physical Activity - People doing moderate-intensity work activities (%)
Physical Activity - People walking or bicycling (%)
Physical Activity - People doing vigorous-intensity recreational activities (%)
Physical Activity - People doing moderate-intensity recreational activities (%)
Physical Activity - Average hours a day doing sedentary activities
Physical Activity - Average hours a day watching TV or videos
Physical Activity - Average hours a day using computer
Physical Functioning - People having limitations keeping them from working (%)
Physical Functioning - People limited in amount of work they can do (%)
Physical Functioning - People that need special equipment to walk (%)
Physical Functioning - People experiencing confusion/memory problems (%)
Physical Functioning - People requiring special healthcare equipment (%)
Prescription Medications - Average number of prescription medicines taking
Preventive Aspirin Use - Adults 40+ taking low-dose aspirin (%)
Reproductive Health - Vaginal deliveries (%)
Reproductive Health - Cesarean deliveries (%)
Reproductive Health - Deliveries resulted in a live birth (%)
Reproductive Health - Pregnancies resulted in a delivery (%)
Reproductive Health - Women breastfeeding newborns (%)
Reproductive Health - Women that had a hysterectomy (%)
Reproductive Health - Women that had both ovaries removed (%)
Reproductive Health - Women that have ever taken birth control pills (%)
Reproductive Health - Women taking birth control pills (%)
Reproductive Health - Women that have ever used Depo-Provera or injectables (%)
Reproductive Health - Women that have ever used female hormones (%)
Sexual Behavior - People 18+ that ever had sex (vaginal, anal, or oral) (%)
Sexual Behavior - Males 18+ that ever had vaginal sex with a woman (%)
Sexual Behavior - Males 18+ that ever performed oral sex on a woman (%)
Sexual Behavior - Males 18+ that ever had anal sex with a woman (%)
Sexual Behavior - Males 18+ that ever had any sex with a man (%)
Sexual Behavior - Females 18+ that ever had vaginal sex with a man (%)
Sexual Behavior - Females 18+ that ever performed oral sex on a man (%)
Sexual Behavior - Females 18+ that ever had anal sex with a man (%)
Sexual Behavior - Females 18+ that ever had any kind of sex with a woman (%)
Sexual Behavior - Average age people first had sex
Sexual Behavior - Average number of female sex partners in lifetime (males 18+)
Sexual Behavior - Average number of female vaginal sex partners in lifetime (males 18+)
Sexual Behavior - Average age people first performed oral sex on a woman (18+)
Sexual Behavior - Average number of woman performed oral sex on in lifetime (18+)
Sexual Behavior - Average number of male sex partners in lifetime (males 18+)
Sexual Behavior - Average number of male anal sex partners in lifetime (males 18+)
Sexual Behavior - Average age people first performed oral sex on a man (18+)
Sexual Behavior - Average number of male oral sex partners in lifetime (18+)
Sexual Behavior - People using protection when performing oral sex (%)
Sexual Behavior - Average number of times people have vaginal or anal sex a year
Sexual Behavior - People having sex without condom (%)
Sexual Behavior - Average number of male sex partners in lifetime (females 18+)
Sexual Behavior - Average number of male vaginal sex partners in lifetime (females 18+)
Sexual Behavior - Average number of female sex partners in lifetime (females 18+)
Sexual Behavior - Circumcised males 18+ (%)
Sleep Disorders - Average hours sleeping at night
Sleep Disorders - People that has trouble sleeping (%)
Smoking-Cigarette Use - People smoking cigarettes (%)
Taste & Smell - People 40+ having problems with smell (%)
Taste & Smell - People 40+ having problems with taste (%)
Taste & Smell - People 40+ that ever had wisdom teeth removed (%)
Taste & Smell - People 40+ that ever had tonsils teeth removed (%)
Taste & Smell - People 40+ that ever had a loss of consciousness because of a head injury (%)
Taste & Smell - People 40+ that ever had a broken nose or other serious injury to face or skull (%)
Taste & Smell - People 40+ that ever had two or more sinus infections (%)
Weight - Average height (inches)
Weight - Average weight (pounds)
Weight - Average BMI
Weight - People that are obese (%)
Weight - People that ever were obese (%)
Weight - People trying to lose weight (%)
Urban population: 39,587
Rural population: 10,471
Estimated median house/condo value in 2022: $740,456
75034:
$740,456Texas:
$275,400
According to our research of Texas and other state lists, there were 15 registered sex offenders living in 75034 zip code as of May 28, 2024 . The ratio of all residents to sex offenders in zip code 75034 is 6,121 to 1.The ratio of registered sex offenders to all residents in this zip code is much lower than the state average.
Median resident age: This zip code:
35.8 yearsTexas median age:
35.6 years
Average household size: This zip code:
2.3 peopleTexas:
2.6 people
Averages for the 2020 tax year for zip code 75034, filed in 2021:
Average Adjusted Gross Income (AGI) in 2020: $169,196 (Individual Income Tax Returns) Here:
$169,196State:
$77,054
Salary/wage: $125,230 (reported on 85.7% of returns )Here:
$125,230State:
$62,766
(% of AGI for various income ranges: 1256.6% for AGIs below $25k , 3880.0% for AGIs $25k-50k , 7046.6% for AGIs $50k-75k , 10464.0% for AGIs $75k-100k , 19848.1% for AGIs $100k-200k , 113533.0% for AGIs over 200k ) Taxable interest for individuals: $6,094 (reported on 33.4% of returns )This zip code:
$6,094Texas:
$2,665
(% of AGI for various income ranges: 16.0% for AGIs below $25k , 26.3% for AGIs $25k-50k , 34.9% for AGIs $50k-75k , 84.8% for AGIs $75k-100k , 195.5% for AGIs $100k-200k , 2908.5% for AGIs over 200k ) Ordinary dividends: $15,839 (reported on 29.0% of returns )Here:
$15,839State:
$10,044
(% of AGI for various income ranges: 27.4% for AGIs below $25k , 55.1% for AGIs $25k-50k , 81.8% for AGIs $50k-75k , 187.8% for AGIs $75k-100k , 454.2% for AGIs $100k-200k , 6570.5% for AGIs over 200k ) Net capital gain/loss in AGI: +$80,009 (reported on 30.4% of returns )Here:
+$80,009State:
+$39,590
(% of AGI for various income ranges: 18.9% for AGIs below $25k , 50.9% for AGIs $25k-50k , 81.5% for AGIs $50k-75k , 247.3% for AGIs $75k-100k , 759.9% for AGIs $100k-200k , 40053.3% for AGIs over 200k ) Profit/loss from business: +$21,896 (reported on 22.2% of returns )Here:
+$21,896State:
+$10,888
(% of AGI for various income ranges: 102.6% for AGIs below $25k , 122.7% for AGIs $25k-50k , 162.0% for AGIs $50k-75k , 428.0% for AGIs $75k-100k , 642.7% for AGIs $100k-200k , 5921.6% for AGIs over 200k ) Taxable individual retirement arrangement distribution: $34,543 (reported on 7.3% of returns )75034:
$34,543Texas:
$24,740
(% of AGI for various income ranges: 44.5% for AGIs below $25k , 78.9% for AGIs $25k-50k , 145.1% for AGIs $50k-75k , 292.0% for AGIs $75k-100k , 730.3% for AGIs $100k-200k , 2163.7% for AGIs over 200k ) Self-employed (Keogh) retirement plans: $35,797 (reported on 1.3% of returns )75034:
$35,797Texas:
$29,298
(% of AGI for various income ranges: 15.5% for AGIs $50k-75k , 44.5% for AGIs $100k-200k , 673.9% for AGIs over 200k ) Total itemized deductions: $52,701 (reported on 17.4% of returns )Here:
$52,701State:
$40,428
(% of AGI for various income ranges: 67.1% for AGIs below $25k , 165.4% for AGIs $25k-50k , 298.5% for AGIs $50k-75k , 620.8% for AGIs $75k-100k , 1273.5% for AGIs $100k-200k , 11842.1% for AGIs over 200k ) Charity contributions: $24,178 (reported on 14.7% of returns )Here:
$24,178State:
$18,201
(% of AGI for various income ranges: 5.3% for AGIs below $25k , 22.5% for AGIs $25k-50k , 52.6% for AGIs $50k-75k , 119.1% for AGIs $75k-100k , 294.4% for AGIs $100k-200k , 5331.8% for AGIs over 200k ) Taxes paid: $8,877 (reported on 17.2% of returns )(% of AGI for various income ranges: 13.0% for AGIs below $25k , 32.4% for AGIs $25k-50k , 61.3% for AGIs $50k-75k , 145.6% for AGIs $75k-100k , 345.6% for AGIs $100k-200k , 1650.7% for AGIs over 200k ) Earned income credit: $2,099 (reported on 8.7% of returns )(% of AGI for various income ranges: 72.5% for AGIs below $25k , 44.7% for AGIs $25k-50k , 0.5% for AGIs $50k-75k ) Percentage of individuals using paid preparers for their 2020 taxes: 92.8%(% for various income ranges: 90.5% for AGIs below $25k , 93.6% for AGIs $25k-50k , 93.7% for AGIs $50k-75k , 93.0% for AGIs $75k-100k , 92.7% for AGIs $100k-200k , 94.2% for AGIs over 200k )
Averages for the 2012 tax year for zip code 75034, filed in 2013:
Average Adjusted Gross Income (AGI) in 2012: $157,729 (Individual Income Tax Returns) Here:
$157,729State:
$65,384
Salary/wage: $112,588 (reported on 85.5% of returns )Here:
$112,588State:
$52,524
(% of AGI for various income ranges: 79.4% for AGIs below $25k , 81.7% for AGIs $25k-50k , 77.1% for AGIs $50k-75k , 78.3% for AGIs $75k-100k , 82.0% for AGIs $100k-200k , 50.1% for AGIs over 200k ) Taxable interest for individuals: $3,968 (reported on 41.0% of returns )This zip code:
$3,968Texas:
$2,372
(% of AGI for various income ranges: 1.4% for AGIs below $25k , 0.9% for AGIs $25k-50k , 0.9% for AGIs $50k-75k , 0.8% for AGIs $75k-100k , 0.7% for AGIs $100k-200k , 1.2% for AGIs over 200k ) Ordinary dividends: $13,342 (reported on 29.8% of returns )(% of AGI for various income ranges: 2.5% for AGIs below $25k , 1.5% for AGIs $25k-50k , 1.8% for AGIs $50k-75k , 1.4% for AGIs $75k-100k , 1.3% for AGIs $100k-200k , 3.1% for AGIs over 200k ) Net capital gain/loss in AGI: +$54,197 (reported on 28.3% of returns )Here:
+$54,197State:
+$35,319
(% of AGI for various income ranges: 0.2% for AGIs $25k-50k , 0.8% for AGIs $50k-75k , 0.6% for AGIs $75k-100k , 1.1% for AGIs $100k-200k , 14.7% for AGIs over 200k ) Profit/loss from business: +$23,452 (reported on 20.7% of returns )Here:
+$23,452State:
+$13,732
(% of AGI for various income ranges: 9.4% for AGIs below $25k , 4.4% for AGIs $25k-50k , 3.7% for AGIs $50k-75k , 3.3% for AGIs $75k-100k , 3.6% for AGIs $100k-200k , 2.6% for AGIs over 200k ) Taxable individual retirement arrangement distribution: $32,729 (reported on 10.9% of returns )75034:
$32,729Texas:
$19,511
(% of AGI for various income ranges: 4.1% for AGIs below $25k , 2.7% for AGIs $25k-50k , 3.2% for AGIs $50k-75k , 3.6% for AGIs $75k-100k , 3.2% for AGIs $100k-200k , 1.7% for AGIs over 200k ) Self-employment retirement plans: $25,638 (reported on 1.4% of returns )75034:
$25,638Texas:
$23,938
(% of AGI for various income ranges: 0.2% for AGIs $25k-50k , 0.1% for AGIs $75k-100k , 0.2% for AGIs $100k-200k , 0.3% for AGIs over 200k ) Total itemized deductions: $32,133 (12% of AGI, reported on 50.3% of returns )Here:
$32,133State:
$24,724
Here:
12.0% of AGIState:
15.9% of AGI
(% of AGI for various income ranges: 15.0% for AGIs below $25k , 12.8% for AGIs $25k-50k , 15.0% for AGIs $50k-75k , 15.1% for AGIs $75k-100k , 15.0% for AGIs $100k-200k , 7.7% for AGIs over 200k ) Charity contributions: $7,423 (reported on 42.9% of returns )(% of AGI for various income ranges: 1.0% for AGIs below $25k , 1.5% for AGIs $25k-50k , 2.0% for AGIs $50k-75k , 2.0% for AGIs $75k-100k , 2.3% for AGIs $100k-200k , 2.0% for AGIs over 200k ) Taxes paid: $10,657 (reported on 49.7% of returns )75034:
$10,657State:
$6,921
(% of AGI for various income ranges: 3.3% for AGIs below $25k , 3.2% for AGIs $25k-50k , 4.3% for AGIs $50k-75k , 4.7% for AGIs $75k-100k , 5.1% for AGIs $100k-200k , 2.7% for AGIs over 200k ) Earned income credit: $2,084 (reported on 9.0% of returns )(% of AGI for various income ranges: 4.9% for AGIs below $25k , 0.8% for AGIs $25k-50k ) Percentage of individuals using paid preparers for their 2012 taxes: 49.9%(% for various income ranges: 45.0% for AGIs below $25k , 44.4% for AGIs $25k-50k , 47.3% for AGIs $50k-75k , 46.3% for AGIs $75k-100k , 49.5% for AGIs $100k-200k , 68.8% for AGIs over 200k )
Averages for the 2004 tax year for zip code 75034, filed in 2005:
Average Adjusted Gross Income (AGI) in 2004: $108,957 (Individual Income Tax Returns) Here:
$108,957State:
$47,881
Salary/wage: $96,541 (reported on 90.4% of returns )Here:
$96,541State:
$41,947
(% of AGI for various income ranges: 83.5% for AGIs $10k-25k , 88.7% for AGIs $25k-50k , 87.3% for AGIs $50k-75k , 91.5% for AGIs $75k-100k , 75.4% for AGIs over 100k ) Taxable interest for individuals: $2,090 (reported on 50.7% of returns )This zip code:
$2,090Texas:
$2,255
(% of AGI for various income ranges: 1.9% for AGIs $10k-25k , 1.0% for AGIs $25k-50k , 0.8% for AGIs $50k-75k , 0.5% for AGIs $75k-100k , 0.9% for AGIs over 100k ) Taxable dividends: $5,361 (reported on 33.0% of returns )(% of AGI for various income ranges: 1.2% for AGIs $10k-25k , 0.7% for AGIs $25k-50k , 0.7% for AGIs $50k-75k , 0.5% for AGIs $75k-100k , 1.9% for AGIs over 100k ) Net capital gain/loss: +$21,142 (reported on 31.5% of returns )Here:
+$21,142State:
+$16,110
(% of AGI for various income ranges: 0.2% for AGIs $10k-25k , 0.5% for AGIs $25k-50k , 0.6% for AGIs $50k-75k , 0.7% for AGIs $75k-100k , 7.8% for AGIs over 100k ) Profit/loss from business: +$16,384 (reported on 20.6% of returns )Here:
+$16,384State:
+$11,013
(% of AGI for various income ranges: 7.7% for AGIs $10k-25k , 3.7% for AGIs $25k-50k , 3.4% for AGIs $50k-75k , 2.5% for AGIs $75k-100k , 3.0% for AGIs over 100k ) IRA payment deduction: $3,281 (reported on 2.6% of returns )(% of AGI for various income ranges: 0.2% for AGIs $10k-25k , 0.2% for AGIs $25k-50k , 0.2% for AGIs $50k-75k , 0.1% for AGIs $75k-100k , 0.1% for AGIs over 100k ) Self-employed pension: $19,767 (reported on 1.5% of returns )Here:
$19,767Texas:
$16,401
(% of AGI for various income ranges: 0.1% for AGIs $25k-50k , 0.1% for AGIs $50k-75k , 0.1% for AGIs $75k-100k , 0.3% for AGIs over 100k ) Total itemized deductions: $26,360 (17% of AGI, reported on 58.8% of returns )Here:
$26,360State:
$19,631
Here:
16.8% of AGIState:
18.9% of AGI
(% of AGI for various income ranges: 14.8% for AGIs $10k-25k , 16.1% for AGIs $25k-50k , 19.8% for AGIs $50k-75k , 20.3% for AGIs $75k-100k , 12.4% for AGIs over 100k ) Charity contributions deductions: $5,351 (3% of AGI, reported on 51.7% of returns )Here:
3.3% of AGIState:
4.2% of AGI
(% of AGI for various income ranges: 1.3% for AGIs $10k-25k , 1.8% for AGIs $25k-50k , 2.4% for AGIs $50k-75k , 2.4% for AGIs $75k-100k , 2.6% for AGIs over 100k ) Total tax: $23,066 (reported on 85.4% of returns )75034:
$23,066State:
$9,058
(% of AGI for various income ranges: 4.6% for AGIs $10k-25k , 7.4% for AGIs $25k-50k , 9.1% for AGIs $50k-75k , 10.0% for AGIs $75k-100k , 20.9% for AGIs over 100k ) Earned income credit: $1,738 (reported on 7.1% of returns )Percentage of individuals using paid preparers for their 2004 taxes: 49.7%(% for various income ranges: 42.3% for AGIs below $10k , 53.2% for AGIs $10k-25k , 46.5% for AGIs $25k-50k , 46.7% for AGIs $50k-75k , 44.1% for AGIs $75k-100k , 55.9% for AGIs over 100k )
Estimated median household income in 2022: This zip code:
$103,250Texas:
$72,284
Nearest zip codes: 75035 ,
75024 ,
75056 ,
75010 ,
75068 ,
75078 .
The Colony Zip Code Map
Percentage of family households: This zip code:
47.1%Texas:
50.5%
Percentage of households with unmarried partners: This zip code:
7.4%Texas:
48.7%
Likely homosexual households (counted as self-reported same-sex unmarried-partner households)
Lesbian couples: 0.4% of all households Gay men: 0.4% of all households
Household received Food Stamps/SNAP in the past 12 months: 538Household did not receive Food Stamps/SNAP in the past 12 months: 21,400
Women who had a birth in the past 12 months: 947 (588 now married , 355 unmarried) Women who did not have a birth in the past 12 months: 14,334 (7,231 now married , 7,073 unmarried)
Housing units in zip code 75034 with a mortgage: 6,392 (530
second mortgage , 28
home equity loan , 219
both second mortgage and home equity loan )
Houses without a mortgage: 163
Median monthly owner costs for units with a mortgage: $3,403
Median monthly owner costs for units without a mortgage: $1,533
Residents with income below the poverty level in 2022:
This zip code:
4.8%Whole state:
14.0%
Residents with income below 50% of the poverty level in 2022:
This zip code:
2.3%Whole state:
7.4%
Median number of rooms in houses and condos: Median number of rooms in apartments: Notable locations in this zip code not listed on our city pages
Click to draw/clear zip code borders Notable locations in zip code 75034: (A) , City of Hackberry Wastewater Treatment Plant (B) , Cottonwood Creek Wastewater Treatment Plant (C) , Pilot Point Waste Water Treatment Plant (D) , Stewart Creek West Water Treament Facility (E) , Frisco Fire Department Station 1 (F) , Frisco Fire Department Station 3 (G) , Frisco Fire Department Station 4 (H) , CareFlight - Cotton Gin Road (I) . Display/hide their locations on the map
Shopping Center: (1) . Display/hide its location on the map
Churches in zip code 75034 include: (A) , Stonebriar Community Church (B) , United Pentecostal Church Apostolic Temple (C) , Saint Francis Catholic Church (D) , Primera Iglesia Bautista Church (E) , Cornerstone Community Assembly of God Church (F) , Lebanon Baptist Church (G) , Mary Young Chapel (H) . Display/hide their locations on the map
Cemeteries: (1) , Sonntag Cemetery (2) , Bethel Cemetery (3) , Zion Cemetery (4) , Little Elm Cemetery (5) . Display/hide their locations on the map
Reservoirs: (A) , Anderson Lake (B) , Caldwell Lake (C) , T P and L Lake (D) , Phillips Lake (E) , Phillips North Lake (F) . Display/hide their locations on the map
Streams, rivers, and creeks: (A) . Display/hide its location on the map
Parks in zip code 75034 include: (1) , Eastvale Park (2) , Hackberry Park (3) , Frisco Independent School District Stadium (4) . Display/hide their locations on the map
Year house built (houses)
615 2020 or later11,458 2010 to 20197,500 2000 to 20093,171 1990 to 19991,090 1980 to 1989249 1970 to 197942 1960 to 1969107 1950 to 195942 1940 to 1949121 1939 or earlier
Zip code 75034 household income distribution in 2022 691 Less than $10,000323 $10,000 to $14,999441 $15,000 to $19,999326 $20,000 to $24,999348 $25,000 to $29,999485 $30,000 to $34,999596 $35,000 to $39,999357 $40,000 to $44,999748 $45,000 to $49,9991,641 $50,000 to $59,9991,736 $60,000 to $74,9993,031 $75,000 to $99,9991,923 $100,000 to $124,9991,735 $125,000 to $149,9992,417 $150,000 to $199,9995,198 $200,000 or moreEstimate of home value of owner-occupied houses/condos in 2022 in zip code 75034 28 Less than $10,00037 $60,000 to $69,99942 $80,000 to $89,99924 $90,000 to $99,99937 $150,000 to $174,99914 $175,000 to $199,99977 $200,000 to $249,999473 $250,000 to $299,999713 $300,000 to $399,9991,533 $400,000 to $499,9994,276 $500,000 to $749,9992,550 $750,000 to $999,999946 $1,000,000 to $1,499,999485 $1,500,000 to $1,999,999374 $2,000,000 or moreRent paid by renters in 2022 in zip code 75034 11 $200 to $249117 $500 to $54926 $600 to $64942 $700 to $74932 $750 to $79944 $800 to $899433 $900 to $9992,898 $1,000 to $1,2493,845 $1,250 to $1,4993,075 $1,500 to $1,9991,688 $2,000 to $2,499618 $2,500 to $2,999601 $3,000 to $3,499138 $3,500 or more137 No cash rent
Median gross rent in 2022: $1,663.
Median price asked for vacant for-sale houses and condos in 2022: $684,662.
Estimated median house (or condo) value in 2022 for: White Non-Hispanic householders: $823,261Black or African American householders: $779,243American Indian or Alaska Native householders: $980,591Asian householders: $762,682Native Hawaiian and other Pacific Islander householders: $980,591Some other race householders: $367,830Two or more races householders: $1,762,886Hispanic or Latino householders: $422,308Estimated median house or condo value in 2022: $740,456
75034:
$740,456Texas:
$275,400
Lower value quartile - upper value quartile: $545,078 - $992,925
Mean price in 2022: Detached houses: $2,053,165Here:
$2,053,165State:
$369,058
Townhouses or other attached units: $455,553Here:
$455,553State:
$327,631
In 5-or-more-unit structures: $10,355Here:
$10,355State:
$413,944
Mobile homes: $531,834Here:
$531,834State:
$124,413
Housing units in structures:
One, detached: 9,159One, attached: 1,134Two: 4023 or 4: 4535 to 9: 1,09810 to 19: 1,30820 to 49: 1,79150 or more: 8,503Mobile homes: 147Boats, RVs, vans, etc.: 102Unemployment : 2.5%
Means of transportation to work in zip code 75034 60.7% 17,774 Drove a car alone5.8% 1,701 Carpooled0.1% 24 Bus or trolley bus0.0% 5 Streetcar or trolley car0.5% 133 Taxi0.0% 13 Motorcycle1.5% 425 Walked1.1% 327 Other means36.2% 10,620 Worked at homeTravel time to work (commute) in zip code 75034 711 Less than 5 minutes2,724 5 to 9 minutes3,110 10 to 14 minutes3,439 15 to 19 minutes1,889 20 to 24 minutes1,432 25 to 29 minutes2,958 30 to 34 minutes619 35 to 39 minutes1,057 40 to 44 minutes1,335 45 to 59 minutes875 60 to 89 minutes260 90 or more minutes
Percentage of zip code residents living and working in this county: 63.9%
Household type by relationship:
Households: 50,059
Male householders: 11,502 (3,249 living alone ), Female householders: 10,531 (5,073 living alone )10,603 spouses (10,579 opposite-sex spouses ), 1,408 unmarried partners , (1,379 opposite-sex unmarried partners ), 13,336 children (12,718 natural , 152 adopted , 463 stepchildren ), 277 grandchildren , 435 brothers or sisters , 1,005 parents , 0 foster children , 449 other relatives , 720 non-relatives In group quarters: 65 (-1 institutionalized population )
Size of family households: 4,834 2-persons , 2,994 3-persons , 3,050 4-persons , 1,382 5-persons , 219 6-persons , 45 7-or-more-persons
Size of nonfamily households: 8,320 1-person , 1,197 2-persons , 45 3-persons , 26 4-persons
8,619 married couples with children. single-parent households (439 men , 1,056 women ).
73.5% of residents of 75034 zip code speak English at home. of residents speak Spanish at home (63% very well, 22% well, 13% not well, 2% not at all ).of residents speak other Indo-European language at home (84% very well, 12% well, 4% not well ).of residents speak Asian or Pacific Island language at home (71% very well, 19% well, 8% not well, 2% not at all ).of residents speak other language at home (87% very well, 13% well ).
Foreign born population: 11,457 (22.9%)
(44.5%
of them are naturalized citizens )
This zip code:
22.9%Whole state:
17.2%
34% Bhutan 11% Honduras 6% Japan 4% India 4% Liberia 3% Uruguay 3% Sweden 10% English 6% German 5% American 5% Irish 2% Italian 2% Nigerian 2% Iranian
Year of entry for the foreign-born population
6,286 2010 or later 2,688 2000 to 2009 1,866 1990 to 1999 1,914 Before 1990
Facilities with environmental interests located in this zip code:
BANKSTON FORD OF FRISCO (N PRESTON RD @ HIGHWAY in FRISCO, TX)
(Resource Conservation and Recovery Act (tracking hazardous waste)) Organizations: BANKSTONJIM (CONTACT/OPERATOR)
1.49 DRYCLEAN SUPER CENTER (6552 PRESTON RD in FRISCO, TX)
Small Quantity Generators, between 100 kg and 1000 kg of hazardous waste/month (Resource Conservation and Recovery Act (tracking hazardous waste)) - notification Alternative names: DRY CLEAN SUPER CENTER
ABATEMENT SYSTEMS INC (8074 DOVE COVE in FRISCO, TX)
TRANSPORTER (Resource Conservation and Recovery Act (tracking hazardous waste)) - notification
Housing units lacking complete plumbing facilities: 0.9%
Housing units lacking complete kitchen facilities: 1.2%
62.1% Electricity 36.4% Utility gas 0.9% Bottled, tank, or LP gas 0.5% No fuel used
Population in 1990: 8,045. Population change in the 1990s: +8,056 (+100.1%).
Place of birth for U.S.-born residents:
This state: 18,657Northeast: 3,065Midwest: 6,343South: 5,720West: 4,337
35% of the 75034 zip code residents lived in the same house 5 years ago.
Out of people who lived in different houses, 30% lived in this county.
Out of people who lived in different counties, 50% lived in Texas.
81% of the 75034 zip code residents lived in the same house 1 year ago.
Out of people who lived in different houses, 28% moved from this county.
Out of people who lived in different houses, 38% moved from different county within same state.
Out of people who lived in different houses, 23% moved from different state.
Out of people who lived in different houses, 14% moved from abroad.
Private vs. public school enrollment:
Students in private schools in grades 1 to 8 (elementary and middle school): 462
Students in private schools in grades 9 to 12 (high school): 460
Students in private undergraduate colleges: 683
Occupation by median earnings in the past 12 months ($)
134,625 Management occupations 109,933 Health diagnosing and treating practitioners and other technical occupations 104,933 Computer and mathematical occupations 97,611 Business and financial operations occupations 95,858 Life, physical, and social science occupations 92,386 Legal occupations
Companies with federal contracts located in this zip code (FRISCO, TX):
INTERNATIONAL TECHNOLOGIES INC (5300 TOWN CNTRY BLVD 27; small business) employees , $2500000 revenue . Woman Owned Business: $1,327,973 in 10 contracts from 2003 to 2006
Contracts for ADP Facility Operation and Maintenance Services by U.S. Fish and Wildlife ServiceSigned by year: 2000: $0; 2001: $0; 2002: $0; 2003: $336,240; 2004: $292,600; 2005: $699,133; 2006: $0.
Biggest contracts: with U.S. Fish and Wildlife Service for ADP Facility Operation and Maintenance Services. Taking place in CO. Signed on 2005-04-04. Effective on 2005-04-01. Completion date: 2005-12-31.
, same as above. Signed on 2005-12-30. Completion date: 2006-12-31.
, same as above. Signed on 2004-01-23. Completion date: 2004-11-30.
, same as above. Signed on 2003-07-15. Completion date: 2004-06-15.
US DETECTION TECHNOLOGIES INC (2611 INTERNET BOULEVARD; small business)
$288,984 with Department of Defense for Other Research and Development -- Advanced Development (R&D). Signed on 2005-04-28. Completion date: 2005-10-28.
STONEBRIAR HOTEL LLC, THE (1549 LEGACY DRIVE; small business)
$8,013 with Army for Lodging - Hotel/Motel. Signed on 2005-01-05. Completion date: 2005-01-07.
PRISM EMBLLSHD SPORTSWEAR (8940 MARILYN DR; small business) in 2 contracts in 2005
$6,673 with Army for Badges and Insignia. Signed on 2005-06-20. Completion date: 2005-06-27.
, same as above. Signed on 2005-06-22. Completion date: 2005-06-27.
DCPOWER NETWORKS, INC (8568 WARREN PARKWAY; small business) employees , $0 revenue . Small Disadvantaged Business, Veteran Owned Business: $0 in 2 contracts in 2004
$14,945 with Army for Other ADP and Telecommunications Services (includes data storage on tapes, compact disks, etc.). Taking place in VA. Signed on 2004-05-10. Completion date: 2004-06-10.
, same as above. Signed on 2004-05-17. Completion date: 2004-06-10.
Top industries in this zip code by the number of employees in 2005:
Accommodation and Food Services: Full-Service Restaurants (100-249 employees: 5 establishments, 50-99 employees: 9 establishments, 20-49 employees: 11 establishments, 10-19 employees: 5 establishments, 5-9 employees: 5 establishments, 1-4 employees: 8 establishments)Management of Companies and Enterprises: Corporate, Subsidiary, and Regional Managing Offices (250-499: 2, 50-99: 1, 10-19: 1, 5-9: 1, 1-4: 4)Accommodation and Food Services: Limited-Service Restaurants (50-99: 2, 20-49: 14, 10-19: 10, 5-9: 5, 1-4: 9)Construction: Water and Sewer Line and Related Structures Construction (250-499: 1, 50-99: 2, 20-49: 1)Other Services (except Public Administration): Religious Organizations (100-249: 1, 50-99: 2, 20-49: 3, 10-19: 4, 5-9: 4, 1-4: 6)Finance and Insurance: Real Estate Credit (100-249: 1, 50-99: 2, 20-49: 2, 10-19: 2, 5-9: 3, 1-4: 12)
People in group quarters in 2010:
153 people in nursing facilities/skilled-nursing facilities
People in group quarters in 2000:
31 people in agriculture workers' dormitories on farms
7 people in other workers' dormitories
Fatal accident statistics in 2014:
Fatal accident count: 2Vehicles involved in fatal accidents: 4Fatal accidents caused by drunken drivers: 0Fatalities: 2Persons involved in fatal accidents: 5Pedestrians involved in fatal accidents: 0
Fatal accident statistics in 2013:
Fatal accident count: 2Vehicles involved in fatal accidents: 3Fatal accidents caused by drunken drivers: 1Fatalities: 2Persons involved in fatal accidents: 4Pedestrians involved in fatal accidents: 0
Home Mortgage Disclosure Act Aggregated Statistics For Year 2009(Based on 2 full and 16 partial tracts) A) FHA, FSA/RHS & VA B) Conventional C) Refinancings D) Home Improvement Loans F) Non-occupant Loans on G) Loans On Manufactured Number Average Value Number Average Value Number Average Value Number Average Value Number Average Value Number Average Value
LOANS ORIGINATED 1,914 $181,509 2,517 $215,422 5,881 $208,612 194 $75,290 279 $166,376 7 $64,701 APPLICATIONS APPROVED, NOT ACCEPTED 62 $183,065 173 $176,666 507 $193,775 36 $48,700 23 $144,464 2 $58,815 APPLICATIONS DENIED 239 $182,563 303 $213,694 1,456 $218,239 207 $43,902 115 $147,352 9 $65,151 APPLICATIONS WITHDRAWN 210 $178,222 333 $225,420 1,116 $211,393 49 $87,566 58 $155,363 1 $77,720 FILES CLOSED FOR INCOMPLETENESS 32 $170,590 53 $223,794 245 $218,915 10 $90,962 16 $141,993 1 $43,990
Aggregated Statistics For Year 2008(Based on 2 full and 16 partial tracts) A) FHA, FSA/RHS & VA B) Conventional C) Refinancings D) Home Improvement Loans E) Loans on Dwellings For 5+ Families F) Non-occupant Loans on G) Loans On Manufactured Number Average Value Number Average Value Number Average Value Number Average Value Number Average Value Number Average Value Number Average Value
LOANS ORIGINATED 1,344 $177,344 3,727 $216,249 2,267 $208,273 379 $54,499 1 $23,321,690 475 $166,258 14 $50,509 APPLICATIONS APPROVED, NOT ACCEPTED 64 $178,262 372 $217,335 303 $196,274 85 $48,299 0 $0 63 $151,905 10 $60,648 APPLICATIONS DENIED 192 $171,485 668 $213,627 1,298 $199,045 441 $52,565 0 $0 171 $158,434 23 $96,496 APPLICATIONS WITHDRAWN 154 $175,937 579 $222,291 727 $207,268 68 $73,643 0 $0 99 $188,563 1 $42,260 FILES CLOSED FOR INCOMPLETENESS 26 $174,340 97 $233,898 145 $233,946 21 $93,821 0 $0 14 $155,156 0 $0
Aggregated Statistics For Year 2007(Based on 2 full and 16 partial tracts) A) FHA, FSA/RHS & VA B) Conventional C) Refinancings D) Home Improvement Loans E) Loans on Dwellings For 5+ Families F) Non-occupant Loans on G) Loans On Manufactured Number Average Value Number Average Value Number Average Value Number Average Value Number Average Value Number Average Value Number Average Value
LOANS ORIGINATED 665 $168,557 6,893 $184,287 2,046 $202,263 519 $49,042 2 $13,706,235 680 $152,554 9 $51,852 APPLICATIONS APPROVED, NOT ACCEPTED 24 $146,602 967 $186,078 362 $201,740 184 $48,453 0 $0 105 $171,172 10 $61,076 APPLICATIONS DENIED 87 $160,746 1,325 $230,209 1,641 $194,061 498 $46,093 0 $0 272 $193,916 30 $70,484 APPLICATIONS WITHDRAWN 93 $171,108 949 $191,832 745 $182,827 64 $69,677 0 $0 130 $199,249 3 $107,503 FILES CLOSED FOR INCOMPLETENESS 7 $160,767 213 $210,560 302 $220,920 15 $65,530 0 $0 47 $147,366 0 $0
Aggregated Statistics For Year 2006(Based on 2 full and 16 partial tracts) A) FHA, FSA/RHS & VA B) Conventional C) Refinancings D) Home Improvement Loans E) Loans on Dwellings For 5+ Families F) Non-occupant Loans on G) Loans On Manufactured Number Average Value Number Average Value Number Average Value Number Average Value Number Average Value Number Average Value Number Average Value
LOANS ORIGINATED 584 $164,326 10,928 $156,202 1,908 $196,445 524 $58,256 3 $11,136,620 1,681 $134,286 14 $89,100 APPLICATIONS APPROVED, NOT ACCEPTED 33 $167,163 1,571 $164,145 417 $180,564 186 $38,499 0 $0 315 $157,907 10 $33,687 APPLICATIONS DENIED 74 $166,457 2,047 $195,360 1,433 $180,367 478 $48,125 0 $0 455 $174,211 22 $62,366 APPLICATIONS WITHDRAWN 85 $164,951 1,571 $171,113 864 $194,174 80 $67,441 0 $0 279 $162,730 1 $47,870 FILES CLOSED FOR INCOMPLETENESS 7 $178,079 264 $189,087 415 $198,663 11 $41,895 0 $0 53 $174,500 0 $0
Aggregated Statistics For Year 2005(Based on 2 full and 16 partial tracts) A) FHA, FSA/RHS & VA B) Conventional C) Refinancings D) Home Improvement Loans E) Loans on Dwellings For 5+ Families F) Non-occupant Loans on G) Loans On Manufactured Number Average Value Number Average Value Number Average Value Number Average Value Number Average Value Number Average Value Number Average Value
LOANS ORIGINATED 588 $150,391 10,933 $147,753 2,627 $182,762 474 $60,748 4 $16,482,325 1,270 $125,886 14 $43,567 APPLICATIONS APPROVED, NOT ACCEPTED 24 $143,455 1,302 $156,518 427 $170,355 165 $51,409 0 $0 165 $144,153 13 $51,738 APPLICATIONS DENIED 75 $153,326 1,887 $172,732 1,754 $166,979 456 $42,958 1 $17,923,920 320 $151,227 36 $53,202 APPLICATIONS WITHDRAWN 118 $159,769 1,676 $239,293 1,007 $189,839 147 $213,969 0 $0 249 $144,846 9 $62,603 FILES CLOSED FOR INCOMPLETENESS 8 $155,675 401 $148,768 670 $182,565 4 $57,968 0 $0 51 $134,730 0 $0
Aggregated Statistics For Year 2004(Based on 2 full and 16 partial tracts) A) FHA, FSA/RHS & VA B) Conventional C) Refinancings D) Home Improvement Loans E) Loans on Dwellings For 5+ Families F) Non-occupant Loans on G) Loans On Manufactured Number Average Value Number Average Value Number Average Value Number Average Value Number Average Value Number Average Value Number Average Value
LOANS ORIGINATED 957 $144,428 8,635 $153,371 3,949 $163,103 333 $58,151 2 $489,110 734 $131,277 9 $58,473 APPLICATIONS APPROVED, NOT ACCEPTED 27 $131,312 950 $162,707 521 $157,137 100 $39,460 0 $0 101 $183,104 6 $51,297 APPLICATIONS DENIED 129 $141,779 1,305 $165,407 1,777 $163,931 357 $39,847 0 $0 190 $132,001 14 $48,216 APPLICATIONS WITHDRAWN 168 $151,869 1,077 $167,670 1,243 $166,756 55 $65,511 0 $0 101 $166,519 6 $68,365 FILES CLOSED FOR INCOMPLETENESS 18 $147,864 259 $179,392 642 $163,211 15 $45,194 0 $0 29 $120,649 0 $0
Aggregated Statistics For Year 2003(Based on 2 full and 16 partial tracts) A) FHA, FSA/RHS & VA B) Conventional C) Refinancings D) Home Improvement Loans E) Loans on Dwellings For 5+ Families F) Non-occupant Loans on Number Average Value Number Average Value Number Average Value Number Average Value Number Average Value Number Average Value
LOANS ORIGINATED 1,163 $145,775 6,969 $155,454 10,066 $160,002 382 $38,701 6 $3,513,903 499 $134,040 APPLICATIONS APPROVED, NOT ACCEPTED 47 $151,153 761 $141,802 1,056 $148,405 161 $49,680 0 $0 57 $149,439 APPLICATIONS DENIED 185 $139,643 756 $156,678 2,474 $144,846 399 $35,074 0 $0 132 $185,716 APPLICATIONS WITHDRAWN 221 $144,697 1,032 $162,331 1,653 $157,206 43 $44,194 0 $0 83 $161,589 FILES CLOSED FOR INCOMPLETENESS 24 $134,438 284 $143,856 319 $171,054 8 $37,892 0 $0 15 $164,395
Aggregated Statistics For Year 2002(Based on 4 partial tracts) A) FHA, FSA/RHS & VA B) Conventional C) Refinancings D) Home Improvement Loans E) Loans on Dwellings For 5+ Families F) Non-occupant Loans on Number Average Value Number Average Value Number Average Value Number Average Value Number Average Value Number Average Value
LOANS ORIGINATED 340 $130,661 662 $126,540 729 $129,698 43 $39,298 1 $143,950 56 $100,796 APPLICATIONS APPROVED, NOT ACCEPTED 12 $132,199 81 $91,196 81 $112,583 23 $24,023 0 $0 3 $61,653 APPLICATIONS DENIED 35 $131,605 127 $94,575 227 $109,245 56 $24,419 0 $0 16 $152,018 APPLICATIONS WITHDRAWN 52 $128,827 95 $118,433 177 $121,322 10 $29,133 0 $0 7 $126,516 FILES CLOSED FOR INCOMPLETENESS 6 $139,502 29 $111,064 79 $119,561 1 $7,240 0 $0 3 $98,380
Aggregated Statistics For Year 2001(Based on 4 partial tracts) A) FHA, FSA/RHS & VA B) Conventional C) Refinancings D) Home Improvement Loans F) Non-occupant Loans on Number Average Value Number Average Value Number Average Value Number Average Value Number Average Value
LOANS ORIGINATED 356 $126,677 616 $126,328 445 $131,853 58 $25,316 36 $90,410 APPLICATIONS APPROVED, NOT ACCEPTED 10 $126,776 58 $101,871 52 $131,137 19 $27,201 5 $130,152 APPLICATIONS DENIED 30 $121,459 97 $94,368 129 $108,419 55 $28,501 9 $101,224 APPLICATIONS WITHDRAWN 48 $129,382 75 $146,097 109 $109,011 16 $25,909 3 $139,970 FILES CLOSED FOR INCOMPLETENESS 5 $111,552 16 $112,752 32 $119,108 1 $31,750 2 $123,045
Aggregated Statistics For Year 2000(Based on 4 partial tracts) A) FHA, FSA/RHS & VA B) Conventional C) Refinancings D) Home Improvement Loans F) Non-occupant Loans on Number Average Value Number Average Value Number Average Value Number Average Value Number Average Value
LOANS ORIGINATED 276 $119,211 572 $131,164 76 $102,245 63 $25,975 25 $79,416 APPLICATIONS APPROVED, NOT ACCEPTED 9 $107,671 49 $96,725 14 $108,079 36 $24,856 0 $0 APPLICATIONS DENIED 15 $117,951 114 $199,273 52 $95,948 39 $19,988 6 $2,253,810 APPLICATIONS WITHDRAWN 52 $114,971 70 $135,828 23 $101,210 4 $21,010 3 $80,467 FILES CLOSED FOR INCOMPLETENESS 4 $92,412 13 $111,428 20 $124,690 2 $14,475 1 $288,900
Aggregated Statistics For Year 1999(Based on 5 partial tracts) A) FHA, FSA/RHS & VA B) Conventional C) Refinancings D) Home Improvement Loans E) Loans on Dwellings For 5+ Families F) Non-occupant Loans on Number Average Value Number Average Value Number Average Value Number Average Value Number Average Value Number Average Value
LOANS ORIGINATED 628 $116,713 1,910 $138,604 655 $113,679 208 $30,056 0 $0 86 $84,686 APPLICATIONS APPROVED, NOT ACCEPTED 21 $110,276 221 $125,083 134 $116,919 88 $28,394 1 $13,710 13 $79,068 APPLICATIONS DENIED 46 $117,721 350 $107,486 182 $103,617 115 $19,961 0 $0 25 $71,875 APPLICATIONS WITHDRAWN 73 $116,101 244 $154,891 194 $106,297 13 $22,725 1 $40,730 9 $89,971 FILES CLOSED FOR INCOMPLETENESS 7 $114,006 51 $157,484 78 $110,593 5 $25,544 0 $0 11 $113,535
Private Mortgage Insurance Companies Aggregated Statistics For Year 2009(Based on 2 full and 16 partial tracts) A) Conventional B) Refinancings C) Non-occupant Loans on Number Average Value Number Average Value Number Average Value
LOANS ORIGINATED 543 $239,906 275 $224,205 3 $136,147 APPLICATIONS APPROVED, NOT ACCEPTED 114 $246,505 103 $230,890 5 $138,224 APPLICATIONS DENIED 62 $250,874 52 $229,848 7 $114,200 APPLICATIONS WITHDRAWN 28 $279,155 32 $232,607 0 $0 FILES CLOSED FOR INCOMPLETENESS 6 $242,105 3 $192,677 1 $41,000
Aggregated Statistics For Year 2008(Based on 2 full and 16 partial tracts) A) Conventional B) Refinancings C) Non-occupant Loans on D) Loans On Manufactured Number Average Value Number Average Value Number Average Value Number Average Value
LOANS ORIGINATED 1,184 $226,508 278 $214,391 108 $164,998 0 $0 APPLICATIONS APPROVED, NOT ACCEPTED 300 $243,430 115 $208,531 33 $199,353 1 $233,920 APPLICATIONS DENIED 72 $268,498 13 $231,068 23 $228,920 0 $0 APPLICATIONS WITHDRAWN 43 $261,054 12 $185,107 4 $176,470 0 $0 FILES CLOSED FOR INCOMPLETENESS 23 $219,046 9 $205,544 9 $212,199 1 $202,000
Aggregated Statistics For Year 2007(Based on 2 full and 16 partial tracts) A) Conventional B) Refinancings C) Non-occupant Loans on Number Average Value Number Average Value Number Average Value
LOANS ORIGINATED 1,157 $206,377 228 $204,849 113 $179,303 APPLICATIONS APPROVED, NOT ACCEPTED 164 $206,571 50 $234,044 20 $180,706 APPLICATIONS DENIED 53 $325,161 5 $252,758 7 $428,443 APPLICATIONS WITHDRAWN 50 $254,018 12 $197,918 8 $194,271 FILES CLOSED FOR INCOMPLETENESS 5 $203,540 2 $114,185 1 $78,290
Aggregated Statistics For Year 2006(Based on 2 full and 16 partial tracts) A) Conventional B) Refinancings C) Non-occupant Loans on Number Average Value Number Average Value Number Average Value
LOANS ORIGINATED 544 $189,844 116 $195,879 64 $167,985 APPLICATIONS APPROVED, NOT ACCEPTED 98 $198,419 36 $194,650 18 $169,483 APPLICATIONS DENIED 7 $169,776 2 $352,660 3 $208,780 APPLICATIONS WITHDRAWN 31 $214,182 9 $200,400 7 $219,401 FILES CLOSED FOR INCOMPLETENESS 3 $136,493 0 $0 0 $0
Aggregated Statistics For Year 2005(Based on 2 full and 16 partial tracts) A) Conventional B) Refinancings C) Non-occupant Loans on D) Loans On Manufactured Number Average Value Number Average Value Number Average Value Number Average Value
LOANS ORIGINATED 626 $186,142 180 $184,047 84 $156,686 1 $54,970 APPLICATIONS APPROVED, NOT ACCEPTED 102 $193,446 61 $184,704 25 $164,716 2 $58,305 APPLICATIONS DENIED 7 $240,586 2 $134,880 6 $246,205 0 $0 APPLICATIONS WITHDRAWN 39 $172,298 9 $206,540 10 $187,697 0 $0 FILES CLOSED FOR INCOMPLETENESS 9 $235,561 4 $191,252 4 $189,775 0 $0
Aggregated Statistics For Year 2004(Based on 2 full and 16 partial tracts) A) Conventional B) Refinancings C) Non-occupant Loans on D) Loans On Manufactured Number Average Value Number Average Value Number Average Value Number Average Value
LOANS ORIGINATED 783 $180,908 289 $183,270 101 $139,592 0 $0 APPLICATIONS APPROVED, NOT ACCEPTED 170 $178,810 148 $187,617 24 $133,962 2 $170,745 APPLICATIONS DENIED 10 $153,952 3 $124,357 4 $166,225 0 $0 APPLICATIONS WITHDRAWN 49 $205,581 25 $170,232 12 $174,876 0 $0 FILES CLOSED FOR INCOMPLETENESS 11 $178,302 4 $176,945 2 $110,840 0 $0
Aggregated Statistics For Year 2003(Based on 2 full and 16 partial tracts) A) Conventional B) Refinancings C) Non-occupant Loans on Number Average Value Number Average Value Number Average Value
LOANS ORIGINATED 1,005 $185,834 852 $179,182 99 $136,290 APPLICATIONS APPROVED, NOT ACCEPTED 165 $182,297 211 $185,199 20 $162,104 APPLICATIONS DENIED 15 $194,097 10 $215,272 5 $180,870 APPLICATIONS WITHDRAWN 59 $192,170 56 $174,428 10 $174,807 FILES CLOSED FOR INCOMPLETENESS 3 $131,217 4 $189,842 2 $135,455
Aggregated Statistics For Year 2002(Based on 4 partial tracts) A) Conventional B) Refinancings C) Non-occupant Loans on Number Average Value Number Average Value Number Average Value
LOANS ORIGINATED 129 $156,287 68 $150,745 13 $114,665 APPLICATIONS APPROVED, NOT ACCEPTED 23 $189,317 19 $139,025 1 $148,260 APPLICATIONS DENIED 4 $116,322 1 $105,950 0 $0 APPLICATIONS WITHDRAWN 7 $155,431 7 $135,704 2 $129,025 FILES CLOSED FOR INCOMPLETENESS 0 $0 1 $144,800 0 $0
Aggregated Statistics For Year 2001(Based on 4 partial tracts) A) Conventional B) Refinancings C) Non-occupant Loans on Number Average Value Number Average Value Number Average Value
LOANS ORIGINATED 125 $142,974 35 $148,157 12 $93,991 APPLICATIONS APPROVED, NOT ACCEPTED 15 $141,702 5 $180,260 1 $79,960 APPLICATIONS DENIED 5 $126,430 1 $106,150 1 $106,150 APPLICATIONS WITHDRAWN 1 $265,840 0 $0 0 $0 FILES CLOSED FOR INCOMPLETENESS 0 $0 1 $103,570 0 $0
Aggregated Statistics For Year 2000(Based on 4 partial tracts) A) Conventional B) Refinancings C) Non-occupant Loans on Number Average Value Number Average Value Number Average Value
LOANS ORIGINATED 114 $142,159 8 $125,480 7 $79,676 APPLICATIONS APPROVED, NOT ACCEPTED 13 $141,430 3 $115,700 0 $0 APPLICATIONS DENIED 6 $155,275 1 $55,490 0 $0 APPLICATIONS WITHDRAWN 5 $118,652 1 $53,080 0 $0 FILES CLOSED FOR INCOMPLETENESS 1 $92,840 0 $0 0 $0
Aggregated Statistics For Year 1999(Based on 5 partial tracts) A) Conventional B) Refinancings C) Non-occupant Loans on Number Average Value Number Average Value Number Average Value
LOANS ORIGINATED 580 $148,358 87 $120,836 14 $100,323 APPLICATIONS APPROVED, NOT ACCEPTED 48 $157,189 21 $120,422 1 $38,290 APPLICATIONS DENIED 25 $157,868 4 $153,815 0 $0 APPLICATIONS WITHDRAWN 20 $171,294 4 $122,920 0 $0 FILES CLOSED FOR INCOMPLETENESS 14 $144,969 4 $112,620 2 $109,555
2002 - 2018 National Fire Incident Reporting System (NFIRS) incidents See full 2006 National Fire Incident Reporting System statistics for zip code 75034, Texas
Most common first names in zip code 75034 among deceased individuals Name Count Lived (average)
John 51 75.1 years James 41 68.1 years Mary 36 78.4 years Robert 34 70.3 years William 31 73.0 years George 26 72.6 years Dorothy 16 78.6 years Thomas 14 73.1 years Henry 14 81.4 years Billy 13 67.1 years
Most common last names in zip code 75034 among deceased individuals Last name Count Lived (average)
Smith 27 76.1 years Davis 22 77.4 years Jones 17 70.5 years Johnson 14 77.4 years Wilson 13 77.0 years Thompson 12 73.2 years Williams 11 80.8 years Carter 9 76.0 years James 9 73.5 years Bailey 8 82.0 years
Businesses in zip code 75034
Name Count Name Count
24 Hour Fitness 1 Justice 2 7-Eleven 5 KFC 1 ALDO 1 Kohl's 1 AT&T 5 Kroger 3 Abercrombie & Fitch 1 La-Z-Boy 1 Abercrombie Kids 1 Lane Bryant 1 Aeropostale 1 Lane Furniture 1 Albertsons 1 LensCrafters 1 American Eagle Outfitters 1 Little Caesars Pizza 1 Ann Taylor 1 Lowe's 1 Apple Store 1 Macy's 1 Applebee's 1 Marshalls 1 Arby's 1 McDonald's 2 Ashley Furniture 1 Men's Wearhouse 1 AutoZone 1 Motherhood Maternity 2 Banana Republic 1 New Balance 2 Barnes & Noble 1 Nike 15 Baskin-Robbins 1 Nordstrom 1 Bath & Body Works 2 Office Depot 1 Bebe 1 Old Navy 1 Bed Bath & Beyond 1 Olive Garden 1 Blockbuster 3 Pac Sun 1 Brookstone 1 Panda Express 2 Burger King 1 Payless 2 Buybuy BABY 1 Penske 1 CVS 3 PetSmart 1 Cache 1 Pier 1 Imports 1 Charlotte Russe 1 Pizza Hut 1 Chick-Fil-A 2 Plato's Closet 1 Chico's 1 Popeyes 2 Chipotle 1 Pottery Barn 1 Cinnabon 1 Pottery Barn Kids 1 Clarks 1 Quiznos 2 Coldwater Creek 1 RadioShack 3 DHL 3 Red Lobster 1 Dairy Queen 1 Rooms To Go 2 Dunkin Donuts 1 Rue21 1 Eddie Bauer 1 SONIC Drive-In 5 Ethan Allen 1 Safeway 1 Express 1 Sears 2 Famous Footwear 1 Sephora 2 FedEx 7 Sheraton 1 Finish Line 1 Soma Intimates 1 Firestone Complete Auto Care 2 Spencer Gifts 1 Ford 1 Sprint Nextel 2 Forever 21 1 Staples 1 GNC 2 Starbucks 8 GameStop 3 Steak 'n Shake 1 Gap 1 T-Mobile 6 Gymboree 1 T.J.Maxx 1 H&R Block 2 Taco Bell 1 Havertys Furniture 1 Target 2 Hilton 3 The Cheesecake Factory 1 Hobby Lobby 1 Torrid 1 Holiday Inn 2 Toys"R"Us 1 Hollister Co. 1 U-Haul 2 Home Depot 1 UPS 9 Honda 1 Vans 3 Hot Topic 1 Verizon Wireless 2 IHOP 2 Victoria's Secret 1 IKEA 1 Vons 1 J.Crew 1 Walgreens 2 JCPenney 1 Walmart 1 Jack In The Box 1 Wendy's 3 JoS. A. Bank 1 Westin 1 Jones New York 2 YMCA 1 Journeys 1
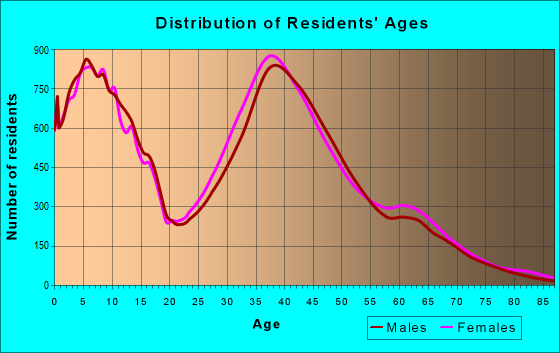
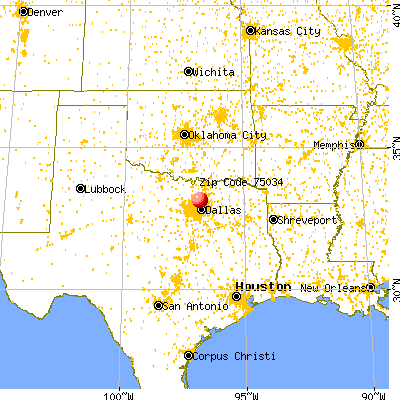


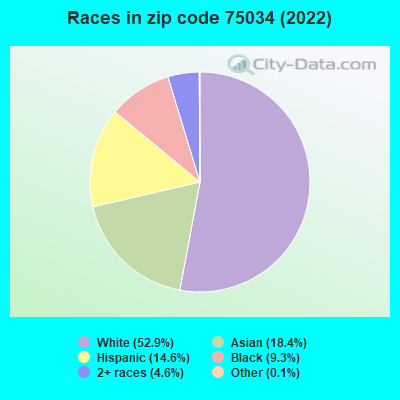


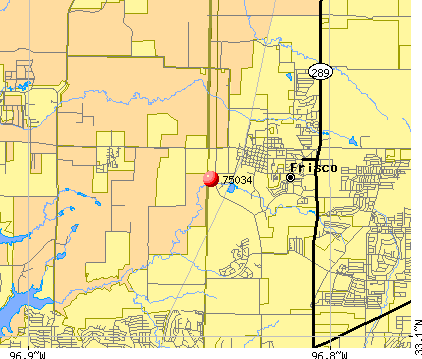 Nearest zip codes: 75035, 75024, 75056, 75010, 75068, 75078.

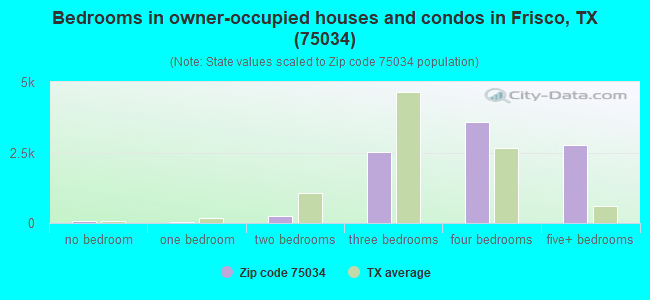
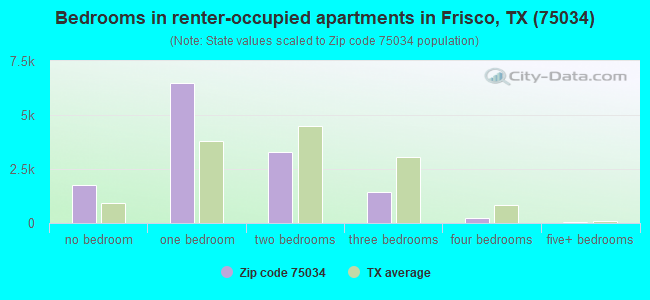
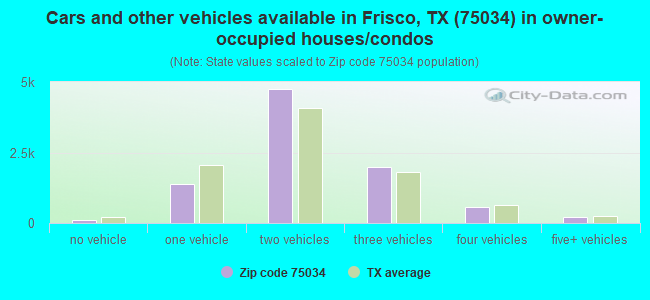
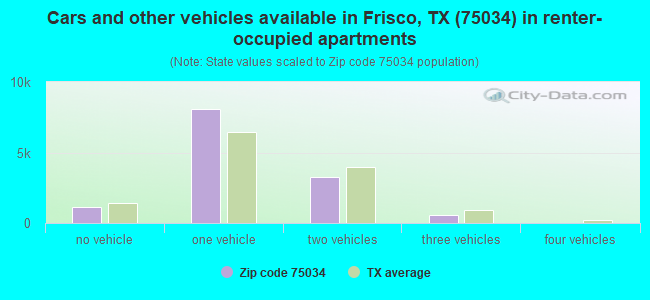


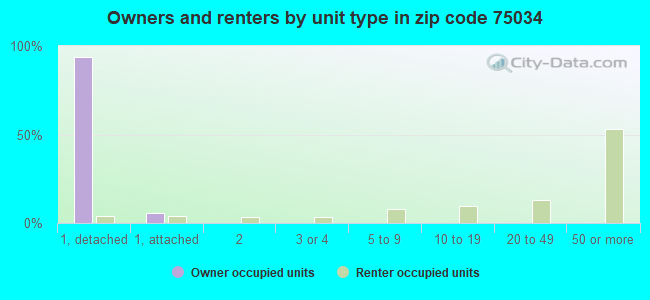


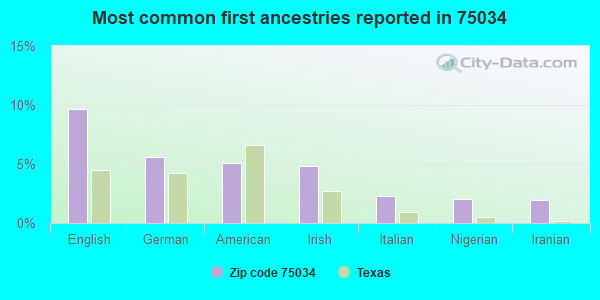
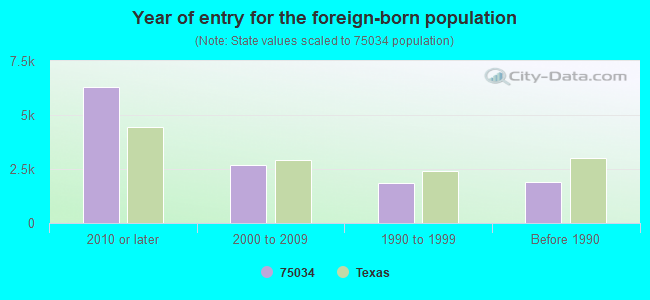
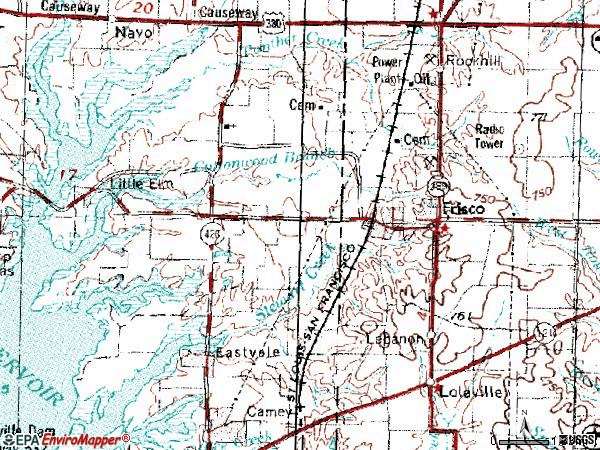


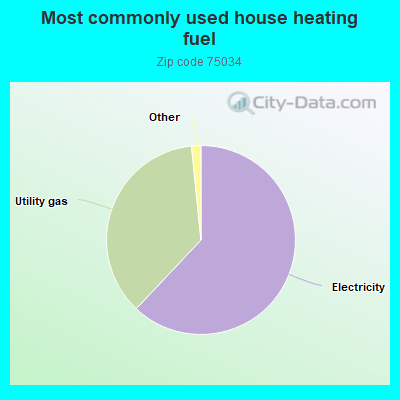
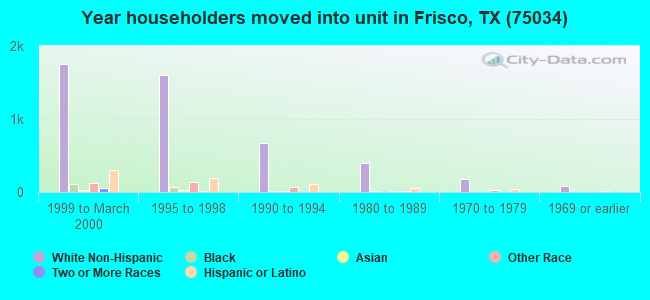
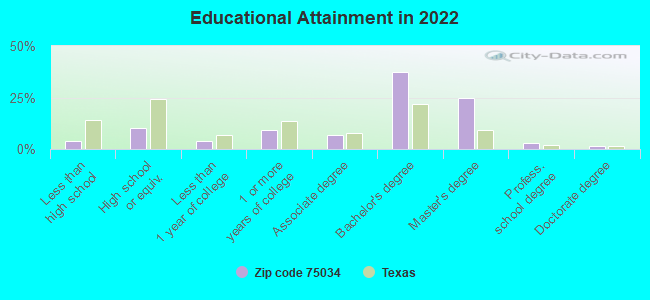
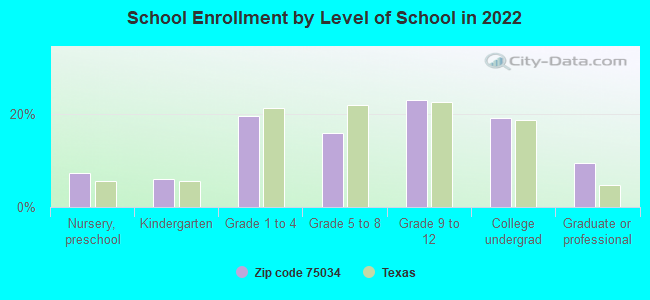
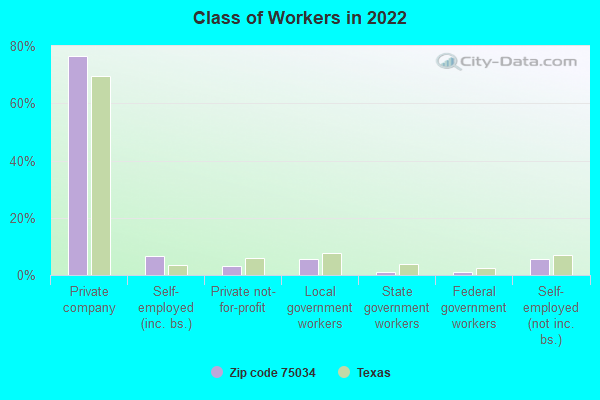

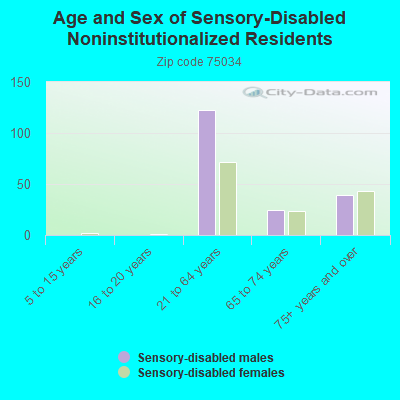
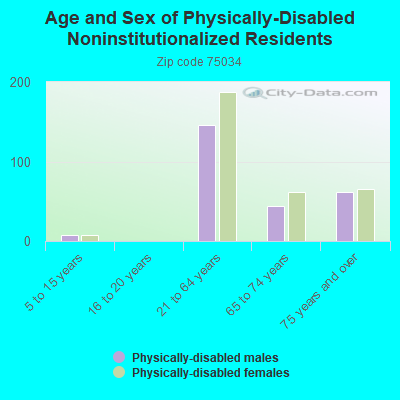
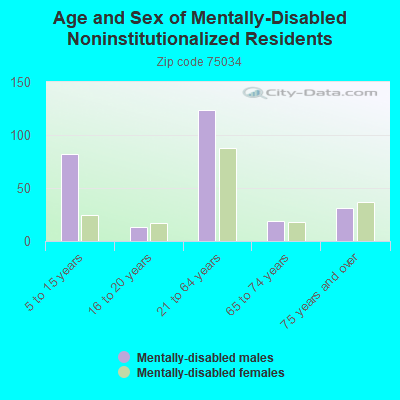
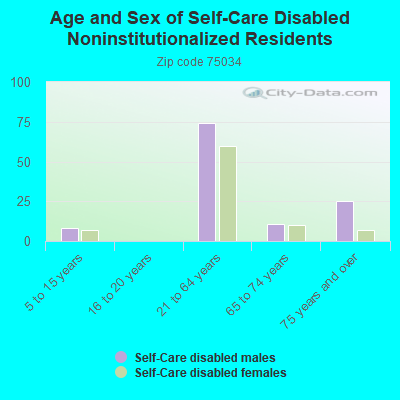
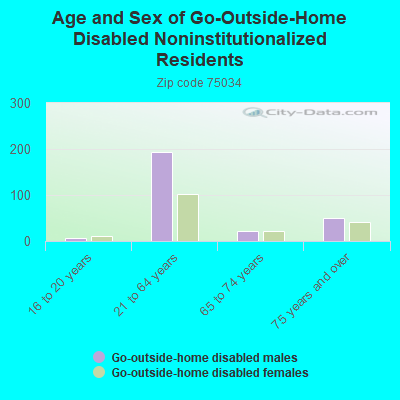

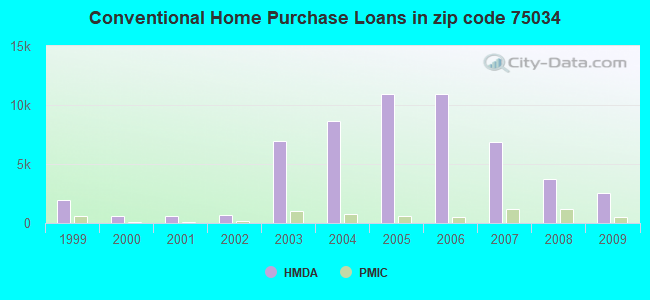
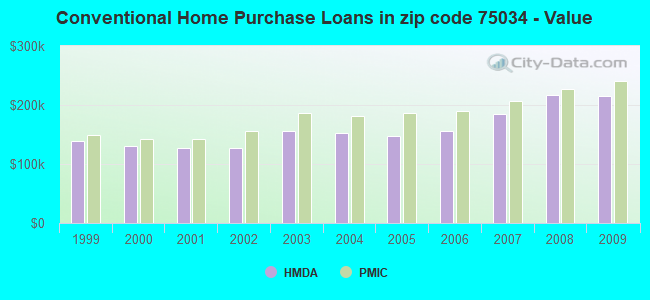
 Based on the data from the years 2002 - 2018 the average number of fire incidents per year is 146. The highest number of fires - 197 took place in 2005, and the least - 74 in 2007. The data has an increasing trend.
 When looking into fire subcategories, the most reports belonged to: Outside Fires (52.8%), and Structure Fires (21.1%).