Estimated zip code population in 2022: 6,368 Zip code population in 2010: 4,139 Zip code population in 2000: 3,861
Houses and condos: 2,050 Renter-occupied apartments: 232
% of renters here:
12%
State:
38%
March 2022 cost of living index in zip code 75158: 85.4 (less than average, U.S. average is 100)
Land area: 87.9 sq. mi. Water area: 1.1 sq. mi.
Population density: 72 people per square mile
(very low).
OSM Map
General Map
Google Map
MSN Map
OSM Map
General Map
Google Map
MSN Map
OSM Map
General Map
Google Map
MSN Map
OSM Map
General Map
Google Map
MSN Map
Please wait while loading the map...
Real estate property taxes paid for housing units in 2022:
This zip code:
1.0% ($2,961)
Texas:
1.5% ($4,050)
Median real estate property taxes paid for housing units with mortgages in 2022: $3,312 (1.1%) Median real estate property taxes paid for housing units with no mortgage in 2022: $2,633 (0.8%)
Estimated median house/condo value in 2022: $310,346
75158:
$310,346
Texas:
$275,400
According to our research of Texas and other state lists, there were 10 registered sex offenders living in 75158 zip code as of June 09, 2024. The ratio of all residents to sex offenders in zip code 75158 is 416 to 1. The ratio of registered sex offenders to all residents in this zip code is near the state average.
Median resident age:
This zip code:
37.5 years
Texas median age:
35.6 years
Average household size:
This zip code:
3.2 people
Texas:
2.6 people
Averages for the 2020 tax year for zip code 75158, filed in 2021:
Average Adjusted Gross Income (AGI) in 2020: $61,710 (Individual Income Tax Returns)
Here:
$61,710
State:
$77,054
Salary/wage: $57,642 (reported on 80.9% of returns)
Here:
$57,642
State:
$62,766
(% of AGI for various income ranges: 1127.0% for AGIs below $25k, 3336.0% for AGIs $25k-50k, 6415.0% for AGIs $50k-75k, 9052.4% for AGIs $75k-100k, 16884.6% for AGIs $100k-200k, 58460.0% for AGIs over 200k)
Taxable interest for individuals: $686 (reported on 19.1% of returns)
This zip code:
$686
Texas:
$2,665
(% of AGI for various income ranges: 5.8% for AGIs below $25k, 8.3% for AGIs $25k-50k, 17.5% for AGIs $50k-75k, 6.5% for AGIs $75k-100k, 26.2% for AGIs $100k-200k, 550.0% for AGIs over 200k)
Ordinary dividends: $1,800 (reported on 9.1% of returns)
Here:
$1,800
State:
$10,044
(% of AGI for various income ranges: 4.2% for AGIs below $25k, 15.6% for AGIs $25k-50k, 7.5% for AGIs $50k-75k, 34.7% for AGIs $75k-100k, 84.2% for AGIs $100k-200k)
Net capital gain/loss in AGI: +$11,900 (reported on 9.1% of returns)
Here:
+$11,900
State:
+$39,590
(% of AGI for various income ranges: 3.4% for AGIs below $25k, 31.5% for AGIs $25k-50k, 20.4% for AGIs $50k-75k, 162.4% for AGIs $75k-100k, 424.6% for AGIs $100k-200k, 4895.0% for AGIs over 200k)
Profit/loss from business: +$9,826 (reported on 21.7% of returns)
Here:
+$9,826
State:
+$10,888
(% of AGI for various income ranges: 213.4% for AGIs below $25k, 161.7% for AGIs $25k-50k, 258.2% for AGIs $50k-75k, 323.5% for AGIs $75k-100k, 390.4% for AGIs $100k-200k, 4300.0% for AGIs over 200k)
Taxable individual retirement arrangement distribution: $21,247 (reported on 7.4% of returns)
75158:
$21,247
Texas:
$24,740
(% of AGI for various income ranges: 43.0% for AGIs below $25k, 80.6% for AGIs $25k-50k, 185.7% for AGIs $50k-75k, 329.4% for AGIs $75k-100k, 804.2% for AGIs $100k-200k)
Total itemized deductions: $33,533 (reported on 5.2% of returns)
Here:
$33,533
State:
$40,428
(% of AGI for various income ranges: 378.2% for AGIs $50k-75k, 362.9% for AGIs $75k-100k, 514.2% for AGIs $100k-200k, 5570.0% for AGIs over 200k)
Charity contributions: $12,400 (reported on 3.9% of returns)
Here:
$12,400
State:
$18,201
(% of AGI for various income ranges: 100.4% for AGIs $50k-75k, 155.8% for AGIs $100k-200k, 2305.0% for AGIs over 200k)
Taxes paid: $6,691 (reported on 4.8% of returns)
75158:
$6,691
State:
$7,821
(% of AGI for various income ranges: 55.4% for AGIs $50k-75k, 63.5% for AGIs $75k-100k, 110.4% for AGIs $100k-200k, 1040.0% for AGIs over 200k)
Earned income credit: $2,251 (reported on 17.0% of returns)
Here:
$2,251
State:
$2,584
(% of AGI for various income ranges: 101.8% for AGIs below $25k, 76.9% for AGIs $25k-50k)
Percentage of individuals using paid preparers for their 2020 taxes: 92.2%
Here:
92%
State:
92%
(% for various income ranges: 89.7% for AGIs below $25k, 93.1% for AGIs $25k-50k, 94.6% for AGIs $50k-75k, 95.7% for AGIs $75k-100k, 91.9% for AGIs $100k-200k, 85.7% for AGIs over 200k)
Averages for the 2012 tax year for zip code 75158, filed in 2013:
Average Adjusted Gross Income (AGI) in 2012: $54,289 (Individual Income Tax Returns)
Here:
$54,289
State:
$65,384
Salary/wage: $52,242 (reported on 82.9% of returns)
Here:
$52,242
State:
$52,524
(% of AGI for various income ranges: 70.4% for AGIs below $25k, 80.1% for AGIs $25k-50k, 84.7% for AGIs $50k-75k, 81.3% for AGIs $75k-100k, 81.1% for AGIs $100k-200k, 73.0% for AGIs over 200k)
Taxable interest for individuals: $1,121 (reported on 25.7% of returns)
This zip code:
$1,121
Texas:
$2,372
(% of AGI for various income ranges: 0.8% for AGIs below $25k, 0.8% for AGIs $25k-50k, 0.1% for AGIs $50k-75k, 0.5% for AGIs $75k-100k, 0.8% for AGIs $100k-200k)
Ordinary dividends: $1,182 (reported on 11.8% of returns)
Here:
$1,182
State:
$9,721
(% of AGI for various income ranges: 1.3% for AGIs below $25k, 0.2% for AGIs $25k-50k, 0.4% for AGIs $100k-200k)
Net capital gain/loss in AGI: +$4,110 (reported on 10.7% of returns)
Here:
+$4,110
State:
+$35,319
(% of AGI for various income ranges: 0.2% for AGIs $25k-50k, 0.1% for AGIs $50k-75k, 0.1% for AGIs $75k-100k, 2.9% for AGIs $100k-200k)
Profit/loss from business: +$8,692 (reported on 21.4% of returns)
Here:
+$8,692
State:
+$13,732
(% of AGI for various income ranges: 11.6% for AGIs below $25k, 5.8% for AGIs $25k-50k, 2.8% for AGIs $50k-75k, 1.1% for AGIs $75k-100k, 3.1% for AGIs $100k-200k)
Taxable individual retirement arrangement distribution: $15,608 (reported on 7.0% of returns)
75158:
$15,608
Texas:
$19,511
(% of AGI for various income ranges: 3.6% for AGIs below $25k, 2.6% for AGIs $25k-50k, 1.5% for AGIs $50k-75k, 2.6% for AGIs $75k-100k, 2.0% for AGIs $100k-200k)
Total itemized deductions: $22,049 (21% of AGI, reported on 23.0% of returns)
Here:
$22,049
State:
$24,724
Here:
21.4% of AGI
State:
15.9% of AGI
(% of AGI for various income ranges: 8.0% for AGIs below $25k, 7.8% for AGIs $25k-50k, 10.4% for AGIs $50k-75k, 8.7% for AGIs $75k-100k, 10.4% for AGIs $100k-200k, 9.5% for AGIs over 200k)
Charity contributions: $5,374 (reported on 16.6% of returns)
Here:
$5,374
State:
$6,808
(% of AGI for various income ranges: 0.7% for AGIs below $25k, 0.8% for AGIs $25k-50k, 1.0% for AGIs $50k-75k, 1.8% for AGIs $75k-100k, 2.5% for AGIs $100k-200k, 2.3% for AGIs over 200k)
Taxes paid: $4,695 (reported on 23.0% of returns)
75158:
$4,695
State:
$6,921
(% of AGI for various income ranges: 1.4% for AGIs below $25k, 1.5% for AGIs $25k-50k, 1.6% for AGIs $50k-75k, 2.1% for AGIs $75k-100k, 2.6% for AGIs $100k-200k, 2.1% for AGIs over 200k)
Earned income credit: $2,384 (reported on 19.8% of returns)
Here:
$2,384
State:
$2,570
(% of AGI for various income ranges: 7.8% for AGIs below $25k, 1.4% for AGIs $25k-50k)
Percentage of individuals using paid preparers for their 2012 taxes: 55.1%
Here:
55%
State:
51%
(% for various income ranges: 48.5% for AGIs below $25k, 55.6% for AGIs $25k-50k, 58.1% for AGIs $50k-75k, 54.5% for AGIs $75k-100k, 65.0% for AGIs $100k-200k, 100.0% for AGIs over 200k)
Averages for the 2004 tax year for zip code 75158, filed in 2005:
Average Adjusted Gross Income (AGI) in 2004: $42,054 (Individual Income Tax Returns)
Here:
$42,054
State:
$47,881
Salary/wage: $41,995 (reported on 84.8% of returns)
Here:
$41,995
State:
$41,947
(% of AGI for various income ranges: 212.5% for AGIs below $10k, 78.3% for AGIs $10k-25k, 85.2% for AGIs $25k-50k, 89.1% for AGIs $50k-75k, 90.3% for AGIs $75k-100k, 73.2% for AGIs over 100k)
Taxable interest for individuals: $1,092 (reported on 31.8% of returns)
This zip code:
$1,092
Texas:
$2,255
(% of AGI for various income ranges: 5.8% for AGIs below $10k, 1.1% for AGIs $10k-25k, 1.3% for AGIs $25k-50k, 0.4% for AGIs $50k-75k, 0.4% for AGIs $75k-100k, 0.8% for AGIs over 100k)
Taxable dividends: $810 (reported on 13.5% of returns)
Here:
$810
State:
$4,261
(% of AGI for various income ranges: 2.3% for AGIs below $10k, 0.3% for AGIs $10k-25k, 0.2% for AGIs $25k-50k, 0.1% for AGIs $50k-75k, 0.2% for AGIs $75k-100k, 0.4% for AGIs over 100k)
Net capital gain/loss: +$8,031 (reported on 11.2% of returns)
Here:
+$8,031
State:
+$16,110
(% of AGI for various income ranges: -2.4% for AGIs below $10k, 0.2% for AGIs $10k-25k, 0.1% for AGIs $25k-50k, 0.6% for AGIs $50k-75k, -0.0% for AGIs $75k-100k, 7.9% for AGIs over 100k)
Profit/loss from business: +$5,688 (reported on 21.6% of returns)
Here:
+$5,688
State:
+$11,013
(% of AGI for various income ranges: -21.8% for AGIs below $10k, 6.9% for AGIs $10k-25k, 4.6% for AGIs $25k-50k, 3.1% for AGIs $50k-75k, 0.8% for AGIs $75k-100k, 2.2% for AGIs over 100k)
IRA payment deduction: $2,871 (reported on 1.8% of returns)
75158:
$2,871
Texas:
$3,120
Total itemized deductions: $16,483 (23% of AGI, reported on 26.8% of returns)
Here:
$16,483
State:
$19,631
Here:
22.7% of AGI
State:
18.9% of AGI
(% of AGI for various income ranges: 30.1% for AGIs below $10k, 7.9% for AGIs $10k-25k, 10.3% for AGIs $25k-50k, 10.9% for AGIs $50k-75k, 11.6% for AGIs $75k-100k, 9.7% for AGIs over 100k)
Charity contributions deductions: $3,517 (4% of AGI, reported on 18.9% of returns)
Here:
$3,517
State:
$4,753
Here:
4.5% of AGI
State:
4.2% of AGI
(% of AGI for various income ranges: 0.9% for AGIs $10k-25k, 1.2% for AGIs $25k-50k, 1.4% for AGIs $50k-75k, 1.7% for AGIs $75k-100k, 2.3% for AGIs over 100k)
Total tax: $5,673 (reported on 74.3% of returns)
75158:
$5,673
State:
$9,058
(% of AGI for various income ranges: 8.6% for AGIs below $10k, 4.1% for AGIs $10k-25k, 6.5% for AGIs $25k-50k, 8.2% for AGIs $50k-75k, 10.3% for AGIs $75k-100k, 17.1% for AGIs over 100k)
Earned income credit: $1,851 (reported on 17.3% of returns)
Here:
$1,851
State:
$2,024
Percentage of individuals using paid preparers for their 2004 taxes: 61.3%
Here:
61%
State:
57%
(% for various income ranges: 51.3% for AGIs below $10k, 66.2% for AGIs $10k-25k, 61.7% for AGIs $25k-50k, 64.5% for AGIs $50k-75k, 58.3% for AGIs $75k-100k, 68.1% for AGIs over 100k)
Household received Food Stamps/SNAP in the past 12 months: 173 Household did not receive Food Stamps/SNAP in the past 12 months: 1,799
Women who had a birth in the past 12 months: 148 (79 now married, 68 unmarried) Women who did not have a birth in the past 12 months: 1,290 (634 now married, 654 unmarried)
Housing units in zip code 75158 with a mortgage: 977 (6 second mortgage, 7 both second mortgage and home equity loan) Houses without a mortgage: 1
Median monthly owner costs for units with a mortgage: $1,661 Median monthly owner costs for units without a mortgage: $677
Residents with income below the poverty level in 2022:
This zip code:
5.9%
Whole state:
14.0%
Residents with income below 50% of the poverty level in 2022:
This zip code:
3.4%
Whole state:
7.4%
Median number of rooms in houses and condos:
Here:
5.9
State:
6.3
Median number of rooms in apartments:
Here:
4.7
State:
4.0
Notable locations in this zip code not listed on our city pages
Churches in zip code 75158 include: Wilson Chapel Church (A), Cottonwood Church (B), Holiness Church (C), Mount Horeb Church (D), Mount Olive Church (E). Display/hide their locations on the map
Lakes and reservoirs: Peters Lake (A), Sand Pit Lake (B), Lower East Fork Lateral Site Number Eleven (C), Lateral Site Number Two (D), Lateral Site Number Twelve (E), Lateral Site Number Eleven (F), Soil Conservation Service Site 1 Reservoir (G), Soil Conservation Service Site 2 Reservoir (H). Display/hide their locations on the map
In group quarters: 52 (-1 institutionalized population)
Size of family households: 618 2-persons, 227 3-persons, 147 4-persons, 267 5-persons, 62 6-persons, 171 7-or-more-persons
Size of nonfamily households: 383 1-person, 96 2-persons
1,057 married couples with children.
61 single-parent households (7 men, 54 women).
91.0% of residents of 75158 zip code speak English at home.
8.7% of residents speak Spanish at home (71% very well, 11% well, 14% not well, 3% not at all).
0.1% of residents speak other Indo-European language at home (100% very well).
Foreign born population: 201 (3.2%) (59.6% of them are naturalized citizens)
This zip code:
3.2%
Whole state:
17.2%
86%Honduras
10%Uruguay
2%Azores Islands
1%United Kingdom, excluding England and Scotland
22%American
10%English
10%Irish
6%German
4%Scottish
2%Russian
1%European
Year of entry for the foreign-born population
222010 or later
142000 to 2009
991990 to 1999
86Before 1990
Housing units lacking complete plumbing facilities: 0.9% Housing units lacking complete kitchen facilities: 1.1%
80.6%Electricity
11.0%Bottled, tank, or LP gas
6.4%Utility gas
2.1%Wood
Population in 1990: 2,589. Population change in the 1990s: +1,272 (+49.1%).
Place of birth for U.S.-born residents:
This state: 4,991
Northeast: 267
Midwest: 298
South: 385
West: 142
62% of the 75158 zip code residents lived in the same house 5 years ago. Out of people who lived in different houses, 44% lived in this county. Out of people who lived in different counties, 50% lived in Texas.
89% of the 75158 zip code residents lived in the same house 1 year ago. Out of people who lived in different houses, 40% moved from this county. Out of people who lived in different houses, 56% moved from different county within same state. Out of people who lived in different houses, 4% moved from different state.
Private vs. public school enrollment:
Students in private schools in grades 1 to 8 (elementary and middle school): 205
Here:
24.7%
Texas:
8.8%
Students in private schools in grades 9 to 12 (high school): 21
Here:
8.6%
Texas:
8.0%
Students in private undergraduate colleges:
Here:
0.0%
Texas:
16.2%
Occupation by median earnings in the past 12 months ($)
96,354Legal occupations
92,931Computer and mathematical occupations
71,693Business and financial operations occupations
67,158Health diagnosing and treating practitioners and other technical occupations
66,850Management occupations
65,211Building and grounds cleaning and maintenance occupations
Top industries in this zip code by the number of employees in 2005:
Administrative and Support and Waste Management and Remediation Services: Janitorial Services (250-499 employees: 1 establishment)
Mining: Construction Sand and Gravel Mining (20-49: 1)
Mining: Lead Ore and Zinc Ore Mining (10-19: 1)
Construction: Power and Communication Line and Related Structures Construction (5-9: 1, 1-4: 1)
Real Estate and Rental and Leasing: Video Tape and Disc Rental (5-9: 1)
Arts, Entertainment, and Recreation: Fitness and Recreational Sports Centers (5-9: 1)
Finance and Insurance: Insurance Agencies and Brokerages (5-9: 1)
Utilities: Water Supply and Irrigation Systems (5-9: 1)
Construction: Electrical Contractors (1-4: 3)
Accommodation and Food Services: Limited-Service Restaurants (1-4: 2)
Fatal accident statistics in 2014:
Fatal accident count: 1
Vehicles involved in fatal accidents: 1
Fatal accidents caused by drunken drivers: 0
Fatalities: 1
Persons involved in fatal accidents: 1
Pedestrians involved in fatal accidents: 0
Fatal accident statistics in 2012:
Fatal accident count: 2
Vehicles involved in fatal accidents: 3
Fatal accidents caused by drunken drivers: 0
Fatalities: 2
Persons involved in fatal accidents: 5
Pedestrians involved in fatal accidents: 0
Home Mortgage Disclosure Act Aggregated Statistics For Year 2009 (Based on 2 partial tracts)
A) FHA, FSA/RHS & VA Home Purchase Loans
B) Conventional Home Purchase Loans
C) Refinancings
D) Home Improvement Loans
F) Non-occupant Loans on < 5 Family Dwellings (A B C & D)
G) Loans On Manufactured Home Dwelling (A B C & D)
Number
Average Value
Number
Average Value
Number
Average Value
Number
Average Value
Number
Average Value
Number
Average Value
LOANS ORIGINATED
24
$115,992
16
$136,872
46
$146,313
9
$19,761
4
$63,868
9
$77,956
APPLICATIONS APPROVED, NOT ACCEPTED
2
$99,850
3
$118,817
10
$98,119
2
$30,520
0
$0
3
$95,203
APPLICATIONS DENIED
4
$85,910
9
$93,698
35
$134,464
12
$48,042
2
$29,390
4
$67,825
APPLICATIONS WITHDRAWN
5
$135,648
2
$93,445
15
$138,964
2
$83,650
2
$172,950
0
$0
FILES CLOSED FOR INCOMPLETENESS
0
$0
1
$31,650
8
$108,895
3
$40,947
0
$0
2
$21,480
Aggregated Statistics For Year 2008 (Based on 2 partial tracts)
A) FHA, FSA/RHS & VA Home Purchase Loans
B) Conventional Home Purchase Loans
C) Refinancings
D) Home Improvement Loans
E) Loans on Dwellings For 5+ Families
F) Non-occupant Loans on < 5 Family Dwellings (A B C & D)
G) Loans On Manufactured Home Dwelling (A B C & D)
Number
Average Value
Number
Average Value
Number
Average Value
Number
Average Value
Number
Average Value
Number
Average Value
Number
Average Value
LOANS ORIGINATED
17
$143,051
27
$126,800
38
$128,905
16
$39,894
1
$122,840
10
$64,885
10
$64,357
APPLICATIONS APPROVED, NOT ACCEPTED
2
$52,000
6
$77,118
8
$75,925
7
$25,407
0
$0
2
$24,490
5
$51,094
APPLICATIONS DENIED
3
$104,750
14
$70,623
37
$118,987
18
$27,758
0
$0
2
$77,620
9
$56,018
APPLICATIONS WITHDRAWN
4
$159,010
4
$116,242
12
$137,532
3
$79,127
0
$0
1
$50,490
3
$68,830
FILES CLOSED FOR INCOMPLETENESS
0
$0
2
$125,100
4
$103,432
2
$15,070
0
$0
1
$58,030
2
$49,740
Aggregated Statistics For Year 2007 (Based on 2 partial tracts)
A) FHA, FSA/RHS & VA Home Purchase Loans
B) Conventional Home Purchase Loans
C) Refinancings
D) Home Improvement Loans
F) Non-occupant Loans on < 5 Family Dwellings (A B C & D)
G) Loans On Manufactured Home Dwelling (A B C & D)
Number
Average Value
Number
Average Value
Number
Average Value
Number
Average Value
Number
Average Value
Number
Average Value
LOANS ORIGINATED
13
$124,170
55
$101,270
57
$127,940
14
$20,563
9
$91,186
13
$72,693
APPLICATIONS APPROVED, NOT ACCEPTED
1
$76,870
12
$98,533
8
$94,011
4
$53,505
2
$163,155
5
$58,328
APPLICATIONS DENIED
2
$104,375
19
$120,100
51
$130,920
23
$40,760
6
$122,335
12
$62,360
APPLICATIONS WITHDRAWN
2
$94,955
8
$101,925
26
$98,461
3
$58,530
2
$56,895
2
$47,475
FILES CLOSED FOR INCOMPLETENESS
2
$49,360
3
$113,543
11
$136,265
1
$15,070
1
$37,680
1
$58,030
Aggregated Statistics For Year 2006 (Based on 2 partial tracts)
A) FHA, FSA/RHS & VA Home Purchase Loans
B) Conventional Home Purchase Loans
C) Refinancings
D) Home Improvement Loans
E) Loans on Dwellings For 5+ Families
F) Non-occupant Loans on < 5 Family Dwellings (A B C & D)
G) Loans On Manufactured Home Dwelling (A B C & D)
Number
Average Value
Number
Average Value
Number
Average Value
Number
Average Value
Number
Average Value
Number
Average Value
Number
Average Value
LOANS ORIGINATED
20
$114,999
76
$98,196
38
$117,443
20
$51,772
2
$938,610
9
$77,704
20
$72,610
APPLICATIONS APPROVED, NOT ACCEPTED
1
$97,970
13
$78,722
8
$120,670
4
$47,288
0
$0
1
$157,500
4
$33,722
APPLICATIONS DENIED
3
$74,857
43
$100,124
64
$122,813
23
$40,432
1
$870,410
7
$97,646
14
$56,897
APPLICATIONS WITHDRAWN
5
$102,640
16
$90,950
41
$121,182
1
$68,580
0
$0
0
$0
5
$57,576
FILES CLOSED FOR INCOMPLETENESS
0
$0
2
$108,520
11
$132,085
1
$75,360
0
$0
0
$0
0
$0
Aggregated Statistics For Year 2005 (Based on 2 partial tracts)
A) FHA, FSA/RHS & VA Home Purchase Loans
B) Conventional Home Purchase Loans
C) Refinancings
D) Home Improvement Loans
F) Non-occupant Loans on < 5 Family Dwellings (A B C & D)
G) Loans On Manufactured Home Dwelling (A B C & D)
Number
Average Value
Number
Average Value
Number
Average Value
Number
Average Value
Number
Average Value
Number
Average Value
LOANS ORIGINATED
23
$107,142
82
$99,154
69
$105,952
16
$62,361
14
$95,599
18
$78,584
APPLICATIONS APPROVED, NOT ACCEPTED
2
$107,010
17
$75,360
9
$170,147
3
$10,300
2
$38,055
7
$78,913
APPLICATIONS DENIED
3
$101,737
22
$95,981
61
$103,120
11
$31,515
8
$97,309
12
$79,253
APPLICATIONS WITHDRAWN
1
$48,980
15
$102,037
35
$141,418
7
$133,494
5
$105,806
4
$68,390
FILES CLOSED FOR INCOMPLETENESS
2
$126,605
3
$98,720
19
$102,727
0
$0
2
$72,345
0
$0
Aggregated Statistics For Year 2004 (Based on 2 partial tracts)
A) FHA, FSA/RHS & VA Home Purchase Loans
B) Conventional Home Purchase Loans
C) Refinancings
D) Home Improvement Loans
E) Loans on Dwellings For 5+ Families
F) Non-occupant Loans on < 5 Family Dwellings (A B C & D)
G) Loans On Manufactured Home Dwelling (A B C & D)
Number
Average Value
Number
Average Value
Number
Average Value
Number
Average Value
Number
Average Value
Number
Average Value
Number
Average Value
LOANS ORIGINATED
16
$99,098
69
$109,436
85
$112,198
16
$38,528
1
$117,560
9
$106,258
23
$79,325
APPLICATIONS APPROVED, NOT ACCEPTED
0
$0
9
$95,540
14
$82,196
1
$3,770
0
$0
1
$75,360
2
$49,740
APPLICATIONS DENIED
4
$81,578
32
$72,722
58
$97,162
19
$37,323
0
$0
3
$80,133
18
$61,460
APPLICATIONS WITHDRAWN
3
$114,547
12
$118,378
30
$106,157
5
$32,856
0
$0
1
$51,240
2
$124,720
FILES CLOSED FOR INCOMPLETENESS
0
$0
2
$43,330
15
$110,980
2
$132,635
0
$0
0
$0
1
$64,060
Aggregated Statistics For Year 2003 (Based on 2 partial tracts)
A) FHA, FSA/RHS & VA Home Purchase Loans
B) Conventional Home Purchase Loans
C) Refinancings
D) Home Improvement Loans
F) Non-occupant Loans on < 5 Family Dwellings (A B C & D)
Number
Average Value
Number
Average Value
Number
Average Value
Number
Average Value
Number
Average Value
LOANS ORIGINATED
20
$110,364
71
$107,765
170
$107,073
15
$38,584
14
$114,009
APPLICATIONS APPROVED, NOT ACCEPTED
2
$89,300
8
$76,208
24
$91,688
2
$26,375
1
$90,430
APPLICATIONS DENIED
6
$93,447
35
$76,673
90
$93,396
16
$28,637
5
$89,678
APPLICATIONS WITHDRAWN
4
$97,780
11
$104,134
51
$105,327
0
$0
2
$45,595
FILES CLOSED FOR INCOMPLETENESS
1
$91,190
2
$142,430
7
$82,896
2
$32,030
0
$0
Aggregated Statistics For Year 2002 (Based on 2 partial tracts)
A) FHA, FSA/RHS & VA Home Purchase Loans
B) Conventional Home Purchase Loans
C) Refinancings
D) Home Improvement Loans
E) Loans on Dwellings For 5+ Families
F) Non-occupant Loans on < 5 Family Dwellings (A B C & D)
Number
Average Value
Number
Average Value
Number
Average Value
Number
Average Value
Number
Average Value
Number
Average Value
LOANS ORIGINATED
21
$110,349
63
$91,568
96
$98,329
10
$31,199
1
$320,280
5
$76,416
APPLICATIONS APPROVED, NOT ACCEPTED
2
$69,710
26
$58,346
27
$80,133
3
$36,423
0
$0
3
$73,600
APPLICATIONS DENIED
3
$80,637
65
$67,256
46
$87,794
14
$31,005
0
$0
4
$67,635
APPLICATIONS WITHDRAWN
2
$87,040
15
$90,985
28
$78,751
0
$0
0
$0
3
$108,267
FILES CLOSED FOR INCOMPLETENESS
0
$0
2
$120,955
7
$98,721
0
$0
0
$0
0
$0
Aggregated Statistics For Year 2001 (Based on 2 partial tracts)
A) FHA, FSA/RHS & VA Home Purchase Loans
B) Conventional Home Purchase Loans
C) Refinancings
D) Home Improvement Loans
E) Loans on Dwellings For 5+ Families
F) Non-occupant Loans on < 5 Family Dwellings (A B C & D)
Number
Average Value
Number
Average Value
Number
Average Value
Number
Average Value
Number
Average Value
Number
Average Value
LOANS ORIGINATED
17
$98,278
72
$79,400
66
$92,213
11
$23,978
0
$0
8
$58,969
APPLICATIONS APPROVED, NOT ACCEPTED
2
$113,040
25
$60,047
13
$71,708
3
$49,487
0
$0
2
$41,825
APPLICATIONS DENIED
2
$48,985
78
$48,800
29
$74,087
10
$11,756
0
$0
4
$39,752
APPLICATIONS WITHDRAWN
2
$89,680
12
$115,050
26
$81,331
8
$11,399
0
$0
0
$0
FILES CLOSED FOR INCOMPLETENESS
1
$57,270
2
$53,880
4
$161,082
0
$0
1
$979,680
0
$0
Aggregated Statistics For Year 2000 (Based on 2 partial tracts)
A) FHA, FSA/RHS & VA Home Purchase Loans
B) Conventional Home Purchase Loans
C) Refinancings
D) Home Improvement Loans
F) Non-occupant Loans on < 5 Family Dwellings (A B C & D)
Number
Average Value
Number
Average Value
Number
Average Value
Number
Average Value
Number
Average Value
LOANS ORIGINATED
12
$83,712
65
$76,879
25
$86,393
20
$16,014
4
$16,202
APPLICATIONS APPROVED, NOT ACCEPTED
2
$64,435
21
$62,764
6
$79,128
9
$17,919
5
$41,750
APPLICATIONS DENIED
5
$70,990
76
$50,253
17
$53,018
19
$18,523
4
$31,275
APPLICATIONS WITHDRAWN
2
$50,115
4
$87,040
11
$76,525
2
$31,275
0
$0
FILES CLOSED FOR INCOMPLETENESS
1
$79,130
5
$69,030
5
$98,270
0
$0
0
$0
Aggregated Statistics For Year 1999 (Based on 1 partial tract)
A) FHA, FSA/RHS & VA Home Purchase Loans
B) Conventional Home Purchase Loans
C) Refinancings
D) Home Improvement Loans
F) Non-occupant Loans on < 5 Family Dwellings (A B C & D)
Detailed PMIC statistics for the following Tracts:0512.00
2002 - 2018 National Fire Incident Reporting System (NFIRS) incidents
According to the data from the years 2002 - 2018 the average number of fire incidents per year is 47. The highest number of fire incidents - 111 took place in 2008, and the least - 7 in 2014. The data has a rising trend.
When looking into fire subcategories, the most reports belonged to: Outside Fires (61.2%), and Structure Fires (30.8%).
Fire incident types reported to NFIRS in Zip Code 75158

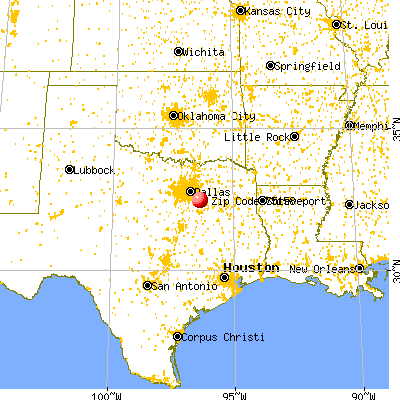


 Nearest zip codes: 75157, 75114, 75142, 75143, 75159, 75105.


 According to the data from the years 2002 - 2018 the average number of fire incidents per year is 47. The highest number of fire incidents - 111 took place in 2008, and the least - 7 in 2014. The data has a rising trend.
 When looking into fire subcategories, the most reports belonged to: Outside Fires (61.2%), and Structure Fires (30.8%).