Estimated zip code population in 2022: 3,135 Zip code population in 2010: 2,773 Zip code population in 2000: 2,427
Houses and condos: 1,383 Renter-occupied apartments: 257
% of renters here:
21%
State:
38%
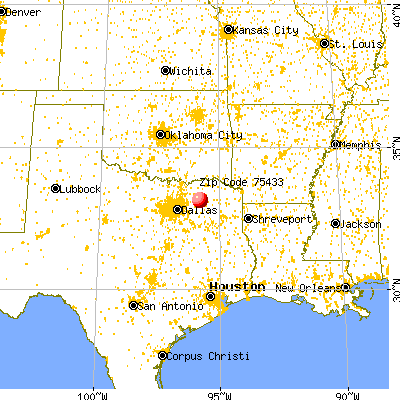
March 2022 cost of living index in zip code 75433: 78.7 (low, U.S. average is 100)
Land area: 104.1 sq. mi. Water area: 1.1 sq. mi.
Population density: 30 people per square mile
(very low).
OSM Map
General Map
Google Map
MSN Map
OSM Map
General Map
Google Map
MSN Map
OSM Map
General Map
Google Map
MSN Map
OSM Map
General Map
Google Map
MSN Map
Please wait while loading the map...
Real estate property taxes paid for housing units in 2022:
This zip code:
0.9% ($1,526)
Texas:
1.5% ($4,050)
Median real estate property taxes paid for housing units with mortgages in 2022: $1,631 (1.1%) Median real estate property taxes paid for housing units with no mortgage in 2022: $1,507 (0.8%)
Business Search- 14 Million verified businesses
Males: 1,468
(46.9%)
Females: 1,666
(53.1%)
For population 25 years and over in 75433:
High school or higher: 91.3%
Bachelor's degree or higher: 27.9%
Graduate or professional degree: 7.1%
Unemployed: 3.5%
Mean travel time to work (commute): 33.2 minutes
For population 15 years and over in 75433:
Never married: 16.1%
Now married: 60.2%
Separated: 1.5%
Widowed: 10.9%
Divorced: 11.3%
Zip code 75433 compared to state average:
Median house value below state average.
Black race population percentage significantly below state average.
Hispanic race population percentage significantly below state average.
Median age significantly above state average.
Foreign-born population percentage significantly below state average.
Renting percentage below state average.
Length of stay since moving in significantly above state average.
Averages for the 2020 tax year for zip code 75433, filed in 2021:
Average Adjusted Gross Income (AGI) in 2020: $53,227 (Individual Income Tax Returns)
Here:
$53,227
State:
$77,054
Salary/wage: $52,929 (reported on 75.8% of returns)
Here:
$52,929
State:
$62,766
(% of AGI for various income ranges: 1209.4% for AGIs below $25k, 3323.6% for AGIs $25k-50k, 6289.4% for AGIs $50k-75k, 10630.0% for AGIs $75k-100k, 17219.1% for AGIs $100k-200k)
Taxable interest for individuals: $697 (reported on 24.2% of returns)
This zip code:
$697
Texas:
$2,665
(% of AGI for various income ranges: 8.4% for AGIs below $25k, 19.5% for AGIs $25k-50k, 20.6% for AGIs $50k-75k, 54.4% for AGIs $75k-100k, 51.8% for AGIs $100k-200k)
Ordinary dividends: $633 (reported on 36.3% of returns)
Here:
$633
State:
$10,044
(% of AGI for various income ranges: 9.7% for AGIs below $25k, 12.3% for AGIs $25k-50k, 40.6% for AGIs $50k-75k, 101.1% for AGIs $75k-100k, 64.5% for AGIs $100k-200k)
Net capital gain/loss in AGI: +$6,387 (reported on 12.1% of returns)
Here:
+$6,387
State:
+$39,590
(% of AGI for various income ranges: 5.9% for AGIs below $25k, 35.5% for AGIs $25k-50k, 59.4% for AGIs $50k-75k, 64.4% for AGIs $75k-100k, 643.6% for AGIs $100k-200k)
Profit/loss from business: +$9,344 (reported on 20.2% of returns)
Here:
+$9,344
State:
+$10,888
(% of AGI for various income ranges: 258.8% for AGIs below $25k, 238.2% for AGIs $25k-50k, 169.4% for AGIs $50k-75k, 113.3% for AGIs $75k-100k, 555.5% for AGIs $100k-200k)
Taxable individual retirement arrangement distribution: $14,836 (reported on 8.9% of returns)
75433:
$14,836
Texas:
$24,740
(% of AGI for various income ranges: 61.3% for AGIs below $25k, 139.1% for AGIs $25k-50k, 365.0% for AGIs $50k-75k, 496.4% for AGIs $100k-200k)
Total itemized deductions: $33,550 (reported on 3.2% of returns)
Here:
$33,550
State:
$40,428
(% of AGI for various income ranges: 1491.1% for AGIs $75k-100k)
Charity contributions: $10,433 (reported on 2.4% of returns)
Here:
$10,433
State:
$18,201
(% of AGI for various income ranges: 347.8% for AGIs $75k-100k)
Taxes paid: $5,325 (reported on 3.2% of returns)
75433:
$5,325
State:
$7,821
(% of AGI for various income ranges: 236.7% for AGIs $75k-100k)
Earned income credit: $2,417 (reported on 18.5% of returns)
Here:
$2,417
State:
$2,584
(% of AGI for various income ranges: 120.3% for AGIs below $25k, 77.7% for AGIs $25k-50k)
Percentage of individuals using paid preparers for their 2020 taxes: 95.2%
Here:
95%
State:
92%
(% for various income ranges: 93.3% for AGIs below $25k, 96.3% for AGIs $25k-50k, 95.2% for AGIs $50k-75k, 100.0% for AGIs $75k-100k, 94.4% for AGIs $100k-200k)
Averages for the 2012 tax year for zip code 75433, filed in 2013:
Average Adjusted Gross Income (AGI) in 2012: $42,889 (Individual Income Tax Returns)
Here:
$42,889
State:
$65,384
Salary/wage: $40,709 (reported on 80.0% of returns)
Here:
$40,709
State:
$52,524
(% of AGI for various income ranges: 75.2% for AGIs below $25k, 77.5% for AGIs $25k-50k, 75.5% for AGIs $50k-75k, 79.2% for AGIs $75k-100k, 73.0% for AGIs $100k-200k)
Taxable interest for individuals: $1,248 (reported on 28.2% of returns)
This zip code:
$1,248
Texas:
$2,372
(% of AGI for various income ranges: 0.9% for AGIs below $25k, 1.4% for AGIs $25k-50k, 1.5% for AGIs $50k-75k, 0.1% for AGIs $75k-100k, 0.1% for AGIs $100k-200k)
Ordinary dividends: $915 (reported on 37.3% of returns)
Here:
$915
State:
$9,721
(% of AGI for various income ranges: 1.1% for AGIs below $25k, 0.7% for AGIs $25k-50k, 1.5% for AGIs $50k-75k, 0.5% for AGIs $75k-100k, 0.4% for AGIs $100k-200k)
Net capital gain/loss in AGI: +$1,717 (reported on 10.9% of returns)
Here:
+$1,717
State:
+$35,319
(% of AGI for various income ranges: 0.6% for AGIs $25k-50k, 1.2% for AGIs $50k-75k, 0.2% for AGIs $75k-100k)
Profit/loss from business: +$7,577 (reported on 20.0% of returns)
Here:
+$7,577
State:
+$13,732
(% of AGI for various income ranges: 13.7% for AGIs below $25k, 4.2% for AGIs $25k-50k, 2.4% for AGIs $50k-75k, 2.5% for AGIs $75k-100k)
Taxable individual retirement arrangement distribution: $15,000 (reported on 9.1% of returns)
75433:
$15,000
Texas:
$19,511
(% of AGI for various income ranges: 2.0% for AGIs below $25k, 2.7% for AGIs $25k-50k, 2.7% for AGIs $50k-75k, 9.6% for AGIs $75k-100k)
Total itemized deductions: $18,089 (24% of AGI, reported on 16.4% of returns)
Here:
$18,089
State:
$24,724
Here:
24.1% of AGI
State:
15.9% of AGI
(% of AGI for various income ranges: 6.2% for AGIs below $25k, 5.5% for AGIs $25k-50k, 5.7% for AGIs $50k-75k, 8.1% for AGIs $75k-100k, 8.7% for AGIs $100k-200k)
Charity contributions: $4,783 (reported on 10.9% of returns)
Here:
$4,783
State:
$6,808
(% of AGI for various income ranges: 1.2% for AGIs $25k-50k, 0.7% for AGIs $50k-75k, 1.5% for AGIs $75k-100k, 2.1% for AGIs $100k-200k)
Taxes paid: $3,565 (reported on 15.5% of returns)
75433:
$3,565
State:
$6,921
(% of AGI for various income ranges: 1.2% for AGIs $25k-50k, 0.9% for AGIs $50k-75k, 1.5% for AGIs $75k-100k, 2.2% for AGIs $100k-200k)
Earned income credit: $2,417 (reported on 21.8% of returns)
Here:
$2,417
State:
$2,570
(% of AGI for various income ranges: 8.2% for AGIs below $25k, 1.2% for AGIs $25k-50k)
Percentage of individuals using paid preparers for their 2012 taxes: 56.4%
Here:
56%
State:
51%
(% for various income ranges: 53.3% for AGIs below $25k, 57.1% for AGIs $25k-50k, 66.7% for AGIs $50k-75k, 50.0% for AGIs $75k-100k, 55.6% for AGIs $100k-200k)
Averages for the 2004 tax year for zip code 75433, filed in 2005:
Average Adjusted Gross Income (AGI) in 2004: $34,281 (Individual Income Tax Returns)
Here:
$34,281
State:
$47,881
Salary/wage: $34,678 (reported on 83.9% of returns)
Here:
$34,678
State:
$41,947
(% of AGI for various income ranges: 421.2% for AGIs below $10k, 80.8% for AGIs $10k-25k, 84.2% for AGIs $25k-50k, 87.5% for AGIs $50k-75k, 84.2% for AGIs $75k-100k, 71.4% for AGIs over 100k)
Taxable interest for individuals: $1,482 (reported on 33.1% of returns)
This zip code:
$1,482
Texas:
$2,255
(% of AGI for various income ranges: 13.7% for AGIs below $10k, 2.7% for AGIs $10k-25k, 1.2% for AGIs $25k-50k, 1.7% for AGIs $50k-75k, 0.3% for AGIs $75k-100k, 0.9% for AGIs over 100k)
Taxable dividends: $1,112 (reported on 13.0% of returns)
Here:
$1,112
State:
$4,261
(% of AGI for various income ranges: 3.5% for AGIs below $10k, 0.7% for AGIs $10k-25k, 0.5% for AGIs $25k-50k, 0.4% for AGIs $50k-75k, 0.2% for AGIs $75k-100k, 0.2% for AGIs over 100k)
Net capital gain/loss: +$3,230 (reported on 12.3% of returns)
Here:
+$3,230
State:
+$16,110
(% of AGI for various income ranges: 7.1% for AGIs below $10k, 2.1% for AGIs $10k-25k, 0.8% for AGIs $25k-50k, 0.3% for AGIs $50k-75k, 0.2% for AGIs $75k-100k, 3.4% for AGIs over 100k)
Profit/loss from business: +$4,611 (reported on 17.5% of returns)
Here:
+$4,611
State:
+$11,013
(% of AGI for various income ranges: -51.8% for AGIs below $10k, 6.0% for AGIs $10k-25k, 4.8% for AGIs $25k-50k, 0.3% for AGIs $50k-75k, 2.2% for AGIs $75k-100k)
Total itemized deductions: $15,490 (24% of AGI, reported on 14.3% of returns)
Here:
$15,490
State:
$19,631
Here:
24.0% of AGI
State:
18.9% of AGI
(% of AGI for various income ranges: 5.6% for AGIs $10k-25k, 5.2% for AGIs $25k-50k, 8.3% for AGIs $50k-75k, 7.1% for AGIs $75k-100k, 6.2% for AGIs over 100k)
Charity contributions deductions: $3,734 (6% of AGI, reported on 10.6% of returns)
Here:
$3,734
State:
$4,753
Here:
5.5% of AGI
State:
4.2% of AGI
(% of AGI for various income ranges: 0.7% for AGIs $10k-25k, 0.6% for AGIs $25k-50k, 1.7% for AGIs $50k-75k, 1.4% for AGIs $75k-100k, 1.6% for AGIs over 100k)
Total tax: $4,310 (reported on 71.0% of returns)
75433:
$4,310
State:
$9,058
(% of AGI for various income ranges: 14.2% for AGIs below $10k, 3.8% for AGIs $10k-25k, 5.9% for AGIs $25k-50k, 9.1% for AGIs $50k-75k, 11.6% for AGIs $75k-100k, 16.5% for AGIs over 100k)
Earned income credit: $1,944 (reported on 21.0% of returns)
Here:
$1,944
State:
$2,024
Percentage of individuals using paid preparers for their 2004 taxes: 66.4%
Here:
66%
State:
57%
(% for various income ranges: 63.5% for AGIs below $10k, 68.2% for AGIs $10k-25k, 66.9% for AGIs $25k-50k, 60.4% for AGIs $50k-75k, 75.0% for AGIs $75k-100k, 75.0% for AGIs over 100k)
Household received Food Stamps/SNAP in the past 12 months: 109 Household did not receive Food Stamps/SNAP in the past 12 months: 1,133
Women who had a birth in the past 12 months: 31 (31 now married, 0 unmarried) Women who did not have a birth in the past 12 months: 567 (346 now married, 217 unmarried)
Housing units in zip code 75433 with a mortgage: 375 (3 second mortgage, 4 both second mortgage and home equity loan) Median monthly owner costs for units with a mortgage: $1,250 Median monthly owner costs for units without a mortgage: $540
Residents with income below the poverty level in 2022:
This zip code:
10.0%
Whole state:
14.0%
Residents with income below 50% of the poverty level in 2022:
This zip code:
6.6%
Whole state:
7.4%
Median number of rooms in houses and condos:
Here:
5.6
State:
6.3
Median number of rooms in apartments:
Here:
5.5
State:
4.0
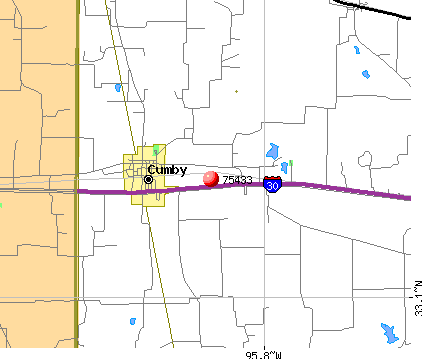
Notable locations in this zip code not listed on our city pages
Notable locations in zip code 75433: Center Point (A), Cumby Volunteer Fire Department - First Responders (B), Miller Grove Volunteer Fire Department (C). Display/hide their locations on the map
Cemeteries: Montgomery Cemetery (1), Long Cemetery (2), Proctor Cemetery (3), Stewart Cemetery (4), Sunny Point Cemetery (5), Pleasant Grove Cemetery (6), Jordan Cemetery (7). Display/hide their locations on the map
Lakes and reservoirs: Burns Lake (A), Soil Conservation Service Site 14 Reservoir (B), Soil Conservation Service Site 13 Reservoir (C), Soil Conservation Service Site 22 Reservoir (D), Soil Conservation Service Site 23 Reservoir (E), Soil Conservation Service Site 12 Reservoir (F), James R Beck Lake (G), Soil Conservation Service Site 16b Reservoir (H). Display/hide their locations on the map
Streams, rivers, and creeks: Webb Creek (A), Schooley Creek (B), Moss Wash Branch (C), Middle Fork Turkey Creek (D), East Fork Turkey Creek (E), West Fork Turkey Creek (F), Slough Creek (G), Hughes Creek (H), Crooks Creek (I). Display/hide their locations on the map
Size of family households: 435 2-persons, 215 3-persons, 136 4-persons, 47 5-persons, 25 6-persons, 35 7-or-more-persons
Size of nonfamily households: 322 1-person, 29 2-persons
433 married couples with children.
138 single-parent households (67 men, 71 women).
93.2% of residents of 75433 zip code speak English at home.
6.0% of residents speak Spanish at home (56% very well, 29% well, 15% not well).
0.9% of residents speak other Indo-European language at home (100% very well).
Foreign born population: 149 (4.8%) (50.9% of them are naturalized citizens)
This zip code:
4.8%
Whole state:
17.2%
55%Honduras
7%France
7%Belgium
6%United Kingdom, excluding England and Scotland
6%Germany
6%Barbados
5%Sweden
27%American
11%English
9%Irish
9%German
3%Dutch
2%European
2%Italian
Year of entry for the foreign-born population
382010 or later
262000 to 2009
301990 to 1999
56Before 1990
Housing units lacking complete plumbing facilities: 4.7% Housing units lacking complete kitchen facilities: 3.9%
69.8%Electricity
14.6%Utility gas
11.3%Bottled, tank, or LP gas
3.4%Wood
0.5%Fuel oil, kerosene, etc.
Population in 1990: 2,894.
Place of birth for U.S.-born residents:
This state: 2,270
Northeast: 72
Midwest: 244
South: 212
West: 166
57% of the 75433 zip code residents lived in the same house 5 years ago. Out of people who lived in different houses, 35% lived in this county. Out of people who lived in different counties, 50% lived in Texas.
92% of the 75433 zip code residents lived in the same house 1 year ago. Out of people who lived in different houses, 38% moved from this county. Out of people who lived in different houses, 60% moved from different county within same state. Out of people who lived in different houses, 2% moved from different state.
Private vs. public school enrollment:
Students in private schools in grades 1 to 8 (elementary and middle school): 78
Here:
26.5%
Texas:
8.8%
Students in private schools in grades 9 to 12 (high school): 35
Here:
20.0%
Texas:
8.0%
Students in private undergraduate colleges: 8
Here:
15.1%
Texas:
16.2%
Occupation by median earnings in the past 12 months ($)
93,899Community and social service occupations
76,084Installation, maintenance, and repair occupations
65,718Arts, design, entertainment, sports, and media occupations
64,279Business and financial operations occupations
58,836Health diagnosing and treating practitioners and other technical occupations
58,463Architecture and engineering occupations
Top industries in this zip code by the number of employees in 2005:
Wholesale Trade: Grain and Field Bean Merchant Wholesalers (20-49 employees: 1 establishment)
Construction: All Other Specialty Trade Contractors (10-19: 1)
Other Services (except Public Administration): Funeral Homes and Funeral Services (1-4: 1)
Fatal accident statistics in 2014:
Fatal accident count: 1
Vehicles involved in fatal accidents: 1
Fatal accidents caused by drunken drivers: 0
Fatalities: 1
Persons involved in fatal accidents: 2
Pedestrians involved in fatal accidents: 0
Fatal accident statistics in 2013:
Fatal accident count: 1
Vehicles involved in fatal accidents: 1
Fatal accidents caused by drunken drivers: 0
Fatalities: 1
Persons involved in fatal accidents: 1
Pedestrians involved in fatal accidents: 0
2002 - 2018 National Fire Incident Reporting System (NFIRS) incidents
Based on the data from the years 2002 - 2018 the average number of fire incidents per year is 34. The highest number of reported fires - 75 took place in 2011, and the least - 5 in 2007. The data has a rising trend.
When looking into fire subcategories, the most reports belonged to: Outside Fires (72.9%), and Structure Fires (13.6%).
Fire incident types reported to NFIRS in Zip Code 75433


 Nearest zip codes: 75420, 75422, 75453, 75482, 75428, 75448.


 Based on the data from the years 2002 - 2018 the average number of fire incidents per year is 34. The highest number of reported fires - 75 took place in 2011, and the least - 5 in 2007. The data has a rising trend.
 When looking into fire subcategories, the most reports belonged to: Outside Fires (72.9%), and Structure Fires (13.6%).