Estimated zip code population in 2022: 17,704 Zip code population in 2010: 5,699 Zip code population in 2000: 2,393
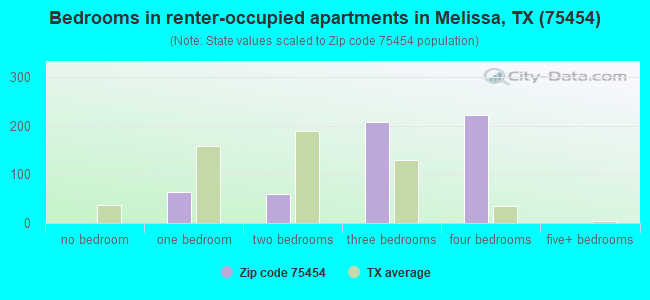
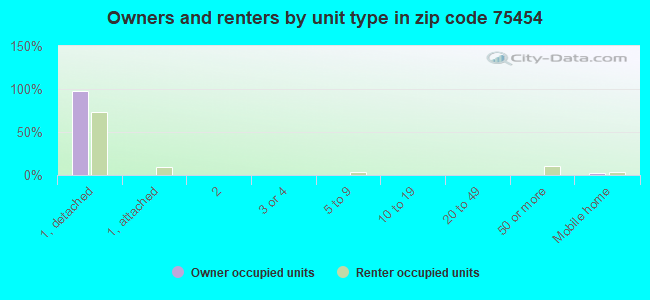
Houses and condos: 5,871 Renter-occupied apartments: 554
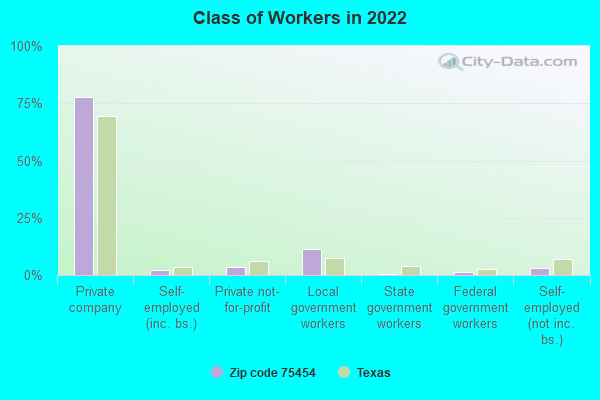
% of renters here:
10%
State:
38%
March 2022 cost of living index in zip code 75454: 96.9 (near average, U.S. average is 100)
Land area: 19.2 sq. mi. Water area: 0.2 sq. mi.
Population density: 923 people per square mile
(low).
OSM Map
General Map
Google Map
MSN Map
OSM Map
General Map
Google Map
MSN Map
OSM Map
General Map
Google Map
MSN Map
OSM Map
General Map
Google Map
MSN Map
Please wait while loading the map...
Real estate property taxes paid for housing units in 2022:
This zip code:
1.6% ($6,958)
Texas:
1.5% ($4,050)
Median real estate property taxes paid for housing units with mortgages in 2022: $7,135 (1.6%) Median real estate property taxes paid for housing units with no mortgage in 2022: $5,937 (1.6%)
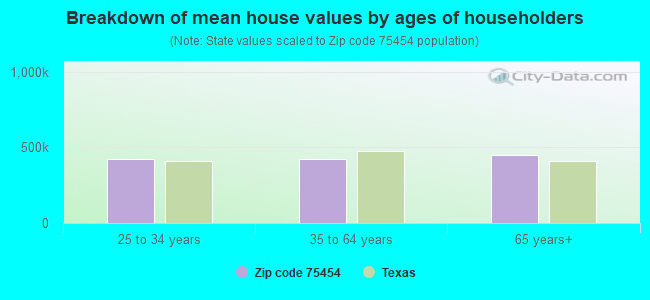
Estimated median house/condo value in 2022: $426,060
75454:
$426,060
Texas:
$275,400
According to our research of Texas and other state lists, there were 9 registered sex offenders living in 75454 zip code as of May 17, 2024. The ratio of all residents to sex offenders in zip code 75454 is 916 to 1. The ratio of registered sex offenders to all residents in this zip code is lower than the state average.
Median resident age:
This zip code:
34.9 years
Texas median age:
35.6 years
Average household size:
This zip code:
3.1 people
Texas:
2.6 people
Averages for the 2020 tax year for zip code 75454, filed in 2021:
Average Adjusted Gross Income (AGI) in 2020: $91,274 (Individual Income Tax Returns)
Here:
$91,274
State:
$77,054
Salary/wage: $84,110 (reported on 88.5% of returns)
Here:
$84,110
State:
$62,766
(% of AGI for various income ranges: 1109.0% for AGIs below $25k, 3812.4% for AGIs $25k-50k, 6599.0% for AGIs $50k-75k, 9914.4% for AGIs $75k-100k, 18509.3% for AGIs $100k-200k, 58692.2% for AGIs over 200k)
Taxable interest for individuals: $956 (reported on 24.6% of returns)
This zip code:
$956
Texas:
$2,665
(% of AGI for various income ranges: 8.6% for AGIs below $25k, 18.3% for AGIs $25k-50k, 24.3% for AGIs $50k-75k, 27.2% for AGIs $75k-100k, 36.2% for AGIs $100k-200k, 264.3% for AGIs over 200k)
Ordinary dividends: $3,878 (reported on 15.9% of returns)
Here:
$3,878
State:
$10,044
(% of AGI for various income ranges: 22.3% for AGIs below $25k, 20.5% for AGIs $25k-50k, 31.2% for AGIs $50k-75k, 42.7% for AGIs $75k-100k, 78.0% for AGIs $100k-200k, 1108.3% for AGIs over 200k)
Net capital gain/loss in AGI: +$16,438 (reported on 17.0% of returns)
Here:
+$16,438
State:
+$39,590
(% of AGI for various income ranges: 8.8% for AGIs below $25k, 16.0% for AGIs $25k-50k, 58.3% for AGIs $50k-75k, 85.2% for AGIs $75k-100k, 250.4% for AGIs $100k-200k, 7142.2% for AGIs over 200k)
Profit/loss from business: +$9,214 (reported on 22.9% of returns)
Here:
+$9,214
State:
+$10,888
(% of AGI for various income ranges: 139.5% for AGIs below $25k, 132.2% for AGIs $25k-50k, 201.7% for AGIs $50k-75k, 227.7% for AGIs $75k-100k, 511.4% for AGIs $100k-200k, 1152.2% for AGIs over 200k)
Taxable individual retirement arrangement distribution: $23,038 (reported on 6.2% of returns)
75454:
$23,038
Texas:
$24,740
(% of AGI for various income ranges: 37.3% for AGIs below $25k, 85.8% for AGIs $25k-50k, 144.3% for AGIs $50k-75k, 200.4% for AGIs $75k-100k, 301.2% for AGIs $100k-200k, 1219.6% for AGIs over 200k)
Total itemized deductions: $34,004 (reported on 14.8% of returns)
Here:
$34,004
State:
$40,428
(% of AGI for various income ranges: 66.6% for AGIs below $25k, 237.3% for AGIs $25k-50k, 465.4% for AGIs $50k-75k, 660.1% for AGIs $75k-100k, 1012.9% for AGIs $100k-200k, 5475.2% for AGIs over 200k)
Charity contributions: $13,123 (reported on 12.4% of returns)
Here:
$13,123
State:
$18,201
(% of AGI for various income ranges: 4.9% for AGIs below $25k, 42.4% for AGIs $25k-50k, 80.1% for AGIs $50k-75k, 130.7% for AGIs $75k-100k, 286.7% for AGIs $100k-200k, 2763.0% for AGIs over 200k)
Taxes paid: $7,940 (reported on 14.7% of returns)
75454:
$7,940
State:
$7,821
(% of AGI for various income ranges: 17.4% for AGIs below $25k, 50.9% for AGIs $25k-50k, 118.0% for AGIs $50k-75k, 174.4% for AGIs $75k-100k, 267.3% for AGIs $100k-200k, 973.0% for AGIs over 200k)
Earned income credit: $2,311 (reported on 9.2% of returns)
Here:
$2,311
State:
$2,584
(% of AGI for various income ranges: 73.8% for AGIs below $25k, 71.5% for AGIs $25k-50k, 1.2% for AGIs $50k-75k)
Percentage of individuals using paid preparers for their 2020 taxes: 94.2%
Here:
94%
State:
92%
(% for various income ranges: 92.3% for AGIs below $25k, 94.2% for AGIs $25k-50k, 95.2% for AGIs $50k-75k, 94.7% for AGIs $75k-100k, 94.9% for AGIs $100k-200k, 94.6% for AGIs over 200k)
Averages for the 2012 tax year for zip code 75454, filed in 2013:
Average Adjusted Gross Income (AGI) in 2012: $78,877 (Individual Income Tax Returns)
Here:
$78,877
State:
$65,384
Salary/wage: $72,021 (reported on 89.3% of returns)
Here:
$72,021
State:
$52,524
(% of AGI for various income ranges: 78.1% for AGIs below $25k, 83.9% for AGIs $25k-50k, 84.8% for AGIs $50k-75k, 87.3% for AGIs $75k-100k, 83.3% for AGIs $100k-200k, 74.8% for AGIs over 200k)
Taxable interest for individuals: $1,113 (reported on 29.5% of returns)
This zip code:
$1,113
Texas:
$2,372
(% of AGI for various income ranges: 1.0% for AGIs below $25k, 0.8% for AGIs $25k-50k, 0.2% for AGIs $50k-75k, 0.3% for AGIs $75k-100k, 0.2% for AGIs $100k-200k, 0.5% for AGIs over 200k)
Ordinary dividends: $2,535 (reported on 16.6% of returns)
Here:
$2,535
State:
$9,721
(% of AGI for various income ranges: 0.8% for AGIs below $25k, 1.1% for AGIs $25k-50k, 0.3% for AGIs $50k-75k, 0.2% for AGIs $75k-100k, 0.4% for AGIs $100k-200k, 0.6% for AGIs over 200k)
Net capital gain/loss in AGI: +$7,200 (reported on 14.0% of returns)
Here:
+$7,200
State:
+$35,319
(% of AGI for various income ranges: 0.8% for AGIs $100k-200k, 3.7% for AGIs over 200k)
Profit/loss from business: +$14,336 (reported on 20.8% of returns)
Here:
+$14,336
State:
+$13,732
(% of AGI for various income ranges: 9.3% for AGIs below $25k, 3.8% for AGIs $25k-50k, 4.7% for AGIs $50k-75k, 1.6% for AGIs $75k-100k, 4.1% for AGIs $100k-200k, 3.5% for AGIs over 200k)
Taxable individual retirement arrangement distribution: $18,544 (reported on 8.1% of returns)
75454:
$18,544
Texas:
$19,511
(% of AGI for various income ranges: 2.3% for AGIs below $25k, 2.2% for AGIs $25k-50k, 1.3% for AGIs $50k-75k, 2.6% for AGIs $75k-100k, 3.5% for AGIs $100k-200k)
Total itemized deductions: $22,396 (17% of AGI, reported on 42.9% of returns)
Here:
$22,396
State:
$24,724
Here:
17.5% of AGI
State:
15.9% of AGI
(% of AGI for various income ranges: 14.0% for AGIs below $25k, 12.5% for AGIs $25k-50k, 13.8% for AGIs $50k-75k, 14.6% for AGIs $75k-100k, 14.7% for AGIs $100k-200k, 7.1% for AGIs over 200k)
Charity contributions: $5,104 (reported on 33.8% of returns)
Here:
$5,104
State:
$6,808
(% of AGI for various income ranges: 1.3% for AGIs below $25k, 1.3% for AGIs $25k-50k, 2.0% for AGIs $50k-75k, 2.1% for AGIs $75k-100k, 2.7% for AGIs $100k-200k, 2.2% for AGIs over 200k)
Taxes paid: $6,377 (reported on 41.6% of returns)
75454:
$6,377
State:
$6,921
(% of AGI for various income ranges: 2.3% for AGIs below $25k, 2.9% for AGIs $25k-50k, 3.5% for AGIs $50k-75k, 4.1% for AGIs $75k-100k, 4.5% for AGIs $100k-200k, 2.1% for AGIs over 200k)
Earned income credit: $2,221 (reported on 14.0% of returns)
Here:
$2,221
State:
$2,570
(% of AGI for various income ranges: 6.5% for AGIs below $25k, 1.3% for AGIs $25k-50k)
Percentage of individuals using paid preparers for their 2012 taxes: 43.2%
Here:
43%
State:
51%
(% for various income ranges: 42.4% for AGIs below $25k, 41.3% for AGIs $25k-50k, 39.2% for AGIs $50k-75k, 37.2% for AGIs $75k-100k, 50.9% for AGIs $100k-200k, 61.5% for AGIs over 200k)
Averages for the 2004 tax year for zip code 75454, filed in 2005:
Average Adjusted Gross Income (AGI) in 2004: $62,834 (Individual Income Tax Returns)
Here:
$62,834
State:
$47,881
Salary/wage: $56,767 (reported on 87.3% of returns)
Here:
$56,767
State:
$41,947
(% of AGI for various income ranges: 128.5% for AGIs below $10k, 78.7% for AGIs $10k-25k, 86.0% for AGIs $25k-50k, 84.4% for AGIs $50k-75k, 82.8% for AGIs $75k-100k, 73.4% for AGIs over 100k)
Taxable interest for individuals: $2,080 (reported on 39.9% of returns)
This zip code:
$2,080
Texas:
$2,255
(% of AGI for various income ranges: 4.1% for AGIs below $10k, 1.5% for AGIs $10k-25k, 1.7% for AGIs $25k-50k, 0.7% for AGIs $50k-75k, 0.4% for AGIs $75k-100k, 1.6% for AGIs over 100k)
Taxable dividends: $1,840 (reported on 22.5% of returns)
Here:
$1,840
State:
$4,261
(% of AGI for various income ranges: 1.8% for AGIs below $10k, 0.5% for AGIs $10k-25k, 0.3% for AGIs $25k-50k, 0.5% for AGIs $50k-75k, 0.4% for AGIs $75k-100k, 0.9% for AGIs over 100k)
Net capital gain/loss: +$12,542 (reported on 18.2% of returns)
Here:
+$12,542
State:
+$16,110
(% of AGI for various income ranges: 2.5% for AGIs below $10k, -0.2% for AGIs $10k-25k, 0.1% for AGIs $25k-50k, 0.2% for AGIs $50k-75k, 0.3% for AGIs $75k-100k, 6.9% for AGIs over 100k)
Profit/loss from business: +$9,230 (reported on 21.1% of returns)
Here:
+$9,230
State:
+$11,013
(% of AGI for various income ranges: 4.4% for AGIs below $10k, 10.4% for AGIs $10k-25k, 4.4% for AGIs $25k-50k, 2.9% for AGIs $50k-75k, 4.1% for AGIs $75k-100k, 1.9% for AGIs over 100k)
IRA payment deduction: $3,000 (reported on 1.9% of returns)
75454:
$3,000
Texas:
$3,120
Total itemized deductions: $22,261 (21% of AGI, reported on 39.7% of returns)
Here:
$22,261
State:
$19,631
Here:
20.6% of AGI
State:
18.9% of AGI
(% of AGI for various income ranges: 12.6% for AGIs $10k-25k, 13.2% for AGIs $25k-50k, 14.0% for AGIs $50k-75k, 16.1% for AGIs $75k-100k, 14.2% for AGIs over 100k)
Charity contributions deductions: $5,667 (5% of AGI, reported on 32.3% of returns)
Here:
$5,667
State:
$4,753
Here:
4.9% of AGI
State:
4.2% of AGI
(% of AGI for various income ranges: 0.9% for AGIs $10k-25k, 1.8% for AGIs $25k-50k, 1.6% for AGIs $50k-75k, 2.3% for AGIs $75k-100k, 4.0% for AGIs over 100k)
Total tax: $10,759 (reported on 79.8% of returns)
75454:
$10,759
State:
$9,058
(% of AGI for various income ranges: 4.4% for AGIs below $10k, 4.6% for AGIs $10k-25k, 6.9% for AGIs $25k-50k, 8.4% for AGIs $50k-75k, 10.7% for AGIs $75k-100k, 18.9% for AGIs over 100k)
Earned income credit: $1,909 (reported on 13.6% of returns)
Here:
$1,909
State:
$2,024
Percentage of individuals using paid preparers for their 2004 taxes: 52.0%
Here:
52%
State:
57%
(% for various income ranges: 43.6% for AGIs below $10k, 57.0% for AGIs $10k-25k, 50.9% for AGIs $25k-50k, 51.3% for AGIs $50k-75k, 53.4% for AGIs $75k-100k, 56.2% for AGIs over 100k)
Household received Food Stamps/SNAP in the past 12 months: 132 Household did not receive Food Stamps/SNAP in the past 12 months: 5,570
Women who had a birth in the past 12 months: 168 (171 now married, 0 unmarried) Women who did not have a birth in the past 12 months: 4,823 (3,121 now married, 1,670 unmarried)
Housing units in zip code 75454 with a mortgage: 4,206 (139 second mortgage, 130 both second mortgage and home equity loan) Median monthly owner costs for units with a mortgage: $2,497 Median monthly owner costs for units without a mortgage: $981
Residents with income below the poverty level in 2022:
This zip code:
2.8%
Whole state:
14.0%
Residents with income below 50% of the poverty level in 2022:
This zip code:
1.3%
Whole state:
7.4%
Median number of rooms in houses and condos:
Here:
7.5
State:
6.3
Median number of rooms in apartments:
Here:
6.4
State:
4.0
Notable locations in this zip code not listed on our city pages
Size of family households: 1,178 2-persons, 1,717 3-persons, 1,350 4-persons, 604 5-persons, 192 6-persons
Size of nonfamily households: 515 1-person, 95 2-persons
4,641 married couples with children.
764 single-parent households (247 men, 517 women).
81.1% of residents of 75454 zip code speak English at home.
9.2% of residents speak Spanish at home (81% very well, 11% well, 7% not well, 1% not at all).
4.3% of residents speak other Indo-European language at home (100% very well).
2.7% of residents speak Asian or Pacific Island language at home (71% very well, 29% well).
2.6% of residents speak other language at home (60% very well, 40% well).
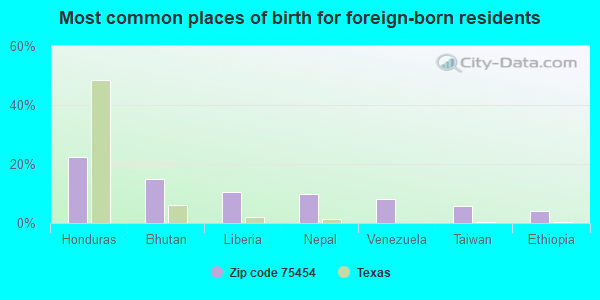
Foreign born population: 2,089 (11.8%) (55.1% of them are naturalized citizens)
This zip code:
11.8%
Whole state:
17.2%
22%Honduras
15%Bhutan
11%Liberia
10%Nepal
8%Venezuela
6%Taiwan
4%Ethiopia
19%American
15%English
6%Irish
6%German
5%Nigerian
3%European
3%Italian
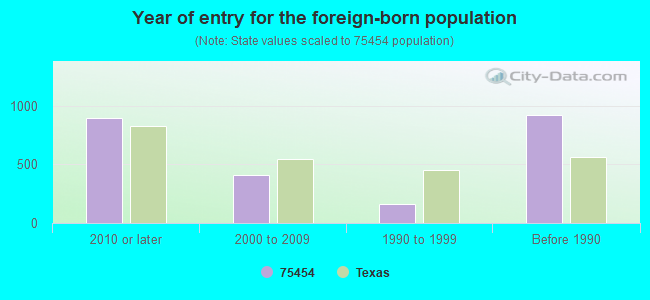
Year of entry for the foreign-born population
8952010 or later
4062000 to 2009
1611990 to 1999
920Before 1990
Housing units lacking complete plumbing facilities: 1.1% Housing units lacking complete kitchen facilities: 1.7%
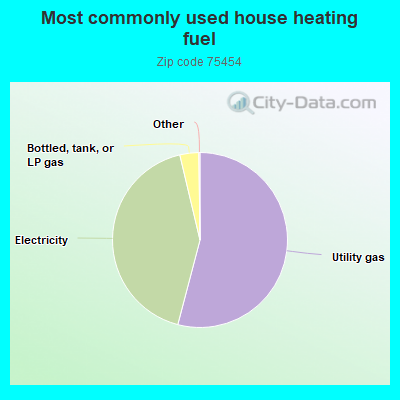
54.1%Utility gas
42.2%Electricity
3.5%Bottled, tank, or LP gas
Population in 1990: 703. Population change in the 1990s: +1,690 (+240.4%).
Place of birth for U.S.-born residents:
This state: 8,666
Northeast: 1,114
Midwest: 1,261
South: 2,971
West: 1,369
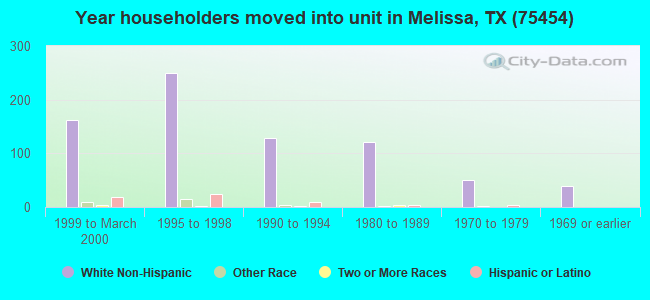
48% of the 75454 zip code residents lived in the same house 5 years ago. Out of people who lived in different houses, 52% lived in this county. Out of people who lived in different counties, 50% lived in Texas.
81% of the 75454 zip code residents lived in the same house 1 year ago. Out of people who lived in different houses, 67% moved from this county. Out of people who lived in different houses, 7% moved from different county within same state. Out of people who lived in different houses, 23% moved from different state.
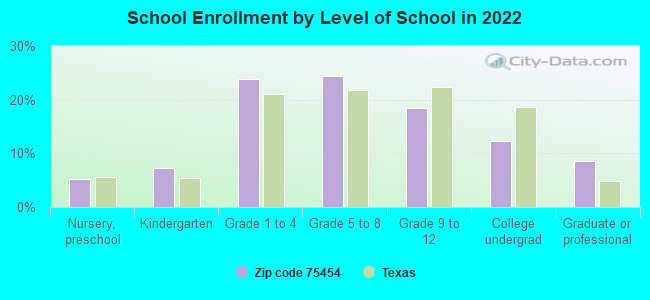
Private vs. public school enrollment:
Students in private schools in grades 1 to 8 (elementary and middle school): 263
Here:
10.3%
Texas:
8.8%
Students in private schools in grades 9 to 12 (high school): 7
Here:
0.8%
Texas:
8.0%
Students in private undergraduate colleges: 179
Here:
27.4%
Texas:
16.2%
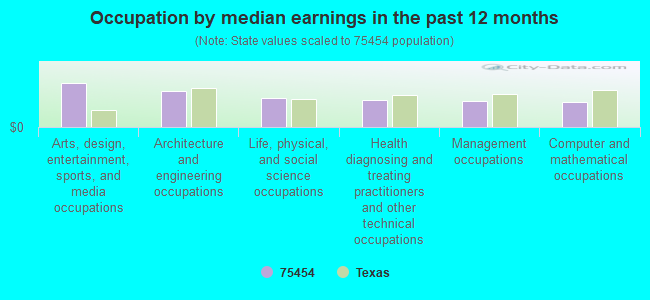
Occupation by median earnings in the past 12 months ($)
164,475Arts, design, entertainment, sports, and media occupations
132,792Architecture and engineering occupations
109,681Life, physical, and social science occupations
100,749Health diagnosing and treating practitioners and other technical occupations
96,343Management occupations
94,095Computer and mathematical occupations
Companies with federal contracts located in this zip code:
PMC PROFESSIONAL, LLC (403 PHEASANT RUN in MELISSA, TX; small business) : $87,110 in 2 contractsfrom 2004 to 2005
$43,555 with Navy for Miscellaneous Items. Taking place in TN. Signed on 2005-08-29. Completion date: 2005-10-07.
$43,555 with Navy for Other Administrative Support Services. Taking place in TN. Signed on 2004-08-31. Completion date: 2004-09-07.
Top industries in this zip code by the number of employees in 2005:
Construction: Water and Sewer Line and Related Structures Construction (100-249 employees: 1 establishment, 20-49 employees: 1 establishment, 10-19 employees: 1 establishment)
Administrative and Support and Waste Management and Remediation Services: Landscaping Services (50-99: 1, 10-19: 1, 1-4: 2)
Accommodation and Food Services: Limited-Service Restaurants (20-49: 1, 10-19: 1)
Construction: New Single-Family Housing Construction (except Operative Builders) (20-49: 1)
Wholesale Trade: Roofing, Siding, and Insulation Material Merchant Wholesalers (10-19: 1, 1-4: 1)
Fatal accident statistics in 2013:
Fatal accident count: 2
Vehicles involved in fatal accidents: 2
Fatal accidents caused by drunken drivers: 1
Fatalities: 2
Persons involved in fatal accidents: 2
Pedestrians involved in fatal accidents: 0
Fatal accident statistics in 2012:
Fatal accident count: 2
Vehicles involved in fatal accidents: 3
Fatal accidents caused by drunken drivers: 0
Fatalities: 2
Persons involved in fatal accidents: 4
Pedestrians involved in fatal accidents: 0
Home Mortgage Disclosure Act Aggregated Statistics For Year 2009 (Based on 2 partial tracts)
A) FHA, FSA/RHS & VA Home Purchase Loans
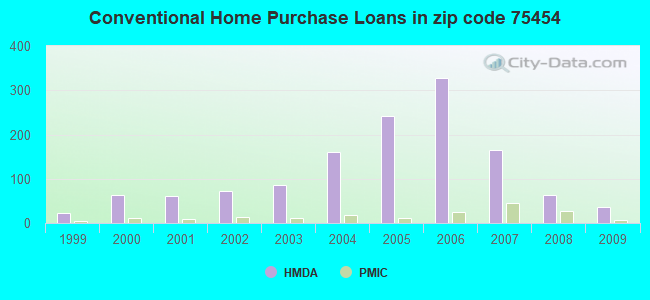
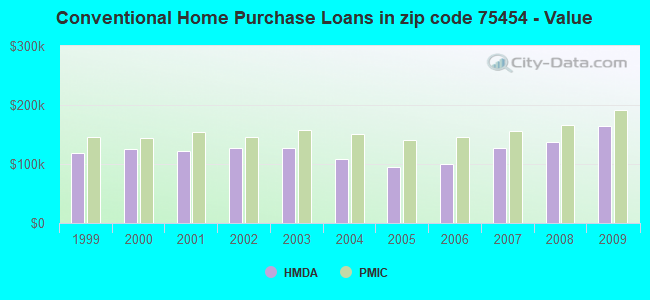
B) Conventional Home Purchase Loans
C) Refinancings
D) Home Improvement Loans
F) Non-occupant Loans on < 5 Family Dwellings (A B C & D)
G) Loans On Manufactured Home Dwelling (A B C & D)
Number
Average Value
Number
Average Value
Number
Average Value
Number
Average Value
Number
Average Value
Number
Average Value
LOANS ORIGINATED
65
$141,626
36
$164,281
101
$176,308
7
$34,497
7
$103,626
2
$52,240
APPLICATIONS APPROVED, NOT ACCEPTED
4
$128,325
2
$150,145
13
$153,128
1
$35,350
0
$0
1
$59,430
APPLICATIONS DENIED
12
$139,848
9
$168,947
48
$173,526
5
$40,100
4
$115,658
2
$68,660
APPLICATIONS WITHDRAWN
8
$136,068
6
$167,297
31
$189,718
1
$270,570
3
$148,477
0
$0
FILES CLOSED FOR INCOMPLETENESS
2
$123,870
0
$0
6
$204,988
0
$0
0
$0
0
$0
Aggregated Statistics For Year 2008 (Based on 2 partial tracts)
A) FHA, FSA/RHS & VA Home Purchase Loans
B) Conventional Home Purchase Loans
C) Refinancings
D) Home Improvement Loans
F) Non-occupant Loans on < 5 Family Dwellings (A B C & D)
G) Loans On Manufactured Home Dwelling (A B C & D)
Number
Average Value
Number
Average Value
Number
Average Value
Number
Average Value
Number
Average Value
Number
Average Value
LOANS ORIGINATED
67
$137,791
64
$137,583
56
$190,713
11
$40,095
18
$102,703
3
$75,697
APPLICATIONS APPROVED, NOT ACCEPTED
2
$159,995
7
$189,691
7
$150,993
2
$68,190
1
$67,250
1
$71,630
APPLICATIONS DENIED
13
$133,157
12
$123,035
42
$147,277
15
$56,158
4
$80,232
3
$53,280
APPLICATIONS WITHDRAWN
11
$142,978
11
$152,505
16
$166,898
1
$13,450
2
$58,180
0
$0
FILES CLOSED FOR INCOMPLETENESS
3
$122,723
3
$151,290
3
$196,440
1
$28,150
0
$0
0
$0
Aggregated Statistics For Year 2007 (Based on 2 partial tracts)
A) FHA, FSA/RHS & VA Home Purchase Loans
B) Conventional Home Purchase Loans
C) Refinancings
D) Home Improvement Loans
F) Non-occupant Loans on < 5 Family Dwellings (A B C & D)
G) Loans On Manufactured Home Dwelling (A B C & D)
Number
Average Value
Number
Average Value
Number
Average Value
Number
Average Value
Number
Average Value
Number
Average Value
LOANS ORIGINATED
69
$141,150
165
$126,462
56
$157,506
13
$44,249
28
$100,286
3
$100,930
APPLICATIONS APPROVED, NOT ACCEPTED
3
$116,673
28
$113,032
10
$134,191
4
$32,530
3
$72,153
1
$100,720
APPLICATIONS DENIED
12
$140,056
30
$129,697
61
$139,786
17
$46,571
8
$142,520
3
$58,390
APPLICATIONS WITHDRAWN
13
$141,338
28
$128,148
24
$132,510
2
$116,520
3
$88,940
0
$0
FILES CLOSED FOR INCOMPLETENESS
1
$137,010
4
$132,705
9
$186,186
0
$0
1
$39,410
0
$0
Aggregated Statistics For Year 2006 (Based on 2 partial tracts)
A) FHA, FSA/RHS & VA Home Purchase Loans
B) Conventional Home Purchase Loans
C) Refinancings
D) Home Improvement Loans
F) Non-occupant Loans on < 5 Family Dwellings (A B C & D)
G) Loans On Manufactured Home Dwelling (A B C & D)
Number
Average Value
Number
Average Value
Number
Average Value
Number
Average Value
Number
Average Value
Number
Average Value
LOANS ORIGINATED
68
$134,895
328
$99,406
52
$154,608
12
$32,322
63
$85,384
5
$84,582
APPLICATIONS APPROVED, NOT ACCEPTED
1
$81,640
38
$102,812
8
$124,964
4
$27,760
8
$112,178
1
$31,590
APPLICATIONS DENIED
9
$136,172
62
$102,921
48
$140,121
18
$44,400
13
$102,069
4
$58,808
APPLICATIONS WITHDRAWN
12
$131,220
46
$112,193
24
$138,857
2
$73,510
8
$76,128
1
$81,950
FILES CLOSED FOR INCOMPLETENESS
0
$0
8
$90,439
13
$154,715
1
$11,570
0
$0
0
$0
Aggregated Statistics For Year 2005 (Based on 2 partial tracts)
A) FHA, FSA/RHS & VA Home Purchase Loans
B) Conventional Home Purchase Loans
C) Refinancings
D) Home Improvement Loans
F) Non-occupant Loans on < 5 Family Dwellings (A B C & D)
G) Loans On Manufactured Home Dwelling (A B C & D)
Number
Average Value
Number
Average Value
Number
Average Value
Number
Average Value
Number
Average Value
Number
Average Value
LOANS ORIGINATED
72
$130,259
242
$95,586
74
$159,731
10
$73,664
36
$88,027
5
$93,966
APPLICATIONS APPROVED, NOT ACCEPTED
3
$150,457
23
$102,353
9
$144,131
5
$32,970
4
$93,215
4
$49,265
APPLICATIONS DENIED
12
$118,134
36
$94,918
70
$142,941
14
$49,132
5
$79,076
4
$47,858
APPLICATIONS WITHDRAWN
12
$127,362
33
$115,727
34
$183,365
4
$282,850
5
$112,920
2
$58,495
FILES CLOSED FOR INCOMPLETENESS
1
$165,470
6
$130,803
21
$165,769
0
$0
1
$55,990
0
$0
Aggregated Statistics For Year 2004 (Based on 2 partial tracts)
A) FHA, FSA/RHS & VA Home Purchase Loans
B) Conventional Home Purchase Loans
C) Refinancings
D) Home Improvement Loans
F) Non-occupant Loans on < 5 Family Dwellings (A B C & D)
G) Loans On Manufactured Home Dwelling (A B C & D)
Number
Average Value
Number
Average Value
Number
Average Value
Number
Average Value
Number
Average Value
Number
Average Value
LOANS ORIGINATED
84
$122,431
160
$108,925
80
$153,108
11
$29,858
16
$97,984
4
$68,660
APPLICATIONS APPROVED, NOT ACCEPTED
3
$111,670
22
$122,760
16
$154,641
3
$66,210
1
$172,670
1
$75,070
APPLICATIONS DENIED
15
$119,677
26
$101,817
57
$149,420
12
$43,532
4
$139,665
4
$65,140
APPLICATIONS WITHDRAWN
12
$118,578
26
$92,649
29
$135,410
2
$104,630
4
$76,088
1
$42,230
FILES CLOSED FOR INCOMPLETENESS
0
$0
4
$108,150
22
$131,348
0
$0
1
$30,970
0
$0
Aggregated Statistics For Year 2003 (Based on 2 partial tracts)
A) FHA, FSA/RHS & VA Home Purchase Loans
B) Conventional Home Purchase Loans
C) Refinancings
D) Home Improvement Loans
F) Non-occupant Loans on < 5 Family Dwellings (A B C & D)
Number
Average Value
Number
Average Value
Number
Average Value
Number
Average Value
Number
Average Value
LOANS ORIGINATED
72
$123,334
85
$126,548
136
$158,684
10
$46,732
9
$95,473
APPLICATIONS APPROVED, NOT ACCEPTED
2
$94,620
11
$111,471
20
$164,173
2
$76,165
2
$126,215
APPLICATIONS DENIED
8
$124,338
15
$97,844
61
$140,765
8
$33,391
2
$120,740
APPLICATIONS WITHDRAWN
15
$122,597
15
$104,309
33
$155,585
1
$39,410
2
$94,465
FILES CLOSED FOR INCOMPLETENESS
1
$148,580
3
$133,773
6
$135,755
0
$0
0
$0
Aggregated Statistics For Year 2002 (Based on 2 partial tracts)
A) FHA, FSA/RHS & VA Home Purchase Loans
B) Conventional Home Purchase Loans
C) Refinancings
D) Home Improvement Loans
F) Non-occupant Loans on < 5 Family Dwellings (A B C & D)
Number
Average Value
Number
Average Value
Number
Average Value
Number
Average Value
Number
Average Value
LOANS ORIGINATED
63
$119,127
72
$126,793
85
$153,154
9
$34,826
4
$92,902
APPLICATIONS APPROVED, NOT ACCEPTED
2
$115,425
8
$96,929
13
$144,875
3
$25,440
1
$48,480
APPLICATIONS DENIED
9
$110,974
16
$106,371
31
$141,819
3
$27,527
3
$131,583
APPLICATIONS WITHDRAWN
14
$120,986
17
$121,955
22
$136,352
2
$41,290
0
$0
FILES CLOSED FOR INCOMPLETENESS
0
$0
4
$132,235
7
$105,459
0
$0
0
$0
Aggregated Statistics For Year 2001 (Based on 2 partial tracts)
A) FHA, FSA/RHS & VA Home Purchase Loans
B) Conventional Home Purchase Loans
C) Refinancings
D) Home Improvement Loans
F) Non-occupant Loans on < 5 Family Dwellings (A B C & D)
Number
Average Value
Number
Average Value
Number
Average Value
Number
Average Value
Number
Average Value
LOANS ORIGINATED
15
$112,691
62
$121,366
77
$148,312
13
$27,334
6
$72,778
APPLICATIONS APPROVED, NOT ACCEPTED
0
$0
10
$83,768
10
$95,498
6
$22,313
0
$0
APPLICATIONS DENIED
1
$69,440
23
$87,788
20
$106,571
7
$25,604
2
$75,070
APPLICATIONS WITHDRAWN
2
$72,100
8
$143,184
16
$103,126
0
$0
1
$44,420
FILES CLOSED FOR INCOMPLETENESS
0
$0
2
$112,295
3
$195,500
0
$0
0
$0
Aggregated Statistics For Year 2000 (Based on 2 partial tracts)
A) FHA, FSA/RHS & VA Home Purchase Loans
B) Conventional Home Purchase Loans
C) Refinancings
D) Home Improvement Loans
F) Non-occupant Loans on < 5 Family Dwellings (A B C & D)
Number
Average Value
Number
Average Value
Number
Average Value
Number
Average Value
Number
Average Value
LOANS ORIGINATED
9
$103,328
64
$124,641
21
$108,646
11
$24,455
5
$113,922
APPLICATIONS APPROVED, NOT ACCEPTED
2
$39,100
9
$95,404
5
$99,532
6
$23,982
1
$87,580
APPLICATIONS DENIED
0
$0
30
$78,336
10
$97,437
7
$13,361
0
$0
APPLICATIONS WITHDRAWN
2
$90,710
6
$128,770
8
$109,871
1
$27,210
0
$0
FILES CLOSED FOR INCOMPLETENESS
0
$0
4
$126,215
3
$151,917
0
$0
0
$0
Aggregated Statistics For Year 1999 (Based on 1 partial tract)
A) FHA, FSA/RHS & VA Home Purchase Loans
B) Conventional Home Purchase Loans
C) Refinancings
D) Home Improvement Loans
F) Non-occupant Loans on < 5 Family Dwellings (A B C & D)
Detailed PMIC statistics for the following Tracts:0302.00
2004 - 2018 National Fire Incident Reporting System (NFIRS) incidents
Based on the data from the years 2004 - 2018 the average number of fire incidents per year is 42. The highest number of reported fires - 90 took place in 2016, and the least - 4 in 2004. The data has an increasing trend.
When looking into fire subcategories, the most reports belonged to: Outside Fires (56.2%), and Structure Fires (26.5%).
Fire incident types reported to NFIRS in Zip Code 75454


 Nearest zip codes: 75071, 75409, 75069, 75495, 75407, 75070.


 : $87,110 in 2 contracts from 2004 to 2005
 Based on the data from the years 2004 - 2018 the average number of fire incidents per year is 42. The highest number of reported fires - 90 took place in 2016, and the least - 4 in 2004. The data has an increasing trend.
 When looking into fire subcategories, the most reports belonged to: Outside Fires (56.2%), and Structure Fires (26.5%).