Estimated zip code population in 2022: 5,540 Zip code population in 2010: 4,326 Zip code population in 2000: 3,704
Houses and condos: 2,128 Renter-occupied apartments: 671
% of renters here:
36%
State:
38%
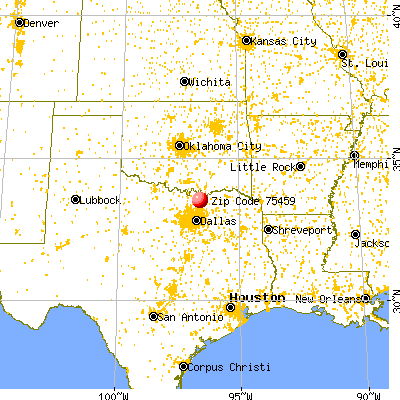
March 2022 cost of living index in zip code 75459: 80.2 (low, U.S. average is 100)
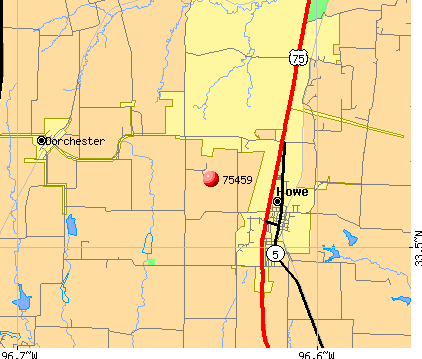
Land area: 79.4 sq. mi. Water area: 0.3 sq. mi.
Population density: 70 people per square mile
(very low).
OSM Map
General Map
Google Map
MSN Map
OSM Map
General Map
Google Map
MSN Map
OSM Map
General Map
Google Map
MSN Map
OSM Map
General Map
Google Map
MSN Map
Please wait while loading the map...
Real estate property taxes paid for housing units in 2022:
This zip code:
1.3% ($2,903)
Texas:
1.5% ($4,050)
Median real estate property taxes paid for housing units with mortgages in 2022: $3,526 (1.4%) Median real estate property taxes paid for housing units with no mortgage in 2022: $1,597 (0.8%)
Estimated median house/condo value in 2022: $228,999
75459:
$228,999
Texas:
$275,400
According to our research of Texas and other state lists, there were 7 registered sex offenders living in 75459 zip code as of May 28, 2024. The ratio of all residents to sex offenders in zip code 75459 is 707 to 1. The ratio of registered sex offenders to all residents in this zip code is lower than the state average.
Median resident age:
This zip code:
32.2 years
Texas median age:
35.6 years
Average household size:
This zip code:
3.0 people
Texas:
2.6 people
Averages for the 2020 tax year for zip code 75459, filed in 2021:
Average Adjusted Gross Income (AGI) in 2020: $64,498 (Individual Income Tax Returns)
Here:
$64,498
State:
$77,054
Salary/wage: $57,113 (reported on 87.1% of returns)
Here:
$57,113
State:
$62,766
(% of AGI for various income ranges: 1222.5% for AGIs below $25k, 3632.8% for AGIs $25k-50k, 6741.9% for AGIs $50k-75k, 9329.4% for AGIs $75k-100k, 17368.8% for AGIs $100k-200k, 56753.3% for AGIs over 200k)
Taxable interest for individuals: $1,130 (reported on 23.7% of returns)
This zip code:
$1,130
Texas:
$2,665
(% of AGI for various income ranges: 12.7% for AGIs below $25k, 11.1% for AGIs $25k-50k, 15.4% for AGIs $50k-75k, 40.6% for AGIs $75k-100k, 68.8% for AGIs $100k-200k, 776.7% for AGIs over 200k)
Ordinary dividends: $5,300 (reported on 10.4% of returns)
Here:
$5,300
State:
$10,044
(% of AGI for various income ranges: 7.1% for AGIs below $25k, 21.1% for AGIs $25k-50k, 31.9% for AGIs $50k-75k, 109.4% for AGIs $75k-100k, 158.0% for AGIs $100k-200k, 1696.7% for AGIs over 200k)
Net capital gain/loss in AGI: +$14,931 (reported on 10.8% of returns)
Here:
+$14,931
State:
+$39,590
(% of AGI for various income ranges: 8.4% for AGIs below $25k, 37.0% for AGIs $25k-50k, 59.2% for AGIs $50k-75k, 171.2% for AGIs $75k-100k, 264.0% for AGIs $100k-200k, 8446.7% for AGIs over 200k)
Profit/loss from business: +$7,702 (reported on 17.8% of returns)
Here:
+$7,702
State:
+$10,888
(% of AGI for various income ranges: 111.1% for AGIs below $25k, 131.3% for AGIs $25k-50k, 151.2% for AGIs $50k-75k, 174.7% for AGIs $75k-100k, 521.6% for AGIs $100k-200k)
Taxable individual retirement arrangement distribution: $23,206 (reported on 7.5% of returns)
75459:
$23,206
Texas:
$24,740
(% of AGI for various income ranges: 37.9% for AGIs below $25k, 85.1% for AGIs $25k-50k, 133.8% for AGIs $50k-75k, 412.4% for AGIs $75k-100k, 986.0% for AGIs $100k-200k)
Total itemized deductions: $32,407 (reported on 5.8% of returns)
Here:
$32,407
State:
$40,428
(% of AGI for various income ranges: 141.5% for AGIs $25k-50k, 385.8% for AGIs $50k-75k, 647.6% for AGIs $100k-200k, 3883.3% for AGIs over 200k)
Charity contributions: $9,818 (reported on 4.6% of returns)
Here:
$9,818
State:
$18,201
(% of AGI for various income ranges: 110.8% for AGIs $50k-75k, 316.8% for AGIs $100k-200k)
Taxes paid: $6,657 (reported on 5.8% of returns)
75459:
$6,657
State:
$7,821
(% of AGI for various income ranges: 19.8% for AGIs $25k-50k, 84.6% for AGIs $50k-75k, 158.0% for AGIs $100k-200k, 706.7% for AGIs over 200k)
Earned income credit: $2,560 (reported on 17.8% of returns)
Here:
$2,560
State:
$2,584
(% of AGI for various income ranges: 122.0% for AGIs below $25k, 78.9% for AGIs $25k-50k)
Percentage of individuals using paid preparers for their 2020 taxes: 91.3%
Here:
91%
State:
92%
(% for various income ranges: 90.1% for AGIs below $25k, 92.3% for AGIs $25k-50k, 91.2% for AGIs $50k-75k, 95.7% for AGIs $75k-100k, 90.0% for AGIs $100k-200k, 87.5% for AGIs over 200k)
Averages for the 2012 tax year for zip code 75459, filed in 2013:
Average Adjusted Gross Income (AGI) in 2012: $53,539 (Individual Income Tax Returns)
Here:
$53,539
State:
$65,384
Salary/wage: $47,836 (reported on 87.6% of returns)
Here:
$47,836
State:
$52,524
(% of AGI for various income ranges: 76.4% for AGIs below $25k, 80.6% for AGIs $25k-50k, 83.0% for AGIs $50k-75k, 80.8% for AGIs $75k-100k, 84.0% for AGIs $100k-200k, 51.4% for AGIs over 200k)
Taxable interest for individuals: $1,476 (reported on 27.5% of returns)
This zip code:
$1,476
Texas:
$2,372
(% of AGI for various income ranges: 1.2% for AGIs below $25k, 0.6% for AGIs $25k-50k, 0.4% for AGIs $50k-75k, 0.8% for AGIs $75k-100k, 1.3% for AGIs $100k-200k)
Ordinary dividends: $1,800 (reported on 12.9% of returns)
Here:
$1,800
State:
$9,721
(% of AGI for various income ranges: 0.6% for AGIs below $25k, 0.6% for AGIs $25k-50k, 0.3% for AGIs $50k-75k, 0.5% for AGIs $75k-100k, 0.5% for AGIs $100k-200k)
Net capital gain/loss in AGI: +$4,047 (reported on 9.6% of returns)
Here:
+$4,047
State:
+$35,319
(% of AGI for various income ranges: 0.4% for AGIs below $25k, 0.2% for AGIs $75k-100k, 2.3% for AGIs $100k-200k)
Profit/loss from business: +$7,916 (reported on 18.0% of returns)
Here:
+$7,916
State:
+$13,732
(% of AGI for various income ranges: 7.0% for AGIs below $25k, 3.8% for AGIs $25k-50k, 2.6% for AGIs $50k-75k, 2.0% for AGIs $75k-100k, 2.2% for AGIs $100k-200k)
Taxable individual retirement arrangement distribution: $13,632 (reported on 10.7% of returns)
75459:
$13,632
Texas:
$19,511
(% of AGI for various income ranges: 3.6% for AGIs below $25k, 3.5% for AGIs $25k-50k, 4.0% for AGIs $50k-75k, 4.1% for AGIs $75k-100k, 1.3% for AGIs $100k-200k)
Total itemized deductions: $19,710 (19% of AGI, reported on 22.5% of returns)
Here:
$19,710
State:
$24,724
Here:
19.2% of AGI
State:
15.9% of AGI
(% of AGI for various income ranges: 7.2% for AGIs below $25k, 5.5% for AGIs $25k-50k, 7.4% for AGIs $50k-75k, 8.5% for AGIs $75k-100k, 10.6% for AGIs $100k-200k, 8.7% for AGIs over 200k)
Charity contributions: $4,913 (reported on 16.9% of returns)
Here:
$4,913
State:
$6,808
(% of AGI for various income ranges: 0.7% for AGIs below $25k, 0.6% for AGIs $25k-50k, 1.5% for AGIs $50k-75k, 1.1% for AGIs $75k-100k, 2.0% for AGIs $100k-200k, 3.4% for AGIs over 200k)
Taxes paid: $4,550 (reported on 22.5% of returns)
75459:
$4,550
State:
$6,921
(% of AGI for various income ranges: 1.2% for AGIs below $25k, 1.2% for AGIs $25k-50k, 1.8% for AGIs $50k-75k, 2.0% for AGIs $75k-100k, 2.5% for AGIs $100k-200k, 2.0% for AGIs over 200k)
Earned income credit: $2,383 (reported on 19.7% of returns)
Here:
$2,383
State:
$2,570
(% of AGI for various income ranges: 7.6% for AGIs below $25k, 1.3% for AGIs $25k-50k)
Percentage of individuals using paid preparers for their 2012 taxes: 47.2%
Here:
47%
State:
51%
(% for various income ranges: 43.1% for AGIs below $25k, 44.2% for AGIs $25k-50k, 53.8% for AGIs $50k-75k, 52.4% for AGIs $75k-100k, 50.0% for AGIs $100k-200k, 66.7% for AGIs over 200k)
Averages for the 2004 tax year for zip code 75459, filed in 2005:
Average Adjusted Gross Income (AGI) in 2004: $43,548 (Individual Income Tax Returns)
Here:
$43,548
State:
$47,881
Salary/wage: $40,877 (reported on 85.9% of returns)
Here:
$40,877
State:
$41,947
(% of AGI for various income ranges: 107.2% for AGIs below $10k, 74.8% for AGIs $10k-25k, 82.8% for AGIs $25k-50k, 85.3% for AGIs $50k-75k, 88.3% for AGIs $75k-100k, 70.2% for AGIs over 100k)
Taxable interest for individuals: $1,729 (reported on 35.0% of returns)
This zip code:
$1,729
Texas:
$2,255
(% of AGI for various income ranges: 7.9% for AGIs below $10k, 2.3% for AGIs $10k-25k, 0.9% for AGIs $25k-50k, 1.2% for AGIs $50k-75k, 0.2% for AGIs $75k-100k, 2.0% for AGIs over 100k)
Taxable dividends: $978 (reported on 16.1% of returns)
Here:
$978
State:
$4,261
(% of AGI for various income ranges: 3.1% for AGIs below $10k, 0.2% for AGIs $10k-25k, 0.4% for AGIs $25k-50k, 0.3% for AGIs $50k-75k, 0.2% for AGIs $75k-100k, 0.5% for AGIs over 100k)
Net capital gain/loss: +$9,263 (reported on 13.5% of returns)
Here:
+$9,263
State:
+$16,110
(% of AGI for various income ranges: -4.0% for AGIs below $10k, -0.1% for AGIs $10k-25k, -0.3% for AGIs $25k-50k, 0.1% for AGIs $50k-75k, 0.2% for AGIs $75k-100k, 11.1% for AGIs over 100k)
Profit/loss from business: +$8,627 (reported on 17.8% of returns)
Here:
+$8,627
State:
+$11,013
(% of AGI for various income ranges: 6.7% for AGIs below $10k, 8.8% for AGIs $10k-25k, 4.0% for AGIs $25k-50k, 2.7% for AGIs $50k-75k, 2.4% for AGIs $75k-100k, 2.5% for AGIs over 100k)
IRA payment deduction: $3,531 (reported on 1.9% of returns)
75459:
$3,531
Texas:
$3,120
Total itemized deductions: $17,995 (23% of AGI, reported on 22.9% of returns)
Here:
$17,995
State:
$19,631
Here:
23.1% of AGI
State:
18.9% of AGI
(% of AGI for various income ranges: 8.5% for AGIs $10k-25k, 8.1% for AGIs $25k-50k, 8.6% for AGIs $50k-75k, 10.8% for AGIs $75k-100k, 11.2% for AGIs over 100k)
Charity contributions deductions: $3,867 (5% of AGI, reported on 17.9% of returns)
Here:
$3,867
State:
$4,753
Here:
4.7% of AGI
State:
4.2% of AGI
(% of AGI for various income ranges: 1.0% for AGIs $10k-25k, 1.2% for AGIs $25k-50k, 1.2% for AGIs $50k-75k, 2.1% for AGIs $75k-100k, 2.2% for AGIs over 100k)
Total tax: $5,955 (reported on 75.1% of returns)
75459:
$5,955
State:
$9,058
(% of AGI for various income ranges: 3.1% for AGIs below $10k, 4.2% for AGIs $10k-25k, 6.6% for AGIs $25k-50k, 8.3% for AGIs $50k-75k, 10.4% for AGIs $75k-100k, 17.4% for AGIs over 100k)
Earned income credit: $1,910 (reported on 18.0% of returns)
Here:
$1,910
State:
$2,024
Percentage of individuals using paid preparers for their 2004 taxes: 53.8%
Here:
54%
State:
57%
(% for various income ranges: 44.1% for AGIs below $10k, 55.7% for AGIs $10k-25k, 58.3% for AGIs $25k-50k, 51.2% for AGIs $50k-75k, 53.9% for AGIs $75k-100k, 62.0% for AGIs over 100k)
Household received Food Stamps/SNAP in the past 12 months: 316 Household did not receive Food Stamps/SNAP in the past 12 months: 1,554
Women who had a birth in the past 12 months: 62 (63 now married, 0 unmarried) Women who did not have a birth in the past 12 months: 1,296 (652 now married, 640 unmarried)
Housing units in zip code 75459 with a mortgage: 771 (20 second mortgage) Houses without a mortgage: 32
Median monthly owner costs for units with a mortgage: $1,747 Median monthly owner costs for units without a mortgage: $631
Residents with income below the poverty level in 2022:
This zip code:
20.5%
Whole state:
14.0%
Residents with income below 50% of the poverty level in 2022:
This zip code:
10.0%
Whole state:
7.4%
Median number of rooms in houses and condos:
Here:
5.8
State:
6.3
Median number of rooms in apartments:
Here:
4.1
State:
4.0
Notable locations in this zip code not listed on our city pages
Reservoirs: Soil Conservation Service Site 21 Reservoir (A), Soil Conservation Service Site 20 Reservoir (B), Soil Conservation Service Site 19 Reservoir (C), Soil Conservation Service Site 18 Reservoir (D), Soil Conservation Service Site 35a Reservoir (E), Soil Conservation Service Site 38 Reservoir (F), Soil Conservation Service Site 20-A Reservoir (G), Soil Conservation Service Site 18 Reservoir (H). Display/hide their locations on the map
Size of family households: 398 2-persons, 327 3-persons, 402 4-persons, 153 5-persons, 31 6-persons, 51 7-or-more-persons
Size of nonfamily households: 415 1-person, 76 2-persons
1,291 married couples with children.
487 single-parent households (162 men, 325 women).
88.9% of residents of 75459 zip code speak English at home.
9.8% of residents speak Spanish at home (39% very well, 23% well, 39% not well).
0.4% of residents speak other Indo-European language at home (100% very well).
0.1% of residents speak Asian or Pacific Island language at home (29% very well, 71% well).
Foreign born population: 468 (8.5%) (1.4% of them are naturalized citizens)
This zip code:
8.5%
Whole state:
17.2%
83%Honduras
6%Costa Rica
5%Guatemala
1%El Salvador
1%Malaysia
1%Germany
8%American
8%English
6%Irish
6%German
3%Italian
3%Scottish
1%French
Year of entry for the foreign-born population
3052010 or later
742000 to 2009
1071990 to 1999
34Before 1990
Housing units lacking complete plumbing facilities: 3.3% Housing units lacking complete kitchen facilities: 3.3%
70.1%Electricity
15.7%Utility gas
7.3%Bottled, tank, or LP gas
3.5%Other fuel
2.7%No fuel used
0.9%Wood
Population in 1990: 4,843.
Place of birth for U.S.-born residents:
This state: 3,485
Northeast: 59
Midwest: 384
South: 625
West: 495
51% of the 75459 zip code residents lived in the same house 5 years ago. Out of people who lived in different houses, 55% lived in this county. Out of people who lived in different counties, 50% lived in Texas.
86% of the 75459 zip code residents lived in the same house 1 year ago. Out of people who lived in different houses, 13% moved from this county. Out of people who lived in different houses, 72% moved from different county within same state. Out of people who lived in different houses, 19% moved from different state.
Private vs. public school enrollment:
Students in private schools in grades 1 to 8 (elementary and middle school): 101
Here:
9.9%
Texas:
8.8%
Students in private schools in grades 9 to 12 (high school): 26
Here:
9.1%
Texas:
8.0%
Students in private undergraduate colleges: 5
Here:
3.6%
Texas:
16.2%
Occupation by median earnings in the past 12 months ($)
100,063Installation, maintenance, and repair occupations
97,970Architecture and engineering occupations
91,458Personal care and service occupations
89,228Health diagnosing and treating practitioners and other technical occupations
89,052Fire fighting and prevention, and other protective service workers including supervisors
69,054Computer and mathematical occupations
Companies with federal contracts located in this zip code:
COP STUFF (120 N COLLINS FREEWAY in HOWE, TX; small business)
$11,076 with Navy for Miscellaneous Items. Signed on 2004-08-24. Completion date: 2004-08-31.
Top industries in this zip code by the number of employees in 2005:
Other Services (except Public Administration): Religious Organizations (20-49 employees: 1 establishment, 10-19 employees: 1 establishment, 1-4 employees: 3 establishments)
Health Care and Social Assistance: Home Health Care Services (20-49: 1, 10-19: 1, 1-4: 1)
Wholesale Trade: Farm and Garden Machinery and Equipment Merchant Wholesalers (10-19: 1)
Real Estate and Rental and Leasing: Offices of Real Estate Agents and Brokers (5-9: 1, 1-4: 1)
Finance and Insurance: Commercial Banking (5-9: 1)
Construction: Site Preparation Contractors (5-9: 1)
Accommodation and Food Services: Snack and Nonalcoholic Beverage Bars (5-9: 1)
Fatal accident statistics in 2013:
Fatal accident count: 1
Vehicles involved in fatal accidents: 1
Fatal accidents caused by drunken drivers: 0
Fatalities: 1
Persons involved in fatal accidents: 4
Pedestrians involved in fatal accidents: 0
Home Mortgage Disclosure Act Aggregated Statistics For Year 2009 (Based on 6 partial tracts)
A) FHA, FSA/RHS & VA Home Purchase Loans
B) Conventional Home Purchase Loans
C) Refinancings
D) Home Improvement Loans
F) Non-occupant Loans on < 5 Family Dwellings (A B C & D)
G) Loans On Manufactured Home Dwelling (A B C & D)
Number
Average Value
Number
Average Value
Number
Average Value
Number
Average Value
Number
Average Value
Number
Average Value
LOANS ORIGINATED
62
$130,601
42
$118,919
126
$149,092
15
$90,641
12
$102,132
7
$71,023
APPLICATIONS APPROVED, NOT ACCEPTED
1
$124,260
5
$80,452
12
$132,047
3
$51,317
1
$82,240
2
$24,520
APPLICATIONS DENIED
6
$101,328
10
$104,726
59
$141,379
14
$46,754
4
$67,068
4
$26,565
APPLICATIONS WITHDRAWN
6
$162,883
7
$154,380
35
$160,729
4
$41,748
2
$105,730
2
$37,825
FILES CLOSED FOR INCOMPLETENESS
1
$135,050
2
$161,275
6
$153,080
0
$0
0
$0
1
$81,990
Aggregated Statistics For Year 2008 (Based on 6 partial tracts)
A) FHA, FSA/RHS & VA Home Purchase Loans
B) Conventional Home Purchase Loans
C) Refinancings
D) Home Improvement Loans
F) Non-occupant Loans on < 5 Family Dwellings (A B C & D)
G) Loans On Manufactured Home Dwelling (A B C & D)
Number
Average Value
Number
Average Value
Number
Average Value
Number
Average Value
Number
Average Value
Number
Average Value
LOANS ORIGINATED
56
$124,566
74
$117,843
90
$152,796
25
$37,991
24
$82,867
8
$67,089
APPLICATIONS APPROVED, NOT ACCEPTED
5
$117,884
6
$81,645
13
$111,424
3
$24,437
3
$74,997
1
$45,090
APPLICATIONS DENIED
6
$119,362
24
$112,684
74
$123,265
28
$56,791
8
$73,331
4
$54,048
APPLICATIONS WITHDRAWN
9
$117,650
12
$131,508
32
$128,292
3
$57,990
3
$55,400
2
$104,605
FILES CLOSED FOR INCOMPLETENESS
1
$161,790
4
$96,350
6
$171,293
2
$69,355
1
$84,780
1
$58,300
Aggregated Statistics For Year 2007 (Based on 6 partial tracts)
A) FHA, FSA/RHS & VA Home Purchase Loans
B) Conventional Home Purchase Loans
C) Refinancings
D) Home Improvement Loans
E) Loans on Dwellings For 5+ Families
F) Non-occupant Loans on < 5 Family Dwellings (A B C & D)
G) Loans On Manufactured Home Dwelling (A B C & D)
Number
Average Value
Number
Average Value
Number
Average Value
Number
Average Value
Number
Average Value
Number
Average Value
Number
Average Value
LOANS ORIGINATED
43
$113,092
161
$110,732
94
$150,741
30
$45,074
0
$0
39
$92,425
12
$70,650
APPLICATIONS APPROVED, NOT ACCEPTED
3
$107,713
20
$95,840
19
$184,403
5
$56,910
0
$0
3
$188,063
3
$56,257
APPLICATIONS DENIED
6
$115,618
46
$96,959
103
$144,679
30
$41,678
1
$4,790
9
$100,972
13
$59,225
APPLICATIONS WITHDRAWN
6
$108,797
20
$144,780
62
$134,711
4
$69,422
0
$0
4
$133,980
2
$87,330
FILES CLOSED FOR INCOMPLETENESS
0
$0
8
$118,470
18
$183,463
0
$0
0
$0
0
$0
0
$0
Aggregated Statistics For Year 2006 (Based on 6 partial tracts)
A) FHA, FSA/RHS & VA Home Purchase Loans
B) Conventional Home Purchase Loans
C) Refinancings
D) Home Improvement Loans
E) Loans on Dwellings For 5+ Families
F) Non-occupant Loans on < 5 Family Dwellings (A B C & D)
G) Loans On Manufactured Home Dwelling (A B C & D)
Number
Average Value
Number
Average Value
Number
Average Value
Number
Average Value
Number
Average Value
Number
Average Value
Number
Average Value
LOANS ORIGINATED
40
$96,922
197
$98,448
107
$131,502
23
$39,548
1
$686,620
32
$91,219
14
$64,905
APPLICATIONS APPROVED, NOT ACCEPTED
2
$72,050
25
$93,874
19
$96,262
12
$34,282
0
$0
5
$93,748
6
$56,427
APPLICATIONS DENIED
4
$124,788
48
$99,350
92
$110,998
36
$40,754
0
$0
13
$98,515
19
$50,687
APPLICATIONS WITHDRAWN
4
$87,008
22
$107,750
60
$120,652
5
$35,536
0
$0
8
$78,555
2
$46,705
FILES CLOSED FOR INCOMPLETENESS
0
$0
6
$112,090
31
$152,125
1
$94,110
0
$0
2
$88,545
0
$0
Aggregated Statistics For Year 2005 (Based on 6 partial tracts)
A) FHA, FSA/RHS & VA Home Purchase Loans
B) Conventional Home Purchase Loans
C) Refinancings
D) Home Improvement Loans
F) Non-occupant Loans on < 5 Family Dwellings (A B C & D)
G) Loans On Manufactured Home Dwelling (A B C & D)
Number
Average Value
Number
Average Value
Number
Average Value
Number
Average Value
Number
Average Value
Number
Average Value
LOANS ORIGINATED
40
$100,260
217
$94,322
144
$142,953
27
$51,981
52
$79,873
13
$67,118
APPLICATIONS APPROVED, NOT ACCEPTED
3
$92,957
24
$88,261
25
$146,286
10
$37,377
4
$134,518
8
$52,849
APPLICATIONS DENIED
4
$90,735
36
$91,403
132
$106,456
31
$54,106
13
$85,303
19
$60,409
APPLICATIONS WITHDRAWN
4
$81,840
35
$100,632
72
$124,516
12
$175,517
11
$89,976
2
$55,410
FILES CLOSED FOR INCOMPLETENESS
0
$0
3
$87,260
48
$123,580
2
$6,720
2
$83,820
0
$0
Aggregated Statistics For Year 2004 (Based on 6 partial tracts)
A) FHA, FSA/RHS & VA Home Purchase Loans
B) Conventional Home Purchase Loans
C) Refinancings
D) Home Improvement Loans
F) Non-occupant Loans on < 5 Family Dwellings (A B C & D)
G) Loans On Manufactured Home Dwelling (A B C & D)
Number
Average Value
Number
Average Value
Number
Average Value
Number
Average Value
Number
Average Value
Number
Average Value
LOANS ORIGINATED
35
$105,297
174
$98,621
197
$116,591
24
$52,595
39
$82,479
12
$59,756
APPLICATIONS APPROVED, NOT ACCEPTED
3
$78,863
18
$83,319
27
$107,799
5
$28,590
3
$79,533
6
$42,912
APPLICATIONS DENIED
7
$113,443
49
$64,250
135
$99,625
22
$41,309
13
$51,928
21
$40,959
APPLICATIONS WITHDRAWN
6
$86,277
16
$130,885
68
$105,133
6
$78,273
5
$80,782
1
$26,970
FILES CLOSED FOR INCOMPLETENESS
0
$0
4
$71,340
51
$123,235
2
$50,190
1
$161,070
0
$0
Aggregated Statistics For Year 2003 (Based on 6 partial tracts)
A) FHA, FSA/RHS & VA Home Purchase Loans
B) Conventional Home Purchase Loans
C) Refinancings
D) Home Improvement Loans
F) Non-occupant Loans on < 5 Family Dwellings (A B C & D)
Number
Average Value
Number
Average Value
Number
Average Value
Number
Average Value
Number
Average Value
LOANS ORIGINATED
30
$97,858
156
$98,013
341
$118,025
29
$33,713
35
$78,665
APPLICATIONS APPROVED, NOT ACCEPTED
2
$75,620
16
$83,012
41
$120,560
3
$20,260
3
$54,033
APPLICATIONS DENIED
4
$92,918
46
$85,665
115
$111,538
16
$28,131
8
$85,405
APPLICATIONS WITHDRAWN
4
$99,322
13
$113,742
81
$113,379
3
$26,643
3
$122,943
FILES CLOSED FOR INCOMPLETENESS
1
$117,360
4
$83,075
16
$132,522
0
$0
1
$116,240
Aggregated Statistics For Year 2002 (Based on 2 partial tracts)
A) FHA, FSA/RHS & VA Home Purchase Loans
B) Conventional Home Purchase Loans
C) Refinancings
D) Home Improvement Loans
F) Non-occupant Loans on < 5 Family Dwellings (A B C & D)
Number
Average Value
Number
Average Value
Number
Average Value
Number
Average Value
Number
Average Value
LOANS ORIGINATED
16
$93,560
49
$114,407
88
$132,832
12
$39,233
15
$75,163
APPLICATIONS APPROVED, NOT ACCEPTED
0
$0
7
$100,314
12
$127,874
4
$39,082
1
$87,820
APPLICATIONS DENIED
1
$126,450
15
$86,873
27
$109,010
7
$31,859
5
$96,712
APPLICATIONS WITHDRAWN
1
$80,900
4
$83,995
15
$141,120
1
$9,110
1
$59,030
FILES CLOSED FOR INCOMPLETENESS
0
$0
2
$177,645
4
$149,040
1
$53,200
0
$0
Aggregated Statistics For Year 2001 (Based on 2 partial tracts)
A) FHA, FSA/RHS & VA Home Purchase Loans
B) Conventional Home Purchase Loans
C) Refinancings
D) Home Improvement Loans
F) Non-occupant Loans on < 5 Family Dwellings (A B C & D)
Number
Average Value
Number
Average Value
Number
Average Value
Number
Average Value
Number
Average Value
LOANS ORIGINATED
9
$89,278
59
$108,177
61
$121,907
11
$22,626
13
$83,672
APPLICATIONS APPROVED, NOT ACCEPTED
0
$0
13
$79,215
10
$112,089
3
$17,490
2
$89,640
APPLICATIONS DENIED
1
$54,300
22
$67,977
20
$112,035
8
$27,922
4
$129,180
APPLICATIONS WITHDRAWN
2
$101,305
5
$199,472
13
$101,472
3
$20,770
1
$154,870
FILES CLOSED FOR INCOMPLETENESS
0
$0
1
$124,260
3
$141,267
0
$0
0
$0
Aggregated Statistics For Year 2000 (Based on 2 partial tracts)
A) FHA, FSA/RHS & VA Home Purchase Loans
B) Conventional Home Purchase Loans
C) Refinancings
D) Home Improvement Loans
F) Non-occupant Loans on < 5 Family Dwellings (A B C & D)
Number
Average Value
Number
Average Value
Number
Average Value
Number
Average Value
Number
Average Value
LOANS ORIGINATED
9
$81,099
56
$72,587
28
$98,844
8
$30,838
13
$57,323
APPLICATIONS APPROVED, NOT ACCEPTED
0
$0
10
$63,843
7
$71,110
5
$21,280
0
$0
APPLICATIONS DENIED
1
$55,390
29
$63,531
13
$103,630
7
$15,097
1
$33,160
APPLICATIONS WITHDRAWN
0
$0
6
$137,197
7
$85,946
1
$53,200
1
$17,860
FILES CLOSED FOR INCOMPLETENESS
0
$0
1
$131,910
4
$57,758
0
$0
1
$73,240
Aggregated Statistics For Year 1999 (Based on 2 partial tracts)
A) FHA, FSA/RHS & VA Home Purchase Loans
B) Conventional Home Purchase Loans
C) Refinancings
D) Home Improvement Loans
F) Non-occupant Loans on < 5 Family Dwellings (A B C & D)
2003 - 2018 National Fire Incident Reporting System (NFIRS) incidents
According to the data from the years 2003 - 2018 the average number of fire incidents per year is 34. The highest number of reported fire incidents - 59 took place in 2012, and the least - 4 in 2010. The data has a constant trend.
When looking into fire subcategories, the most incidents belonged to: Outside Fires (61.1%), and Structure Fires (25.9%).
Fire incident types reported to NFIRS in Zip Code 75459


 Nearest zip codes: 75058, 75092, 76268, 75090, 75495, 75489.


 According to the data from the years 2003 - 2018 the average number of fire incidents per year is 34. The highest number of reported fire incidents - 59 took place in 2012, and the least - 4 in 2010. The data has a constant trend.
 When looking into fire subcategories, the most incidents belonged to: Outside Fires (61.1%), and Structure Fires (25.9%).