Estimated zip code population in 2022: 2,073 Zip code population in 2010: 1,849 Zip code population in 2000: 1,755
Houses and condos: 861 Renter-occupied apartments: 171
% of renters here:
23%
State:
38%
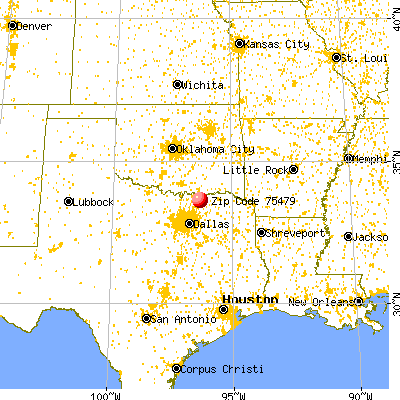
March 2022 cost of living index in zip code 75479: 79.1 (low, U.S. average is 100)
Land area: 50.8 sq. mi. Water area: 1.5 sq. mi.
Population density: 41 people per square mile
(very low).
OSM Map
General Map
Google Map
MSN Map
OSM Map
General Map
Google Map
MSN Map
OSM Map
General Map
Google Map
MSN Map
OSM Map
General Map
Google Map
MSN Map
Please wait while loading the map...
Real estate property taxes paid for housing units in 2022:
This zip code:
1.2% ($2,210)
Texas:
1.5% ($4,050)
Median real estate property taxes paid for housing units with mortgages in 2022: $2,385 (1.3%) Median real estate property taxes paid for housing units with no mortgage in 2022: $2,092 (1.2%)
Business Search- 14 Million verified businesses
Males: 857
(41.4%)
Females: 1,215
(58.6%)
For population 25 years and over in 75479:
High school or higher: 89.3%
Bachelor's degree or higher: 21.4%
Graduate or professional degree: 6.7%
Unemployed: 1.1%
Mean travel time to work (commute): 29.7 minutes
For population 15 years and over in 75479:
Never married: 16.7%
Now married: 55.4%
Separated: 0.3%
Widowed: 9.1%
Divorced: 18.5%
Zip code 75479 compared to state average:
Median house value below state average.
Unemployed percentage significantly below state average.
Black race population percentage significantly below state average.
Hispanic race population percentage significantly below state average.
Median age significantly above state average.
Foreign-born population percentage significantly below state average.
Averages for the 2020 tax year for zip code 75479, filed in 2021:
Average Adjusted Gross Income (AGI) in 2020: $59,645 (Individual Income Tax Returns)
Here:
$59,645
State:
$77,054
Salary/wage: $56,351 (reported on 83.7% of returns)
Here:
$56,351
State:
$62,766
(% of AGI for various income ranges: 1242.5% for AGIs below $25k, 3763.3% for AGIs $25k-50k, 6354.2% for AGIs $50k-75k, 9177.1% for AGIs $75k-100k, 19183.3% for AGIs $100k-200k)
Taxable interest for individuals: $760 (reported on 23.3% of returns)
This zip code:
$760
Texas:
$2,665
(% of AGI for various income ranges: 15.5% for AGIs below $25k, 15.0% for AGIs $25k-50k, 19.2% for AGIs $50k-75k, 78.9% for AGIs $100k-200k)
Ordinary dividends: $1,750 (reported on 9.3% of returns)
Here:
$1,750
State:
$10,044
(% of AGI for various income ranges: 23.5% for AGIs below $25k, 15.8% for AGIs $50k-75k, 82.2% for AGIs $100k-200k)
Net capital gain/loss in AGI: +$10,860 (reported on 11.6% of returns)
Here:
+$10,860
State:
+$39,590
(% of AGI for various income ranges: 17.5% for AGIs below $25k, 91.7% for AGIs $50k-75k, 1045.6% for AGIs $100k-200k)
Profit/loss from business: +$8,377 (reported on 15.1% of returns)
Here:
+$8,377
State:
+$10,888
(% of AGI for various income ranges: 218.5% for AGIs below $25k, 292.5% for AGIs $50k-75k, 334.4% for AGIs $100k-200k)
Taxable individual retirement arrangement distribution: $18,300 (reported on 5.8% of returns)
75479:
$18,300
Texas:
$24,740
(% of AGI for various income ranges: 176.0% for AGIs below $25k, 804.3% for AGIs $75k-100k)
Total itemized deductions: $33,940 (reported on 5.8% of returns)
Here:
$33,940
State:
$40,428
(% of AGI for various income ranges: 432.2% for AGIs $25k-50k, 1021.1% for AGIs $100k-200k)
Charity contributions: $9,475 (reported on 4.7% of returns)
Here:
$9,475
State:
$18,201
(% of AGI for various income ranges: 541.4% for AGIs $75k-100k)
Taxes paid: $6,800 (reported on 5.8% of returns)
75479:
$6,800
State:
$7,821
(% of AGI for various income ranges: 95.6% for AGIs $25k-50k, 186.7% for AGIs $100k-200k)
Earned income credit: $2,250 (reported on 16.3% of returns)
Here:
$2,250
State:
$2,584
(% of AGI for various income ranges: 90.0% for AGIs below $25k, 75.0% for AGIs $25k-50k)
Percentage of individuals using paid preparers for their 2020 taxes: 91.9%
Here:
92%
State:
92%
(% for various income ranges: 88.5% for AGIs below $25k, 95.5% for AGIs $25k-50k, 86.7% for AGIs $50k-75k, 88.9% for AGIs $75k-100k, 100.0% for AGIs $100k-200k)
Averages for the 2012 tax year for zip code 75479, filed in 2013:
Average Adjusted Gross Income (AGI) in 2012: $42,847 (Individual Income Tax Returns)
Here:
$42,847
State:
$65,384
Salary/wage: $38,419 (reported on 86.3% of returns)
Here:
$38,419
State:
$52,524
(% of AGI for various income ranges: 74.6% for AGIs below $25k, 82.6% for AGIs $25k-50k, 86.6% for AGIs $50k-75k, 75.4% for AGIs $75k-100k, 64.5% for AGIs $100k-200k)
Taxable interest for individuals: $526 (reported on 26.0% of returns)
This zip code:
$526
Texas:
$2,372
(% of AGI for various income ranges: 0.7% for AGIs below $25k, 0.3% for AGIs $25k-50k, 0.1% for AGIs $50k-75k, 0.4% for AGIs $75k-100k, 0.3% for AGIs $100k-200k)
Ordinary dividends: $1,150 (reported on 8.2% of returns)
Here:
$1,150
State:
$9,721
(% of AGI for various income ranges: 0.4% for AGIs below $25k, 0.3% for AGIs $25k-50k, 0.5% for AGIs $75k-100k)
Net capital gain/loss in AGI: +$140 (reported on 6.8% of returns)
Here:
+$140
State:
+$35,319
Profit/loss from business: +$5,400 (reported on 13.7% of returns)
Here:
+$5,400
State:
+$13,732
(% of AGI for various income ranges: 7.9% for AGIs below $25k, 1.5% for AGIs $50k-75k, 2.0% for AGIs $75k-100k)
Taxable individual retirement arrangement distribution: $16,971 (reported on 9.6% of returns)
75479:
$16,971
Texas:
$19,511
Total itemized deductions: $21,083 (30% of AGI, reported on 16.4% of returns)
Here:
$21,083
State:
$24,724
Here:
29.9% of AGI
State:
15.9% of AGI
(% of AGI for various income ranges: 14.7% for AGIs below $25k, 9.1% for AGIs $50k-75k, 8.8% for AGIs $75k-100k, 10.5% for AGIs $100k-200k)
Charity contributions: $5,175 (reported on 11.0% of returns)
Here:
$5,175
State:
$6,808
(% of AGI for various income ranges: 1.5% for AGIs $50k-75k, 2.9% for AGIs $75k-100k, 1.7% for AGIs $100k-200k)
Taxes paid: $3,833 (reported on 16.4% of returns)
75479:
$3,833
State:
$6,921
(% of AGI for various income ranges: 1.6% for AGIs below $25k, 2.1% for AGIs $50k-75k, 1.9% for AGIs $75k-100k, 1.7% for AGIs $100k-200k)
Earned income credit: $2,053 (reported on 23.3% of returns)
Here:
$2,053
State:
$2,570
(% of AGI for various income ranges: 7.1% for AGIs below $25k, 1.3% for AGIs $25k-50k)
Percentage of individuals using paid preparers for their 2012 taxes: 54.8%
Here:
55%
State:
51%
(% for various income ranges: 53.3% for AGIs below $25k, 55.6% for AGIs $25k-50k, 53.8% for AGIs $50k-75k, 57.1% for AGIs $75k-100k, 60.0% for AGIs $100k-200k)
Averages for the 2004 tax year for zip code 75479, filed in 2005:
Average Adjusted Gross Income (AGI) in 2004: $39,988 (Individual Income Tax Returns)
Here:
$39,988
State:
$47,881
Salary/wage: $36,297 (reported on 84.5% of returns)
Here:
$36,297
State:
$41,947
(% of AGI for various income ranges: 181.9% for AGIs below $10k, 72.4% for AGIs $10k-25k, 85.9% for AGIs $25k-50k, 87.4% for AGIs $50k-75k, 85.9% for AGIs $75k-100k, 42.6% for AGIs over 100k)
Taxable interest for individuals: $1,053 (reported on 33.3% of returns)
This zip code:
$1,053
Texas:
$2,255
(% of AGI for various income ranges: 6.5% for AGIs below $10k, 2.9% for AGIs $10k-25k, 0.6% for AGIs $25k-50k, 0.2% for AGIs $50k-75k, 0.7% for AGIs $75k-100k, 0.7% for AGIs over 100k)
Taxable dividends: $1,435 (reported on 13.4% of returns)
Here:
$1,435
State:
$4,261
(% of AGI for various income ranges: 1.4% for AGIs below $10k, 1.3% for AGIs $10k-25k, 0.1% for AGIs $25k-50k, 0.3% for AGIs $50k-75k, 0.9% for AGIs over 100k)
Net capital gain/loss: +$10,072 (reported on 12.1% of returns)
Here:
+$10,072
State:
+$16,110
(% of AGI for various income ranges: -3.4% for AGIs below $10k, -0.1% for AGIs $10k-25k, 0.1% for AGIs $25k-50k, 0.0% for AGIs $50k-75k, 0.0% for AGIs $75k-100k, 14.3% for AGIs over 100k)
Profit/loss from business: +$4,774 (reported on 16.8% of returns)
Here:
+$4,774
State:
+$11,013
(% of AGI for various income ranges: 21.5% for AGIs below $10k, 6.0% for AGIs $10k-25k, 2.2% for AGIs $25k-50k, 1.8% for AGIs $50k-75k, 0.3% for AGIs $75k-100k)
Total itemized deductions: $16,889 (21% of AGI, reported on 15.8% of returns)
Here:
$16,889
State:
$19,631
Here:
20.8% of AGI
State:
18.9% of AGI
(% of AGI for various income ranges: 7.0% for AGIs $10k-25k, 6.4% for AGIs $25k-50k, 6.1% for AGIs $50k-75k, 9.0% for AGIs $75k-100k, 6.3% for AGIs over 100k)
Charity contributions deductions: $3,538 (4% of AGI, reported on 13.3% of returns)
Here:
$3,538
State:
$4,753
Here:
4.0% of AGI
State:
4.2% of AGI
(% of AGI for various income ranges: 1.5% for AGIs $10k-25k, 0.8% for AGIs $25k-50k, 1.3% for AGIs $50k-75k, 1.5% for AGIs $75k-100k, 1.1% for AGIs over 100k)
Total tax: $5,088 (reported on 76.4% of returns)
75479:
$5,088
State:
$9,058
(% of AGI for various income ranges: 5.7% for AGIs below $10k, 3.7% for AGIs $10k-25k, 6.5% for AGIs $25k-50k, 8.0% for AGIs $50k-75k, 10.5% for AGIs $75k-100k, 18.4% for AGIs over 100k)
Earned income credit: $1,767 (reported on 16.9% of returns)
Here:
$1,767
State:
$2,024
Percentage of individuals using paid preparers for their 2004 taxes: 62.6%
Here:
63%
State:
57%
(% for various income ranges: 54.8% for AGIs below $10k, 62.4% for AGIs $10k-25k, 66.7% for AGIs $25k-50k, 65.3% for AGIs $50k-75k, 60.4% for AGIs $75k-100k, 64.3% for AGIs over 100k)
Household received Food Stamps/SNAP in the past 12 months: 77 Household did not receive Food Stamps/SNAP in the past 12 months: 668
Women who had a birth in the past 12 months: 13 (13 now married, 0 unmarried) Women who did not have a birth in the past 12 months: 532 (192 now married, 340 unmarried)
Housing units in zip code 75479 with a mortgage: 257 Median monthly owner costs for units with a mortgage: $1,454 Median monthly owner costs for units without a mortgage: $507
Residents with income below the poverty level in 2022:
This zip code:
10.1%
Whole state:
14.0%
Residents with income below 50% of the poverty level in 2022:
This zip code:
8.1%
Whole state:
7.4%
Median number of rooms in houses and condos:
Here:
5.6
State:
6.3
Median number of rooms in apartments:
Here:
5.3
State:
4.0
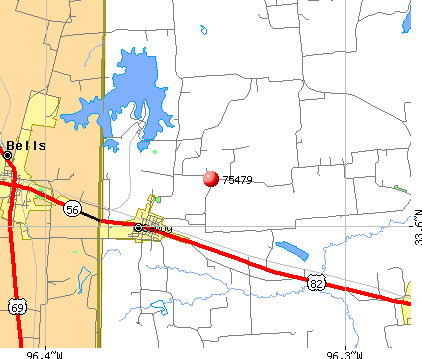
Notable locations in this zip code not listed on our city pages
Cemeteries: McNeely Cemetery (1), Carson Cemetery (2), Little Jordan Cemetery (3), Mount Zion Cemetery (4), Oak Hill Cemetery (5), Wrenn Cemetery (6), Coon Town Cemetery (7). Display/hide their locations on the map
Reservoirs: Klose Lake (A), Valley Lake (B), Soil Conservation Service Site 8 Reservoir (C), Soil Conservation Service Site 2 Reservoir (D), Soil Conservation Service Site 7 Reservoir (E). Display/hide their locations on the map
Streams, rivers, and creeks: Sheep Creek (A), Pattillo Branch (B), Sand Creek (C), Post Oak Creek (D), Mahurin Creek (E), Hutchins Creek (F), Ford Creek (G), Dameron Creek (H). Display/hide their locations on the map
In group quarters: 68 (-1 institutionalized population)
Size of family households: 317 2-persons, 70 3-persons, 115 4-persons, 36 5-persons, 2 6-persons, 18 7-or-more-persons
Size of nonfamily households: 164 1-person, 22 2-persons
173 married couples with children.
68 single-parent households (9 men, 59 women).
94.8% of residents of 75479 zip code speak English at home.
2.8% of residents speak Spanish at home (84% very well, 12% well, 4% not well).
0.4% of residents speak other Indo-European language at home (100% very well).
0.3% of residents speak Asian or Pacific Island language at home (100% very well).
1.5% of residents speak other language at home (100% very well).
Foreign born population: 73 (3.6%) (86.6% of them are naturalized citizens)
This zip code:
3.6%
Whole state:
17.2%
33%Hong Kong
13%Honduras
11%Singapore
15%Irish
14%American
12%English
8%German
2%Dutch
2%Italian
2%European
Year of entry for the foreign-born population
02010 or later
252000 to 2009
131990 to 1999
35Before 1990
Facilities with environmental interests located in this zip code:
ADDINGTON & SON (RT 1, BOX 105 in SAVOY, TX)
(Integrated Compliance Information System) - ICIS-06-2000-0194, FORMAL ENFORCEMENT ACTION Business SIC classification: MOTOR VEHICLE PARTS, USED; SCRAP AND WASTE MATERIALS
ADDINGTON & SON (10733 W US HIGHWAY 82 in SAVOY, TX)
National Pollutant Discharge Elimination System NON-MAJOR (Tracking pollutant discharge elimination systems) - permit
Housing units lacking complete plumbing facilities: 2.7% Housing units lacking complete kitchen facilities: 2.0%
57.0%Electricity
22.7%Utility gas
15.6%Bottled, tank, or LP gas
5.0%Wood
Population in 1990: 1,726. Population change in the 1990s: +29 (+1.7%).
Place of birth for U.S.-born residents:
This state: 1,437
Northeast: 42
Midwest: 164
South: 250
West: 88
65% of the 75479 zip code residents lived in the same house 5 years ago. Out of people who lived in different houses, 31% lived in this county. Out of people who lived in different counties, 50% lived in Texas.
84% of the 75479 zip code residents lived in the same house 1 year ago. Out of people who lived in different houses, 29% moved from this county. Out of people who lived in different houses, 41% moved from different county within same state. Out of people who lived in different houses, 33% moved from different state.
Private vs. public school enrollment:
Students in private schools in grades 1 to 8 (elementary and middle school): 35
Here:
22.6%
Texas:
8.8%
Students in private schools in grades 9 to 12 (high school): 29
Here:
30.9%
Texas:
8.0%
Students in private undergraduate colleges: 5
Here:
11.1%
Texas:
16.2%
Occupation by median earnings in the past 12 months ($)
67,732Health diagnosing and treating practitioners and other technical occupations
60,712Education, training, and library occupations
58,322Management occupations
57,381Construction and extraction occupations
53,320Installation, maintenance, and repair occupations
46,501Law enforcement workers including supervisors
Top industries in this zip code by the number of employees in 2005:
Health Care and Social Assistance: Nursing Care Facilities (50-99 employees: 1 establishment)
Construction: Plumbing, Heating, and Air-Conditioning Contractors (20-49: 1)
Utilities: Electric Power Distribution (20-49: 1)
Health Care and Social Assistance: Ambulance Services (20-49: 1)
Health Care and Social Assistance: Offices of Physical, Occupational and Speech Therapists, and Audiologists (5-9: 1)
Construction: New Single-Family Housing Construction (except Operative Builders) (1-4: 1)
Wholesale Trade: Wholesale Trade Agents and Brokers (1-4: 1)
People in group quarters in 2010:
105 people in nursing facilities/skilled-nursing facilities
People in group quarters in 2000:
97 people in nursing homes
Fatal accident statistics in 2014:
Fatal accident count: 1
Vehicles involved in fatal accidents: 2
Fatal accidents caused by drunken drivers: 0
Fatalities: 1
Persons involved in fatal accidents: 4
Pedestrians involved in fatal accidents: 0
Fatal accident statistics in 2010:
Fatal accident count: 1
Vehicles involved in fatal accidents: 3
Fatal accidents caused by drunken drivers: 0
Fatalities: 2
Persons involved in fatal accidents: 5
Pedestrians involved in fatal accidents: 0
2002 - 2018 National Fire Incident Reporting System (NFIRS) incidents
According to the data from the years 2002 - 2018 the average number of fire incidents per year is 9. The highest number of fire incidents - 29 took place in 2003, and the least - 1 in 2012. The data has an increasing trend.
When looking into fire subcategories, the most incidents belonged to: Outside Fires (66.2%), and Structure Fires (25.2%).
Fire incident types reported to NFIRS in Zip Code 75479


 Nearest zip codes: 75439, 75414, 75476, 75491, 74747, 75418.


 According to the data from the years 2002 - 2018 the average number of fire incidents per year is 9. The highest number of fire incidents - 29 took place in 2003, and the least - 1 in 2012. The data has an increasing trend.
 When looking into fire subcategories, the most incidents belonged to: Outside Fires (66.2%), and Structure Fires (25.2%).