Estimated zip code population in 2022: 2,849 Zip code population in 2010: 2,211 Zip code population in 2000: 1,554
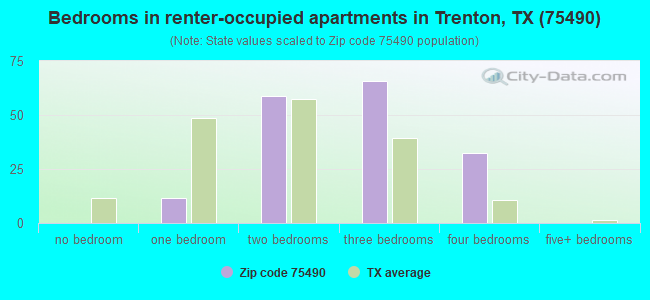
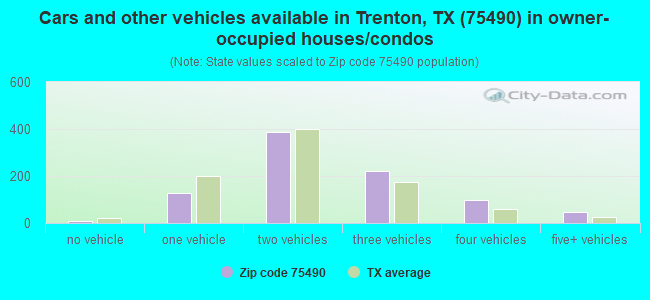
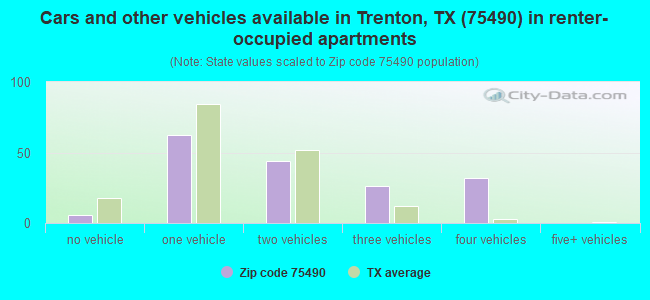
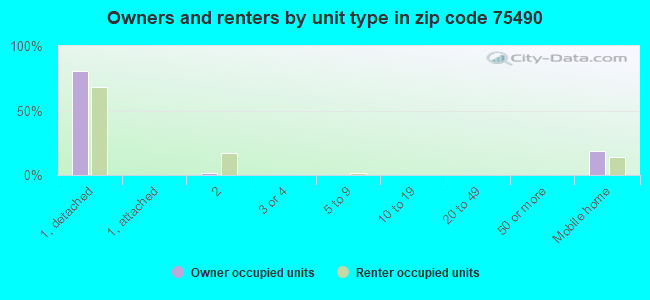
Houses and condos: 1,224 Renter-occupied apartments: 170
% of renters here:
16%
State:
38%
March 2022 cost of living index in zip code 75490: 81.3 (low, U.S. average is 100)
Land area: 29.3 sq. mi. Water area: 0.1 sq. mi.
Population density: 97 people per square mile
(very low).
OSM Map
General Map
Google Map
MSN Map
OSM Map
General Map
Google Map
MSN Map
OSM Map
General Map
Google Map
MSN Map
OSM Map
General Map
Google Map
MSN Map
Please wait while loading the map...
Real estate property taxes paid for housing units in 2022:
This zip code:
1.0% ($2,928)
Texas:
1.5% ($4,050)
Median real estate property taxes paid for housing units with mortgages in 2022: $3,099 (1.0%) Median real estate property taxes paid for housing units with no mortgage in 2022: $2,557 (1.1%)
Business Search- 14 Million verified businesses
Males: 1,473
(51.7%)
Females: 1,375
(48.3%)
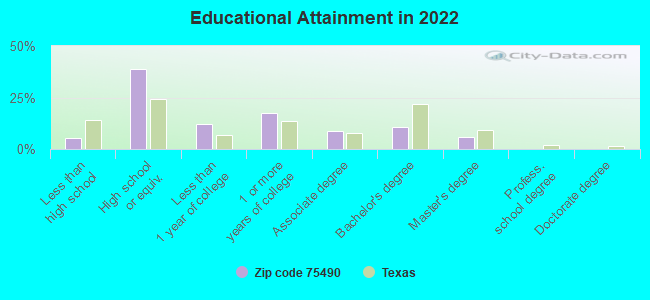
For population 25 years and over in 75490:
High school or higher: 93.7%
Bachelor's degree or higher: 16.8%
Graduate or professional degree: 6.2%
Unemployed: 1.2%
Mean travel time to work (commute): 37.1 minutes
For population 15 years and over in 75490:
Never married: 18.8%
Now married: 63.5%
Separated: 1.1%
Widowed: 3.5%
Divorced: 13.0%
Zip code 75490 compared to state average:
Unemployed percentage significantly below state average.
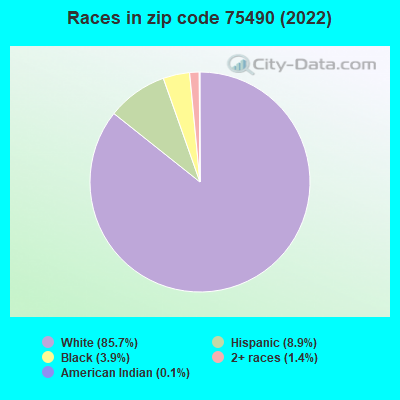
Black race population percentage significantly below state average.
Hispanic race population percentage significantly below state average.
Median age above state average.
Foreign-born population percentage significantly below state average.
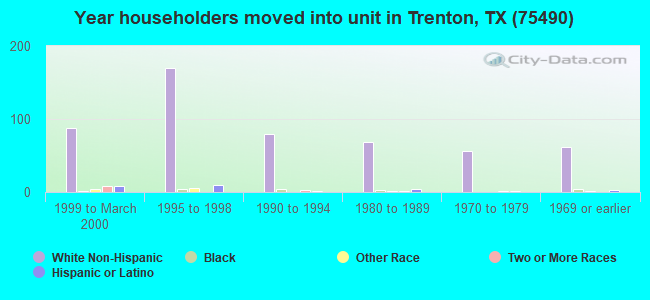
Renting percentage significantly below state average.
Length of stay since moving in above state average.
Number of college students below state average.
Percentage of population with a bachelor's degree or higher below state average.
Averages for the 2020 tax year for zip code 75490, filed in 2021:
Average Adjusted Gross Income (AGI) in 2020: $67,891 (Individual Income Tax Returns)
Here:
$67,891
State:
$77,054
Salary/wage: $62,859 (reported on 84.3% of returns)
Here:
$62,859
State:
$62,766
(% of AGI for various income ranges: 1079.2% for AGIs below $25k, 3897.7% for AGIs $25k-50k, 6086.7% for AGIs $50k-75k, 10352.5% for AGIs $75k-100k, 15094.4% for AGIs $100k-200k)
Taxable interest for individuals: $428 (reported on 22.8% of returns)
This zip code:
$428
Texas:
$2,665
(% of AGI for various income ranges: 9.6% for AGIs below $25k, 7.3% for AGIs $25k-50k, 20.7% for AGIs $50k-75k, 6.7% for AGIs $75k-100k, 16.7% for AGIs $100k-200k)
Ordinary dividends: $1,891 (reported on 8.7% of returns)
Here:
$1,891
State:
$10,044
(% of AGI for various income ranges: 25.2% for AGIs below $25k, 29.3% for AGIs $50k-75k, 56.1% for AGIs $100k-200k)
Net capital gain/loss in AGI: +$2,869 (reported on 10.2% of returns)
Here:
+$2,869
State:
+$39,590
(% of AGI for various income ranges: 16.8% for AGIs below $25k, 35.3% for AGIs $50k-75k, 154.4% for AGIs $100k-200k)
Profit/loss from business: +$11,870 (reported on 23.6% of returns)
Here:
+$11,870
State:
+$10,888
(% of AGI for various income ranges: 174.8% for AGIs below $25k, 324.5% for AGIs $25k-50k, 373.3% for AGIs $50k-75k, 271.7% for AGIs $75k-100k, 846.7% for AGIs $100k-200k)
Taxable individual retirement arrangement distribution: $17,189 (reported on 7.1% of returns)
75490:
$17,189
Texas:
$24,740
(% of AGI for various income ranges: 91.2% for AGIs below $25k, 424.0% for AGIs $50k-75k, 379.4% for AGIs $100k-200k)
Total itemized deductions: $32,322 (reported on 7.1% of returns)
Here:
$32,322
State:
$40,428
(% of AGI for various income ranges: 732.7% for AGIs $50k-75k, 1005.6% for AGIs $100k-200k)
Charity contributions: $9,517 (reported on 4.7% of returns)
Here:
$9,517
State:
$18,201
(% of AGI for various income ranges: 32.0% for AGIs below $25k, 272.8% for AGIs $100k-200k)
Taxes paid: $6,811 (reported on 7.1% of returns)
75490:
$6,811
State:
$7,821
(% of AGI for various income ranges: 155.3% for AGIs $50k-75k, 211.1% for AGIs $100k-200k)
Earned income credit: $2,506 (reported on 14.2% of returns)
Here:
$2,506
State:
$2,584
(% of AGI for various income ranges: 109.2% for AGIs below $25k, 80.9% for AGIs $25k-50k)
Percentage of individuals using paid preparers for their 2020 taxes: 91.3%
Here:
91%
State:
92%
(% for various income ranges: 87.9% for AGIs below $25k, 89.7% for AGIs $25k-50k, 94.7% for AGIs $50k-75k, 94.1% for AGIs $75k-100k, 92.0% for AGIs $100k-200k, 100.0% for AGIs over 200k)
Averages for the 2012 tax year for zip code 75490, filed in 2013:
Average Adjusted Gross Income (AGI) in 2012: $50,929 (Individual Income Tax Returns)
Here:
$50,929
State:
$65,384
Salary/wage: $48,978 (reported on 81.8% of returns)
Here:
$48,978
State:
$52,524
(% of AGI for various income ranges: 79.1% for AGIs below $25k, 77.4% for AGIs $25k-50k, 82.5% for AGIs $50k-75k, 84.3% for AGIs $75k-100k, 74.4% for AGIs $100k-200k)
Taxable interest for individuals: $1,021 (reported on 28.3% of returns)
This zip code:
$1,021
Texas:
$2,372
(% of AGI for various income ranges: 1.0% for AGIs below $25k, 0.8% for AGIs $25k-50k, 0.3% for AGIs $50k-75k, 0.2% for AGIs $75k-100k, 0.7% for AGIs $100k-200k)
Ordinary dividends: $1,373 (reported on 11.1% of returns)
Here:
$1,373
State:
$9,721
(% of AGI for various income ranges: 0.7% for AGIs below $25k, 0.3% for AGIs $25k-50k, 0.2% for AGIs $50k-75k, 0.4% for AGIs $100k-200k)
Net capital gain/loss in AGI: +$230 (reported on 10.1% of returns)
Here:
+$230
State:
+$35,319
(% of AGI for various income ranges: 0.6% for AGIs $50k-75k)
Profit/loss from business: +$8,561 (reported on 23.2% of returns)
Here:
+$8,561
State:
+$13,732
(% of AGI for various income ranges: 7.8% for AGIs below $25k, 6.8% for AGIs $25k-50k, 3.2% for AGIs $50k-75k, 3.8% for AGIs $75k-100k, 2.0% for AGIs $100k-200k)
Taxable individual retirement arrangement distribution: $17,290 (reported on 10.1% of returns)
75490:
$17,290
Texas:
$19,511
(% of AGI for various income ranges: 3.1% for AGIs below $25k, 4.0% for AGIs $25k-50k, 4.9% for AGIs $50k-75k, 4.4% for AGIs $100k-200k)
Total itemized deductions: $18,714 (22% of AGI, reported on 28.3% of returns)
Here:
$18,714
State:
$24,724
Here:
22.4% of AGI
State:
15.9% of AGI
(% of AGI for various income ranges: 7.3% for AGIs below $25k, 9.2% for AGIs $25k-50k, 11.4% for AGIs $50k-75k, 10.2% for AGIs $75k-100k, 11.3% for AGIs $100k-200k)
Charity contributions: $3,750 (reported on 20.2% of returns)
Here:
$3,750
State:
$6,808
(% of AGI for various income ranges: 1.4% for AGIs $25k-50k, 1.5% for AGIs $50k-75k, 1.1% for AGIs $75k-100k, 2.0% for AGIs $100k-200k)
Taxes paid: $4,600 (reported on 27.3% of returns)
75490:
$4,600
State:
$6,921
(% of AGI for various income ranges: 1.2% for AGIs below $25k, 1.8% for AGIs $25k-50k, 2.2% for AGIs $50k-75k, 2.9% for AGIs $75k-100k, 3.0% for AGIs $100k-200k)
Earned income credit: $2,137 (reported on 19.2% of returns)
Here:
$2,137
State:
$2,570
(% of AGI for various income ranges: 6.9% for AGIs below $25k, 1.2% for AGIs $25k-50k)
Percentage of individuals using paid preparers for their 2012 taxes: 47.5%
Here:
47%
State:
51%
(% for various income ranges: 38.9% for AGIs below $25k, 50.0% for AGIs $25k-50k, 50.0% for AGIs $50k-75k, 50.0% for AGIs $75k-100k, 61.5% for AGIs $100k-200k)
Averages for the 2004 tax year for zip code 75490, filed in 2005:
Average Adjusted Gross Income (AGI) in 2004: $42,255 (Individual Income Tax Returns)
Here:
$42,255
State:
$47,881
Salary/wage: $41,112 (reported on 85.0% of returns)
Here:
$41,112
State:
$41,947
(% of AGI for various income ranges: 86.7% for AGIs below $10k, 75.1% for AGIs $10k-25k, 79.3% for AGIs $25k-50k, 89.8% for AGIs $50k-75k, 84.6% for AGIs $75k-100k, 78.5% for AGIs over 100k)
Taxable interest for individuals: $698 (reported on 36.3% of returns)
This zip code:
$698
Texas:
$2,255
(% of AGI for various income ranges: 3.8% for AGIs below $10k, 1.7% for AGIs $10k-25k, 0.7% for AGIs $25k-50k, 0.4% for AGIs $50k-75k, 0.2% for AGIs $75k-100k, 0.3% for AGIs over 100k)
Taxable dividends: $886 (reported on 13.1% of returns)
Here:
$886
State:
$4,261
(% of AGI for various income ranges: 0.4% for AGIs $10k-25k, 0.6% for AGIs $25k-50k, 0.1% for AGIs $50k-75k, 0.1% for AGIs $75k-100k, 0.3% for AGIs over 100k)
Net capital gain/loss: +$1,345 (reported on 10.5% of returns)
Here:
+$1,345
State:
+$16,110
(% of AGI for various income ranges: 0.6% for AGIs $10k-25k, 1.3% for AGIs $25k-50k, -0.2% for AGIs $50k-75k, 0.0% for AGIs over 100k)
Profit/loss from business: +$6,727 (reported on 23.3% of returns)
Here:
+$6,727
State:
+$11,013
(% of AGI for various income ranges: -0.2% for AGIs below $10k, 10.2% for AGIs $10k-25k, 7.4% for AGIs $25k-50k, 3.9% for AGIs $50k-75k, 0.8% for AGIs $75k-100k, -0.7% for AGIs over 100k)
IRA payment deduction: $3,800 (reported on 1.9% of returns)
75490:
$3,800
Texas:
$3,120
Total itemized deductions: $15,498 (23% of AGI, reported on 27.1% of returns)
Here:
$15,498
State:
$19,631
Here:
22.6% of AGI
State:
18.9% of AGI
(% of AGI for various income ranges: 12.3% for AGIs $10k-25k, 8.0% for AGIs $25k-50k, 10.4% for AGIs $50k-75k, 10.2% for AGIs $75k-100k, 11.0% for AGIs over 100k)
Charity contributions deductions: $3,412 (5% of AGI, reported on 21.2% of returns)
Here:
$3,412
State:
$4,753
Here:
4.8% of AGI
State:
4.2% of AGI
(% of AGI for various income ranges: 1.5% for AGIs $10k-25k, 1.0% for AGIs $25k-50k, 1.8% for AGIs $50k-75k, 1.7% for AGIs $75k-100k, 2.7% for AGIs over 100k)
Total tax: $5,333 (reported on 76.4% of returns)
75490:
$5,333
State:
$9,058
(% of AGI for various income ranges: 2.5% for AGIs below $10k, 4.0% for AGIs $10k-25k, 6.7% for AGIs $25k-50k, 8.7% for AGIs $50k-75k, 10.6% for AGIs $75k-100k, 16.4% for AGIs over 100k)
Earned income credit: $1,699 (reported on 16.6% of returns)
Here:
$1,699
State:
$2,024
Percentage of individuals using paid preparers for their 2004 taxes: 55.6%
Here:
56%
State:
57%
(% for various income ranges: 40.6% for AGIs below $10k, 61.6% for AGIs $10k-25k, 61.0% for AGIs $25k-50k, 51.0% for AGIs $50k-75k, 52.7% for AGIs $75k-100k, 70.0% for AGIs over 100k)
Likely homosexual households (counted as self-reported same-sex unmarried-partner households)
Lesbian couples: 0.6% of all households
Gay men: 0.0% of all households
Household received Food Stamps/SNAP in the past 12 months: 108 Household did not receive Food Stamps/SNAP in the past 12 months: 948
Women who had a birth in the past 12 months: 14 (14 now married, 0 unmarried) Women who did not have a birth in the past 12 months: 666 (414 now married, 248 unmarried)
Housing units in zip code 75490 with a mortgage: 538 (1 second mortgage, 2 both second mortgage and home equity loan) Median monthly owner costs for units with a mortgage: $1,839 Median monthly owner costs for units without a mortgage: $729
Residents with income below the poverty level in 2022:
This zip code:
8.6%
Whole state:
14.0%
Residents with income below 50% of the poverty level in 2022:
This zip code:
7.1%
Whole state:
7.4%
Median number of rooms in houses and condos:
Here:
6.1
State:
6.3
Median number of rooms in apartments:
Here:
4.7
State:
4.0
Notable locations in this zip code not listed on our city pages
Size of family households: 423 2-persons, 128 3-persons, 124 4-persons, 55 5-persons, 58 6-persons, 11 7-or-more-persons
Size of nonfamily households: 163 1-person, 85 2-persons, 7 3-persons
489 married couples with children.
105 single-parent households (34 men, 71 women).
96.1% of residents of 75490 zip code speak English at home.
3.6% of residents speak Spanish at home (81% very well, 11% well, 7% not well).
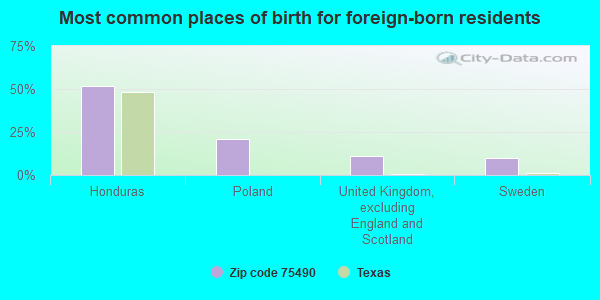
Foreign born population: 88 (3.1%) (16.2% of them are naturalized citizens)
This zip code:
3.1%
Whole state:
17.2%
52%Honduras
21%Poland
11%United Kingdom, excluding England and Scotland
10%Sweden
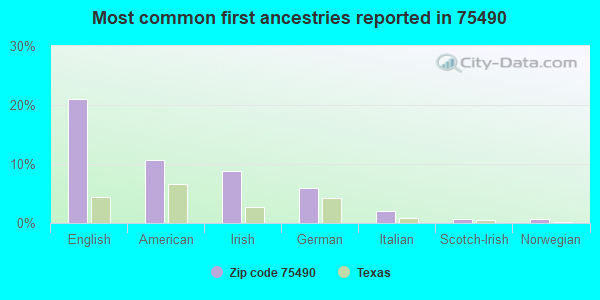
21%English
11%American
9%Irish
6%German
2%Italian
1%Scotch-Irish
1%Norwegian
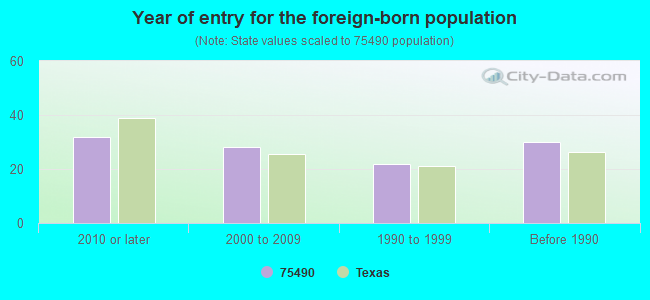
Year of entry for the foreign-born population
322010 or later
282000 to 2009
221990 to 1999
30Before 1990
Housing units lacking complete plumbing facilities: 3.0% Housing units lacking complete kitchen facilities: 5.1%
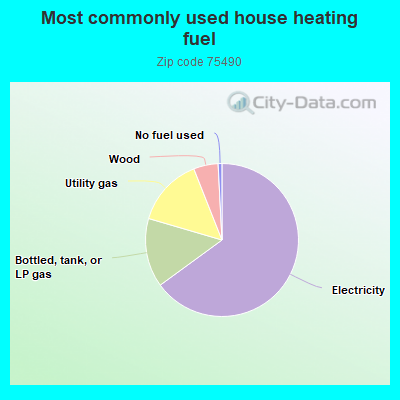
65.1%Electricity
14.6%Bottled, tank, or LP gas
14.5%Utility gas
5.2%Wood
0.8%No fuel used
Population in 1990: 1,776.
Place of birth for U.S.-born residents:
This state: 2,039
Northeast: 57
Midwest: 194
South: 322
West: 106
59% of the 75490 zip code residents lived in the same house 5 years ago. Out of people who lived in different houses, 23% lived in this county. Out of people who lived in different counties, 50% lived in Texas.
92% of the 75490 zip code residents lived in the same house 1 year ago. Out of people who lived in different houses, 4% moved from this county. Out of people who lived in different houses, 101% moved from different county within same state.
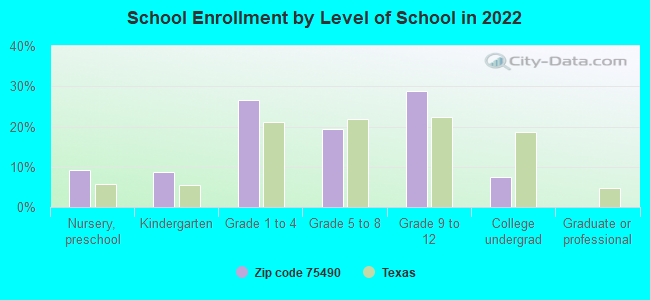
Private vs. public school enrollment:
Students in private schools in grades 1 to 8 (elementary and middle school): 15
Here:
5.4%
Texas:
8.8%
Students in private schools in grades 9 to 12 (high school):
Here:
0.0%
Texas:
8.0%
Students in private undergraduate colleges: 6
Here:
14.7%
Texas:
16.2%
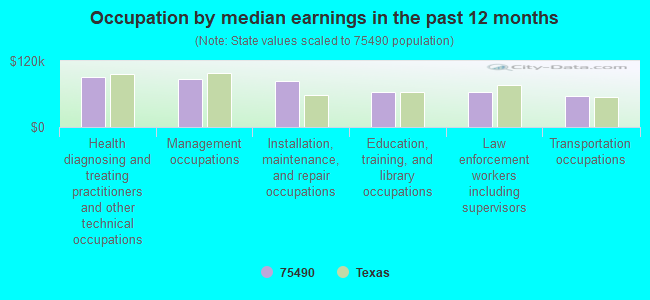
Occupation by median earnings in the past 12 months ($)
91,745Health diagnosing and treating practitioners and other technical occupations
87,868Management occupations
83,775Installation, maintenance, and repair occupations
63,644Education, training, and library occupations
62,904Law enforcement workers including supervisors
56,867Transportation occupations
Top industries in this zip code by the number of employees in 2005:
Finance and Insurance: Commercial Banking (20-49 employees: 1 establishment)
Other Services (except Public Administration): Religious Organizations (5-9: 1, 1-4: 1)
Fatal accident statistics in 2013:
Fatal accident count: 1
Vehicles involved in fatal accidents: 1
Fatal accidents caused by drunken drivers: 0
Fatalities: 1
Persons involved in fatal accidents: 1
Pedestrians involved in fatal accidents: 0
Fatal accident statistics in 2012:
Fatal accident count: 2
Vehicles involved in fatal accidents: 3
Fatal accidents caused by drunken drivers: 0
Fatalities: 2
Persons involved in fatal accidents: 4
Pedestrians involved in fatal accidents: 0
2003 - 2018 National Fire Incident Reporting System (NFIRS) incidents
According to the data from the years 2003 - 2018 the average number of fire incidents per year is 10. The highest number of fires - 56 took place in 2017, and the least - 0 in 2005. The data has a rising trend.
When looking into fire subcategories, the most reports belonged to: Outside Fires (52.7%), and Structure Fires (39.4%).
Fire incident types reported to NFIRS in Zip Code 75490

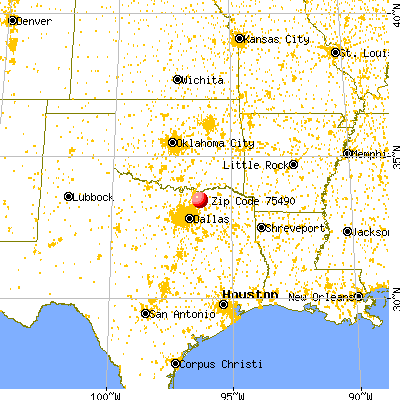


 Nearest zip codes: 75475, 75452, 75491, 75439, 75413, 75424.


 According to the data from the years 2003 - 2018 the average number of fire incidents per year is 10. The highest number of fires - 56 took place in 2017, and the least - 0 in 2005. The data has a rising trend.
 When looking into fire subcategories, the most reports belonged to: Outside Fires (52.7%), and Structure Fires (39.4%).