Estimated zip code population in 2022: 2,097 Zip code population in 2010: 1,636 Zip code population in 2000: 1,438
March 2022 cost of living index in zip code 75558: 75.8 (low, U.S. average is 100)
Land area: 50.3 sq. mi. Water area: 0.7 sq. mi.
Population density: 42 people per square mile
(very low).
OSM Map
General Map
Google Map
MSN Map
OSM Map
General Map
Google Map
MSN Map
OSM Map
General Map
Google Map
MSN Map
OSM Map
General Map
Google Map
MSN Map
Please wait while loading the map...
Real estate property taxes paid for housing units in 2022:
This zip code:
1.4% ($1,666)
Texas:
1.5% ($4,050)
Median real estate property taxes paid for housing units with mortgages in 2022: $1,553 (1.4%) Median real estate property taxes paid for housing units with no mortgage in 2022: $1,724 (1.4%)
Business Search- 14 Million verified businesses
Males: 1,000
(47.7%)
Females: 1,097
(52.3%)
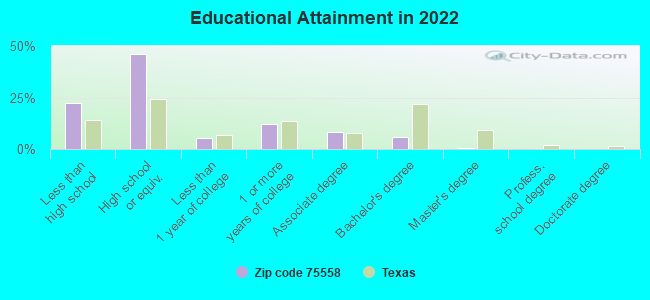
For population 25 years and over in 75558:
High school or higher: 76.8%
Bachelor's degree or higher: 6.0%
Graduate or professional degree: 0.4%
Mean travel time to work (commute): 27.0 minutes
For population 15 years and over in 75558:
Never married: 17.3%
Now married: 70.3%
Separated: 0.0%
Widowed: 1.9%
Divorced: 10.5%
Zip code 75558 compared to state average:
Median house value significantly below state average.
Unemployed percentage significantly below state average.
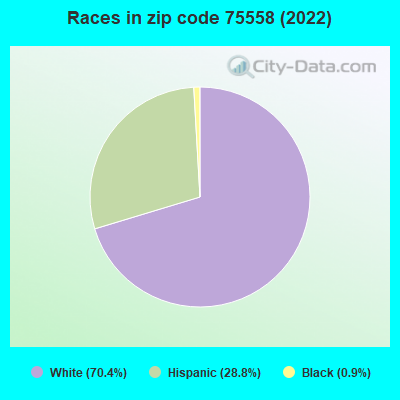
Black race population percentage significantly below state average.
Median age significantly above state average.
Renting percentage significantly below state average.
Length of stay since moving in significantly above state average.
Number of college students significantly below state average.
Percentage of population with a bachelor's degree or higher significantly below state average.
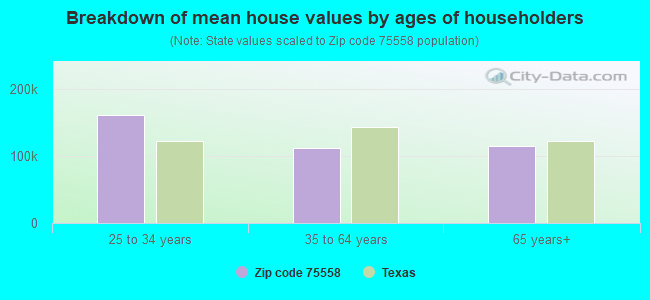
Estimated median house/condo value in 2022: $115,599
75558:
$115,599
Texas:
$275,400
According to our research of Texas and other state lists, there were 4 registered sex offenders living in 75558 zip code as of May 28, 2024. The ratio of all residents to sex offenders in zip code 75558 is 449 to 1. The ratio of registered sex offenders to all residents in this zip code is near the state average.
Median resident age:
This zip code:
44.3 years
Texas median age:
35.6 years
Average household size:
This zip code:
3.0 people
Texas:
2.6 people
Averages for the 2020 tax year for zip code 75558, filed in 2021:
Average Adjusted Gross Income (AGI) in 2020: $52,500 (Individual Income Tax Returns)
Here:
$52,500
State:
$77,054
Salary/wage: $48,869 (reported on 81.8% of returns)
Here:
$48,869
State:
$62,766
(% of AGI for various income ranges: 1218.1% for AGIs below $25k, 3745.6% for AGIs $25k-50k, 7190.0% for AGIs $50k-75k, 8055.0% for AGIs $75k-100k, 18886.0% for AGIs $100k-200k)
Taxable interest for individuals: $893 (reported on 22.7% of returns)
This zip code:
$893
Texas:
$2,665
(% of AGI for various income ranges: 4.4% for AGIs below $25k, 7.8% for AGIs $25k-50k, 54.3% for AGIs $50k-75k, 52.5% for AGIs $75k-100k, 108.0% for AGIs $100k-200k)
Ordinary dividends: $1,700 (reported on 9.1% of returns)
Here:
$1,700
State:
$10,044
(% of AGI for various income ranges: 77.1% for AGIs $50k-75k, 96.0% for AGIs $100k-200k)
Net capital gain/loss in AGI: +$7,350 (reported on 9.1% of returns)
Here:
+$7,350
State:
+$39,590
(% of AGI for various income ranges: 267.1% for AGIs $50k-75k, 508.0% for AGIs $100k-200k)
Profit/loss from business: +$11,542 (reported on 18.2% of returns)
Here:
+$11,542
State:
+$10,888
(% of AGI for various income ranges: 90.6% for AGIs below $25k, 121.1% for AGIs $25k-50k, 495.7% for AGIs $50k-75k, 1350.0% for AGIs $100k-200k)
Taxable individual retirement arrangement distribution: $21,425 (reported on 6.1% of returns)
75558:
$21,425
Texas:
$24,740
(% of AGI for various income ranges: 133.8% for AGIs below $25k, 918.6% for AGIs $50k-75k)
Earned income credit: $2,877 (reported on 19.7% of returns)
Here:
$2,877
State:
$2,584
(% of AGI for various income ranges: 133.8% for AGIs below $25k, 88.9% for AGIs $25k-50k)
Percentage of individuals using paid preparers for their 2020 taxes: 92.4%
Here:
92%
State:
92%
(% for various income ranges: 95.2% for AGIs below $25k, 90.5% for AGIs $25k-50k, 90.9% for AGIs $50k-75k, 100.0% for AGIs $75k-100k, 87.5% for AGIs $100k-200k)
Averages for the 2012 tax year for zip code 75558, filed in 2013:
Average Adjusted Gross Income (AGI) in 2012: $48,394 (Individual Income Tax Returns)
Here:
$48,394
State:
$65,384
Salary/wage: $42,353 (reported on 85.9% of returns)
Here:
$42,353
State:
$52,524
(% of AGI for various income ranges: 83.0% for AGIs below $25k, 80.9% for AGIs $25k-50k, 84.6% for AGIs $50k-75k, 88.8% for AGIs $75k-100k, 59.5% for AGIs $100k-200k)
Taxable interest for individuals: $1,340 (reported on 23.4% of returns)
This zip code:
$1,340
Texas:
$2,372
(% of AGI for various income ranges: 0.2% for AGIs below $25k, 1.4% for AGIs $25k-50k, 0.2% for AGIs $50k-75k, 0.3% for AGIs $75k-100k, 0.7% for AGIs $100k-200k)
Ordinary dividends: $940 (reported on 7.8% of returns)
Here:
$940
State:
$9,721
Net capital gain/loss in AGI: +$67 (reported on 9.4% of returns)
Here:
+$67
State:
+$35,319
Profit/loss from business: +$13,464 (reported on 17.2% of returns)
Here:
+$13,464
State:
+$13,732
(% of AGI for various income ranges: 11.8% for AGIs below $25k, 5.4% for AGIs $25k-50k, 6.5% for AGIs $100k-200k)
Taxable individual retirement arrangement distribution: $13,120 (reported on 7.8% of returns)
75558:
$13,120
Texas:
$19,511
Total itemized deductions: $21,640 (24% of AGI, reported on 15.6% of returns)
Here:
$21,640
State:
$24,724
Here:
23.6% of AGI
State:
15.9% of AGI
(% of AGI for various income ranges: 15.2% for AGIs below $25k, 13.8% for AGIs $50k-75k, 8.0% for AGIs $100k-200k)
Charity contributions: $6,467 (reported on 9.4% of returns)
Here:
$6,467
State:
$6,808
Taxes paid: $3,650 (reported on 15.6% of returns)
75558:
$3,650
State:
$6,921
(% of AGI for various income ranges: 1.9% for AGIs below $25k, 2.0% for AGIs $50k-75k, 1.7% for AGIs $100k-200k)
Earned income credit: $2,325 (reported on 25.0% of returns)
Here:
$2,325
State:
$2,570
(% of AGI for various income ranges: 8.4% for AGIs below $25k, 1.2% for AGIs $25k-50k)
Percentage of individuals using paid preparers for their 2012 taxes: 60.9%
Here:
61%
State:
51%
(% for various income ranges: 51.9% for AGIs below $25k, 58.8% for AGIs $25k-50k, 55.6% for AGIs $50k-75k, 80.0% for AGIs $75k-100k, 100.0% for AGIs $100k-200k)
Averages for the 2004 tax year for zip code 75558, filed in 2005:
Average Adjusted Gross Income (AGI) in 2004: $35,353 (Individual Income Tax Returns)
Here:
$35,353
State:
$47,881
Salary/wage: $32,665 (reported on 86.1% of returns)
Here:
$32,665
State:
$41,947
(% of AGI for various income ranges: 100.3% for AGIs below $10k, 76.1% for AGIs $10k-25k, 86.8% for AGIs $25k-50k, 83.4% for AGIs $50k-75k, 83.5% for AGIs $75k-100k, 64.9% for AGIs over 100k)
Taxable interest for individuals: $1,120 (reported on 30.2% of returns)
This zip code:
$1,120
Texas:
$2,255
(% of AGI for various income ranges: 0.6% for AGIs below $10k, 0.7% for AGIs $10k-25k, 1.3% for AGIs $25k-50k, 0.9% for AGIs $50k-75k, 0.5% for AGIs $75k-100k, 1.2% for AGIs over 100k)
Taxable dividends: $348 (reported on 10.4% of returns)
Here:
$348
State:
$4,261
(% of AGI for various income ranges: 0.4% for AGIs $10k-25k, 0.0% for AGIs $25k-50k, 0.1% for AGIs $50k-75k, 0.1% for AGIs over 100k)
Net capital gain/loss: +$2,581 (reported on 11.7% of returns)
Here:
+$2,581
State:
+$16,110
(% of AGI for various income ranges: -0.5% for AGIs $10k-25k, 0.6% for AGIs $25k-50k, 0.5% for AGIs $50k-75k, 1.4% for AGIs $75k-100k, 1.9% for AGIs over 100k)
Profit/loss from business: +$7,553 (reported on 16.2% of returns)
Here:
+$7,553
State:
+$11,013
(% of AGI for various income ranges: 14.2% for AGIs below $10k, 11.6% for AGIs $10k-25k, 3.6% for AGIs $25k-50k, 0.9% for AGIs $75k-100k, 2.4% for AGIs over 100k)
Total itemized deductions: $16,975 (22% of AGI, reported on 12.6% of returns)
Here:
$16,975
State:
$19,631
Here:
22.4% of AGI
State:
18.9% of AGI
(% of AGI for various income ranges: 21.0% for AGIs below $10k, 4.5% for AGIs $25k-50k, 5.5% for AGIs $50k-75k, 6.6% for AGIs $75k-100k, 9.3% for AGIs over 100k)
Charity contributions deductions: $4,875 (6% of AGI, reported on 8.8% of returns)
Here:
$4,875
State:
$4,753
Here:
5.6% of AGI
State:
4.2% of AGI
(% of AGI for various income ranges: 1.1% for AGIs $10k-25k, 0.7% for AGIs $50k-75k, 1.3% for AGIs $75k-100k, 3.1% for AGIs over 100k)
Total tax: $5,318 (reported on 66.3% of returns)
75558:
$5,318
State:
$9,058
(% of AGI for various income ranges: 3.1% for AGIs below $10k, 4.3% for AGIs $10k-25k, 6.1% for AGIs $25k-50k, 8.6% for AGIs $50k-75k, 10.9% for AGIs $75k-100k, 18.8% for AGIs over 100k)
Earned income credit: $2,064 (reported on 22.0% of returns)
Here:
$2,064
State:
$2,024
Percentage of individuals using paid preparers for their 2004 taxes: 65.4%
Here:
65%
State:
57%
(% for various income ranges: 56.6% for AGIs below $10k, 67.2% for AGIs $10k-25k, 60.3% for AGIs $25k-50k, 69.5% for AGIs $50k-75k, 78.3% for AGIs $75k-100k, 90.6% for AGIs over 100k)
Household received Food Stamps/SNAP in the past 12 months: 157 Household did not receive Food Stamps/SNAP in the past 12 months: 552
Women who had a birth in the past 12 months: 27 (28 now married, 0 unmarried) Women who did not have a birth in the past 12 months: 358 (159 now married, 199 unmarried)
Housing units in zip code 75558 with a mortgage: 113 Median monthly owner costs for units with a mortgage: $1,082 Median monthly owner costs for units without a mortgage: $505
Residents with income below the poverty level in 2022:
This zip code:
7.1%
Whole state:
14.0%
Residents with income below 50% of the poverty level in 2022:
This zip code:
5.3%
Whole state:
7.4%
Median number of rooms in houses and condos:
Here:
5.3
State:
6.3
Notable locations in this zip code not listed on our city pages
Streams, rivers, and creeks: East Fork Horse Creek (A), West Fork Horse Creek (B), Taylor Creek (C), Sand Springs Branch (D), Lacy Creek (E). Display/hide their locations on the map
Year house built (houses)
02020 or later
1102010 to 2019
772000 to 2009
1871990 to 1999
1531980 to 1989
461970 to 1979
871960 to 1969
161950 to 1959
01940 to 1949
141939 or earlier
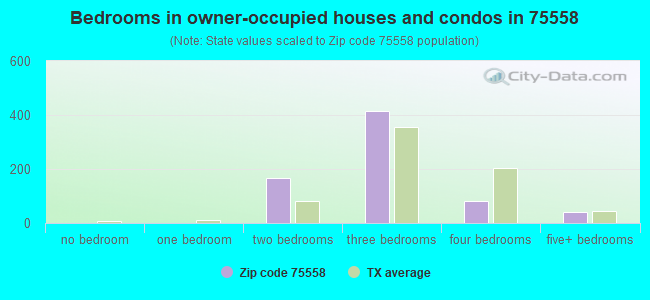
Bedrooms in owner-occupied houses and condos in 75558
0no bedroom
01 bedroom
1662 bedrooms
4163 bedrooms
804 bedrooms
425+ bedrooms
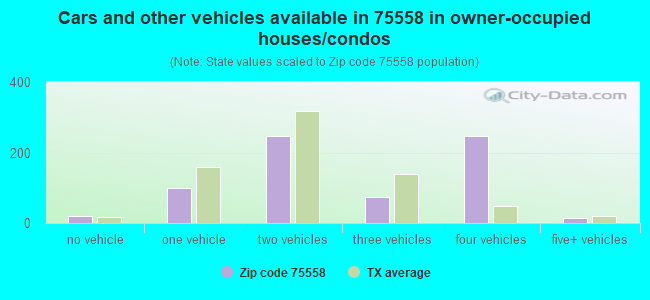
Cars and other vehicles available in 75558 in owner-occupied houses/condos
20no vehicle
1001 vehicle
2472 vehicles
743 vehicles
2464 vehicles
155+ vehicles
Zip code 75558 household income distribution in 2022
17$10,000 to $14,999
15$20,000 to $24,999
9$25,000 to $29,999
15$30,000 to $34,999
21$35,000 to $39,999
86$40,000 to $44,999
7$45,000 to $49,999
61$50,000 to $59,999
74$60,000 to $74,999
288$75,000 to $99,999
29$100,000 to $124,999
39$125,000 to $149,999
44$150,000 to $199,999
Estimate of home value of owner-occupied houses/condos in 2022 in zip code 75558
13$25,000 to $29,999
14$30,000 to $34,999
14$35,000 to $39,999
11$40,000 to $49,999
114$50,000 to $59,999
19$60,000 to $69,999
29$80,000 to $89,999
45$90,000 to $99,999
133$100,000 to $124,999
6$150,000 to $174,999
49$175,000 to $199,999
42$200,000 to $249,999
25$300,000 to $399,999
28$400,000 to $499,999
39$2,000,000 or more
Estimated median house (or condo) value in 2022 for:
White Non-Hispanic householders: $117,875
Estimated median house or condo value in 2022: $115,599
75558:
$115,599
Texas:
$275,400
Lower value quartile - upper value quartile: $67,064 - $202,684
Mean price in 2022:
Detached houses: $384,907
Here:
$384,907
State:
$369,058
Mobile homes: $92,719
Here:
$92,719
State:
$124,413
Housing units in structures:
One, detached: 437
Mobile homes: 270
Means of transportation to work in zip code 75558
74.0%573Drove a car alone
4.1%32Carpooled
17.2%133Other means
3.9%30Worked at home
Travel time to work (commute) in zip code 75558
14610 to 14 minutes
5715 to 19 minutes
28620 to 24 minutes
5425 to 29 minutes
4130 to 34 minutes
3145 to 59 minutes
10360 to 89 minutes
Percentage of zip code residents living and working in this county: 81.1%
Household type by relationship:
Households: 2,097
Male householders: 347 (36 living alone), Female householders: 360 (18 living alone)
Size of family households: 159 2-persons, 183 3-persons, 27 4-persons, 191 5-persons, 56 6-persons, 9 7-or-more-persons
Size of nonfamily households: 54 1-person, 15 2-persons
453 married couples with children.
33 single-parent households (24 men, 9 women).
75.3% of residents of 75558 zip code speak English at home.
24.1% of residents speak Spanish at home (27% very well, 22% well, 51% not well).
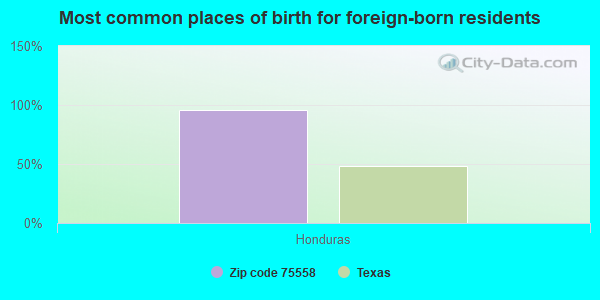
Foreign born population: 415 (19.8%) (16.5% of them are naturalized citizens)
This zip code:
19.8%
Whole state:
17.2%
96%Honduras
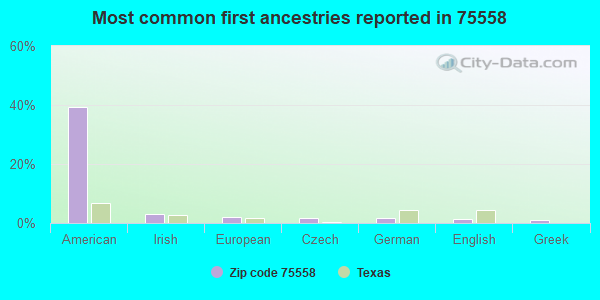
39%American
3%Irish
2%European
2%Czech
2%German
1%English
1%Greek
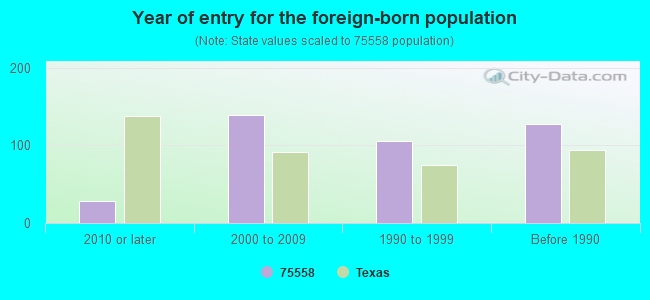
Year of entry for the foreign-born population
282010 or later
1392000 to 2009
1051990 to 1999
127Before 1990
Housing units lacking complete plumbing facilities: 3.3%
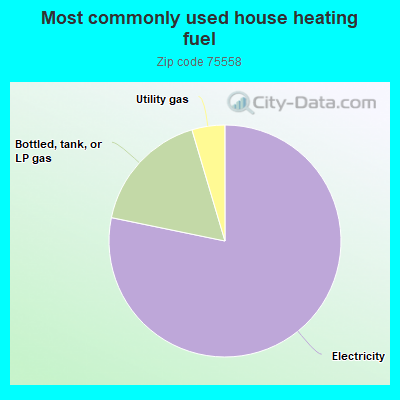
78.4%Electricity
17.2%Bottled, tank, or LP gas
4.6%Utility gas
Population in 1990: 2,050.
Place of birth for U.S.-born residents:
This state: 1,395
Northeast: 21
Midwest: 31
South: 58
West: 159
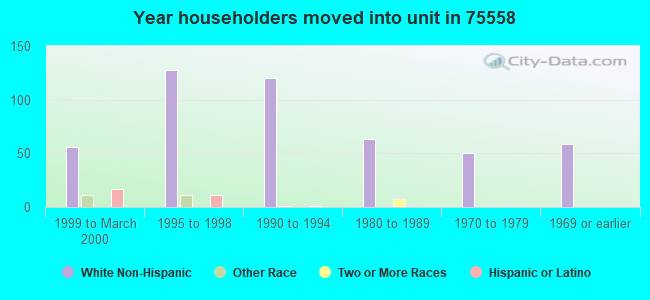
61% of the 75558 zip code residents lived in the same house 5 years ago. Out of people who lived in different houses, 61% lived in this county. Out of people who lived in different counties, 50% lived in Texas.
99% of the 75558 zip code residents lived in the same house 1 year ago. Out of people who lived in different houses, 24% moved from this county. Out of people who lived in different houses, 100% moved from different county within same state.
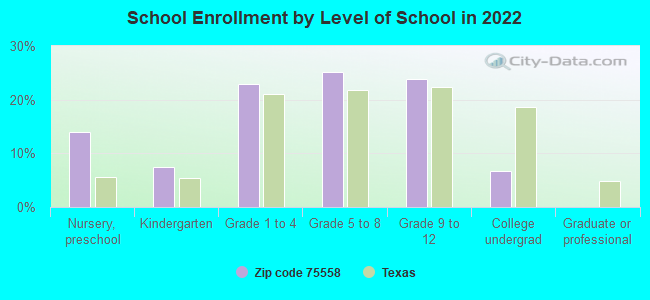
Private vs. public school enrollment:
Students in private schools in grades 1 to 8 (elementary and middle school): 33
Here:
15.8%
Texas:
8.8%
Students in private schools in grades 9 to 12 (high school): 15
Here:
14.9%
Texas:
8.0%
Students in private undergraduate colleges:
Here:
0.0%
Texas:
16.2%
Occupation by median earnings in the past 12 months ($)
52,895Sales and related occupations
30,571Office and administrative support occupations
11,854Education, training, and library occupations
Top industries in this zip code by the number of employees in 2005:
Construction: Highway, Street, and Bridge Construction (10-19 employees: 1 establishment)
Other Services (except Public Administration): Religious Organizations (5-9: 1)
Finance and Insurance: Portfolio Management (1-4: 1)
Administrative and Support and Waste Management and Remediation Services: Landscaping Services (1-4: 1)
2003 - 2018 National Fire Incident Reporting System (NFIRS) incidents
Based on the data from the years 2003 - 2018 the average number of fires per year is 21. The highest number of fires - 55 took place in 2012, and the least - 1 in 2004. The data has a growing trend.
When looking into fire subcategories, the most reports belonged to: Outside Fires (64.6%), and Structure Fires (22.8%).
Fire incident types reported to NFIRS in Zip Code 75558

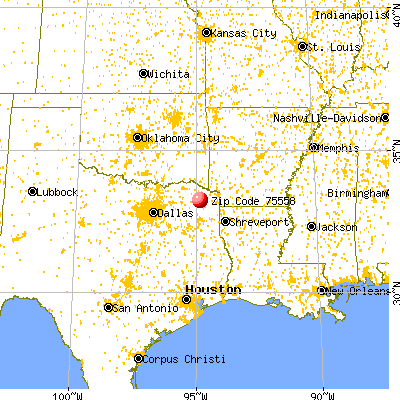


 Nearest zip codes: 75571, 75455, 75638, 75550, 75493, 75568.


 Based on the data from the years 2003 - 2018 the average number of fires per year is 21. The highest number of fires - 55 took place in 2012, and the least - 1 in 2004. The data has a growing trend.
 When looking into fire subcategories, the most reports belonged to: Outside Fires (64.6%), and Structure Fires (22.8%).