Averages for the 2020 tax year for zip code 75760, filed in 2021:
Average Adjusted Gross Income (AGI) in 2020: $47,454 (Individual Income Tax Returns)
Here:
$47,454
State:
$77,054
Salary/wage: $44,267 (reported on 76.6% of returns)
Here:
$44,267
State:
$62,766
(% of AGI for various income ranges: 1151.8% for AGIs below $25k, 3451.9% for AGIs $25k-50k, 6021.3% for AGIs $50k-75k, 8783.3% for AGIs $75k-100k, 16461.4% for AGIs $100k-200k)
Taxable interest for individuals: $674 (reported on 25.2% of returns)
This zip code:
$674
Texas:
$2,665
(% of AGI for various income ranges: 21.1% for AGIs below $25k, 15.7% for AGIs $25k-50k, 18.7% for AGIs $50k-75k, 23.3% for AGIs $75k-100k, 68.6% for AGIs $100k-200k)
Ordinary dividends: $2,267 (reported on 11.2% of returns)
Here:
$2,267
State:
$10,044
(% of AGI for various income ranges: 15.4% for AGIs below $25k, 47.6% for AGIs $25k-50k, 43.3% for AGIs $50k-75k, 91.4% for AGIs $100k-200k)
Net capital gain/loss in AGI: +$5,091 (reported on 10.3% of returns)
Here:
+$5,091
State:
+$39,590
(% of AGI for various income ranges: 59.5% for AGIs $25k-50k, 140.7% for AGIs $50k-75k, 320.0% for AGIs $100k-200k)
Profit/loss from business: +$10,600 (reported on 18.7% of returns)
Here:
+$10,600
State:
+$10,888
(% of AGI for various income ranges: 151.1% for AGIs below $25k, 209.0% for AGIs $25k-50k, 223.3% for AGIs $50k-75k, 1318.6% for AGIs $100k-200k)
Taxable individual retirement arrangement distribution: $21,625 (reported on 7.5% of returns)
75760:
$21,625
Texas:
$24,740
(% of AGI for various income ranges: 59.3% for AGIs below $25k, 179.5% for AGIs $25k-50k, 1978.3% for AGIs $75k-100k)
Total itemized deductions: $26,467 (reported on 2.8% of returns)
Here:
$26,467
State:
$40,428
(% of AGI for various income ranges: 529.3% for AGIs $50k-75k)
Taxes paid: $3,767 (reported on 2.8% of returns)
75760:
$3,767
State:
$7,821
(% of AGI for various income ranges: 75.3% for AGIs $50k-75k)
Earned income credit: $2,396 (reported on 21.5% of returns)
Here:
$2,396
State:
$2,584
(% of AGI for various income ranges: 123.9% for AGIs below $25k, 97.1% for AGIs $25k-50k)
Percentage of individuals using paid preparers for their 2020 taxes: 92.5%
Here:
93%
State:
92%
(% for various income ranges: 89.7% for AGIs below $25k, 92.9% for AGIs $25k-50k, 94.7% for AGIs $50k-75k, 88.9% for AGIs $75k-100k, 100.0% for AGIs $100k-200k)
Averages for the 2012 tax year for zip code 75760, filed in 2013:
Average Adjusted Gross Income (AGI) in 2012: $41,592 (Individual Income Tax Returns)
Here:
$41,592
State:
$65,384
Salary/wage: $38,315 (reported on 81.6% of returns)
Here:
$38,315
State:
$52,524
(% of AGI for various income ranges: 74.1% for AGIs below $25k, 82.8% for AGIs $25k-50k, 76.7% for AGIs $50k-75k, 73.8% for AGIs $75k-100k, 65.7% for AGIs $100k-200k)
Taxable interest for individuals: $968 (reported on 27.2% of returns)
This zip code:
$968
Texas:
$2,372
(% of AGI for various income ranges: 1.6% for AGIs below $25k, 0.8% for AGIs $25k-50k, 0.7% for AGIs $50k-75k, 0.3% for AGIs $75k-100k)
Ordinary dividends: $2,010 (reported on 9.7% of returns)
Here:
$2,010
State:
$9,721
(% of AGI for various income ranges: 1.1% for AGIs below $25k, 0.3% for AGIs $25k-50k, 0.7% for AGIs $50k-75k, 0.6% for AGIs $75k-100k)
Net capital gain/loss in AGI: +$1,622 (reported on 8.7% of returns)
Here:
+$1,622
State:
+$35,319
(% of AGI for various income ranges: 0.6% for AGIs $25k-50k, 1.1% for AGIs $75k-100k)
Profit/loss from business: +$11,867 (reported on 17.5% of returns)
Here:
+$11,867
State:
+$13,732
(% of AGI for various income ranges: 6.9% for AGIs below $25k, 2.3% for AGIs $25k-50k, 4.5% for AGIs $50k-75k, 14.2% for AGIs $75k-100k)
Taxable individual retirement arrangement distribution: $10,800 (reported on 7.8% of returns)
75760:
$10,800
Texas:
$19,511
(% of AGI for various income ranges: 3.4% for AGIs below $25k, 2.6% for AGIs $25k-50k, 4.2% for AGIs $50k-75k)
Total itemized deductions: $19,338 (27% of AGI, reported on 12.6% of returns)
Here:
$19,338
State:
$24,724
Here:
26.9% of AGI
State:
15.9% of AGI
(% of AGI for various income ranges: 6.9% for AGIs $25k-50k, 10.7% for AGIs $50k-75k, 8.1% for AGIs $100k-200k)
Charity contributions: $6,156 (reported on 8.7% of returns)
Here:
$6,156
State:
$6,808
(% of AGI for various income ranges: 1.0% for AGIs $25k-50k, 2.3% for AGIs $50k-75k, 2.5% for AGIs $100k-200k)
Taxes paid: $2,400 (reported on 12.6% of returns)
75760:
$2,400
State:
$6,921
(% of AGI for various income ranges: 0.7% for AGIs $25k-50k, 1.5% for AGIs $50k-75k, 1.1% for AGIs $100k-200k)
Earned income credit: $2,436 (reported on 21.4% of returns)
Here:
$2,436
State:
$2,570
(% of AGI for various income ranges: 7.9% for AGIs below $25k, 0.9% for AGIs $25k-50k)
Percentage of individuals using paid preparers for their 2012 taxes: 53.4%
Here:
53%
State:
51%
(% for various income ranges: 47.6% for AGIs below $25k, 51.6% for AGIs $25k-50k, 60.0% for AGIs $50k-75k, 66.7% for AGIs $75k-100k, 66.7% for AGIs $100k-200k)
Averages for the 2004 tax year for zip code 75760, filed in 2005:
Average Adjusted Gross Income (AGI) in 2004: $29,961 (Individual Income Tax Returns)
Here:
$29,961
State:
$47,881
Salary/wage: $29,460 (reported on 81.9% of returns)
Here:
$29,460
State:
$41,947
(% of AGI for various income ranges: 126.9% for AGIs below $10k, 78.0% for AGIs $10k-25k, 86.6% for AGIs $25k-50k, 75.5% for AGIs $50k-75k, 79.4% for AGIs $75k-100k, 66.8% for AGIs over 100k)
Taxable interest for individuals: $1,234 (reported on 33.5% of returns)
This zip code:
$1,234
Texas:
$2,255
(% of AGI for various income ranges: 8.4% for AGIs below $10k, 1.8% for AGIs $10k-25k, 0.9% for AGIs $25k-50k, 1.7% for AGIs $50k-75k, 0.6% for AGIs $75k-100k, 0.5% for AGIs over 100k)
Taxable dividends: $1,488 (reported on 13.3% of returns)
Here:
$1,488
State:
$4,261
(% of AGI for various income ranges: 2.5% for AGIs below $10k, 1.5% for AGIs $10k-25k, 0.4% for AGIs $25k-50k, 0.2% for AGIs $50k-75k, 1.1% for AGIs $75k-100k)
Net capital gain/loss: +$697 (reported on 10.2% of returns)
Here:
+$697
State:
+$16,110
(% of AGI for various income ranges: -1.9% for AGIs below $10k, -0.2% for AGIs $10k-25k, 0.3% for AGIs $25k-50k, 0.5% for AGIs $50k-75k, 0.6% for AGIs $75k-100k)
Profit/loss from business: +$5,793 (reported on 16.9% of returns)
Here:
+$5,793
State:
+$11,013
(% of AGI for various income ranges: 9.6% for AGIs below $10k, 6.8% for AGIs $10k-25k, 0.5% for AGIs $25k-50k, 6.8% for AGIs $50k-75k, -0.1% for AGIs $75k-100k)
Total itemized deductions: $17,916 (32% of AGI, reported on 11.0% of returns)
Here:
$17,916
State:
$19,631
Here:
32.1% of AGI
State:
18.9% of AGI
(% of AGI for various income ranges: 7.4% for AGIs $10k-25k, 5.4% for AGIs $25k-50k, 6.7% for AGIs $50k-75k, 6.9% for AGIs $75k-100k, 10.1% for AGIs over 100k)
Charity contributions deductions: $4,378 (8% of AGI, reported on 7.6% of returns)
Here:
$4,378
State:
$4,753
Here:
7.6% of AGI
State:
4.2% of AGI
(% of AGI for various income ranges: 1.1% for AGIs $10k-25k, 0.3% for AGIs $25k-50k, 1.2% for AGIs $50k-75k, 3.8% for AGIs $75k-100k)
Total tax: $3,414 (reported on 66.6% of returns)
75760:
$3,414
State:
$9,058
(% of AGI for various income ranges: 3.3% for AGIs below $10k, 3.3% for AGIs $10k-25k, 5.7% for AGIs $25k-50k, 8.9% for AGIs $50k-75k, 10.8% for AGIs $75k-100k, 15.5% for AGIs over 100k)
Earned income credit: $2,043 (reported on 24.2% of returns)
Here:
$2,043
State:
$2,024
Percentage of individuals using paid preparers for their 2004 taxes: 62.3%
Here:
62%
State:
57%
(% for various income ranges: 50.9% for AGIs below $10k, 66.5% for AGIs $10k-25k, 63.4% for AGIs $25k-50k, 67.0% for AGIs $50k-75k, 64.6% for AGIs $75k-100k, 70.0% for AGIs over 100k)
Household received Food Stamps/SNAP in the past 12 months: 132 Household did not receive Food Stamps/SNAP in the past 12 months: 997
Women who had a birth in the past 12 months: 19 (20 now married, 0 unmarried) Women who did not have a birth in the past 12 months: 291 (136 now married, 155 unmarried)
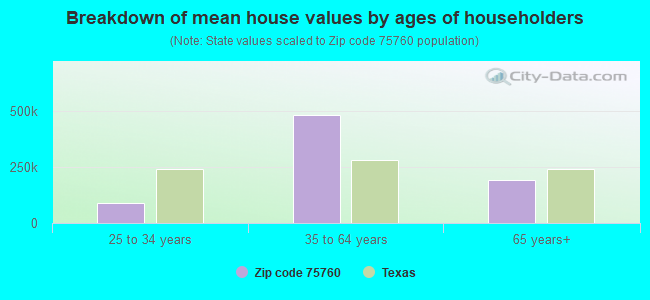
Housing units in zip code 75760 with a mortgage: 213 Median monthly owner costs for units with a mortgage: $1,182 Median monthly owner costs for units without a mortgage: $444
Residents with income below the poverty level in 2022:
This zip code:
12.7%
Whole state:
14.0%
Residents with income below 50% of the poverty level in 2022:
This zip code:
5.6%
Whole state:
7.4%
Median number of rooms in houses and condos:
Here:
5.9
State:
6.3
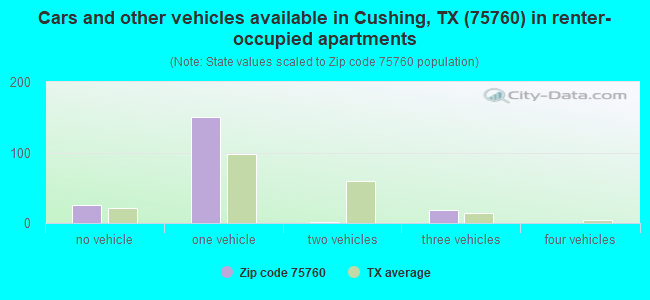
Median number of rooms in apartments:
Here:
5.0
State:
4.0
Notable locations in this zip code not listed on our city pages
Notable locations in zip code 75760: Moore Memorial Public Library (A), Lilbert - Looneyville Volunteer Fire Department (B). Display/hide their locations on the map
Churches in zip code 75760 include: Scott Temple (A), Shady Grove Church (B), Haney Chapel (C), McKnight Church (D), Isaiah Church (E), Big Rock Church (F), God-in-Christ Church (G), Midway Church (H). Display/hide their locations on the map
Cemeteries: Blackburn Cemetery (1), Blanton Cemetery (2), Ward Cemetery (3), Dansby Cemetery (4), Old Pine Grove Cemetery (5), Fenton Cemetery (6), Friendship Cemetery (7). Display/hide their locations on the map
Streams, rivers, and creeks: Sulphur Springs Branch (A), Atoy Creek (B), Stillhouse Creek (C), Reagan Branch (D), Sulphur Creek (E), Everett Branch (F), Johnson Branch (G), Little Creek (H), Indian Creek (I). Display/hide their locations on the map
Size of family households: 275 2-persons, 198 3-persons, 73 4-persons, 47 5-persons
Size of nonfamily households: 494 1-person, 45 2-persons, 3 3-persons
257 married couples with children.
94 single-parent households (85 men, 9 women).
99.1% of residents of 75760 zip code speak English at home.
0.5% of residents speak Spanish at home (55% very well, 45% not well).
0.8% of residents speak other Indo-European language at home (100% very well).
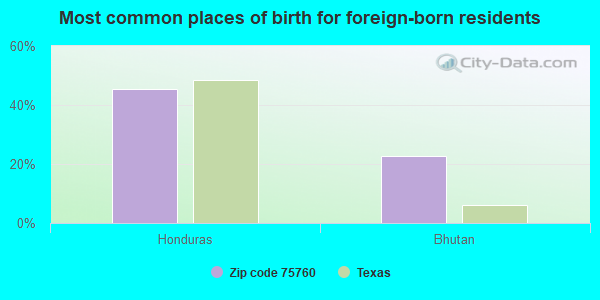
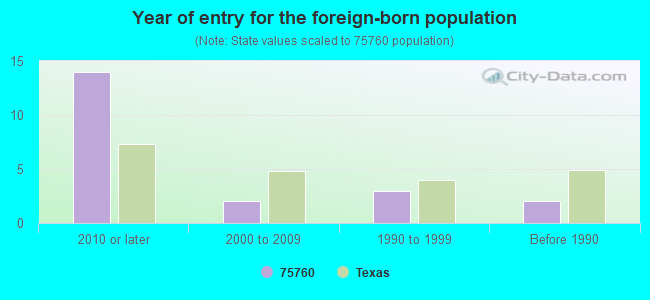
Foreign born population: 23 (1.0%) (74.8% of them are naturalized citizens)
This zip code:
1.0%
Whole state:
17.2%
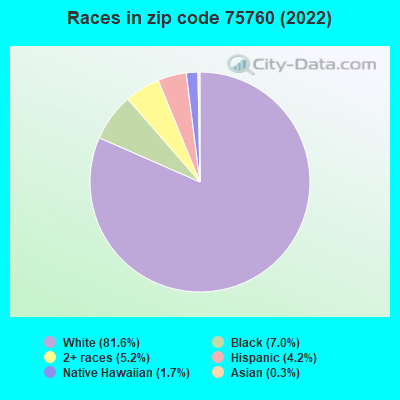
45%Honduras
23%Bhutan
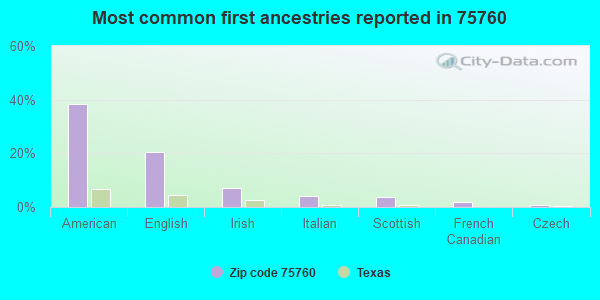
38%American
20%English
7%Irish
4%Italian
4%Scottish
2%French Canadian
1%Czech
Year of entry for the foreign-born population
142010 or later
22000 to 2009
31990 to 1999
2Before 1990
Housing units lacking complete plumbing facilities: 10.3% Housing units lacking complete kitchen facilities: 2.5%
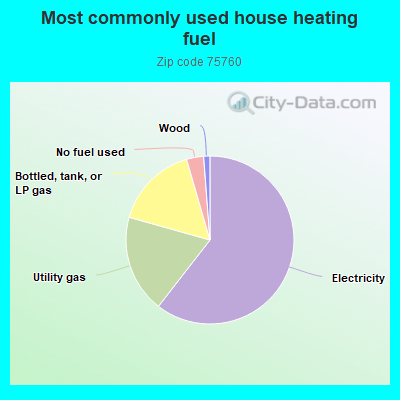
60.7%Electricity
18.9%Utility gas
16.2%Bottled, tank, or LP gas
3.3%No fuel used
1.2%Wood
Population in 1990: 2,068. Population change in the 1990s: +530 (+25.6%).
Place of birth for U.S.-born residents:
This state: 2,069
Northeast: 32
Midwest: 20
South: 58
West: 32
62% of the 75760 zip code residents lived in the same house 5 years ago. Out of people who lived in different houses, 59% lived in this county. Out of people who lived in different counties, 50% lived in Texas.
91% of the 75760 zip code residents lived in the same house 1 year ago. Out of people who lived in different houses, 66% moved from this county. Out of people who lived in different houses, 26% moved from different county within same state. Out of people who lived in different houses, 6% moved from different state.
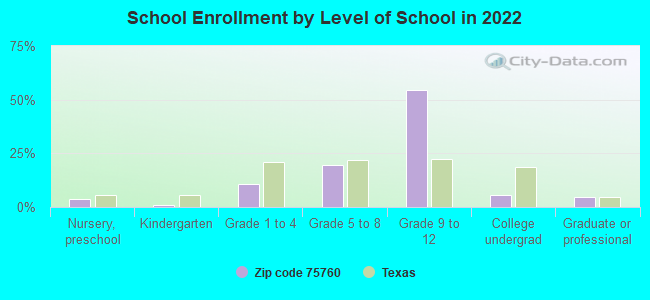
Private vs. public school enrollment:
Students in private schools in grades 1 to 8 (elementary and middle school): 15
Here:
11.3%
Texas:
8.8%
Students in private schools in grades 9 to 12 (high school): 44
Here:
18.3%
Texas:
8.0%
Students in private undergraduate colleges:
Here:
0.0%
Texas:
16.2%
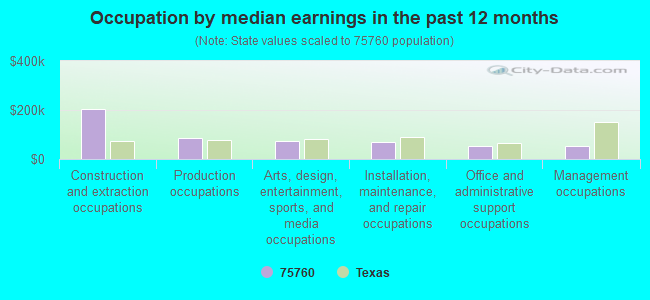
Occupation by median earnings in the past 12 months ($)
204,214Construction and extraction occupations
86,285Production occupations
71,995Arts, design, entertainment, sports, and media occupations
71,163Installation, maintenance, and repair occupations
53,141Office and administrative support occupations
52,112Management occupations
Top industries in this zip code by the number of employees in 2005:
Health Care and Social Assistance: Home Health Care Services (50-99 employees: 1 establishment, 1-4 employees: 1 establishment)
Construction: Electrical Contractors (10-19: 1)
Accommodation and Food Services: Full-Service Restaurants (10-19: 1)
Finance and Insurance: Commercial Banking (5-9: 1)
Other Services (except Public Administration): Funeral Homes and Funeral Services (5-9: 1)
People in group quarters in 2000:
64 people in nursing homes
Fatal accident statistics in 2012:
Fatal accident count: 2
Vehicles involved in fatal accidents: 2
Fatal accidents caused by drunken drivers: 1
Fatalities: 3
Persons involved in fatal accidents: 5
Pedestrians involved in fatal accidents: 0
Fatal accident statistics in 2010:
Fatal accident count: 1
Vehicles involved in fatal accidents: 1
Fatal accidents caused by drunken drivers: 1
Fatalities: 1
Persons involved in fatal accidents: 1
Pedestrians involved in fatal accidents: 0
Home Mortgage Disclosure Act Aggregated Statistics For Year 2009 (Based on 2 partial tracts)
A) FHA, FSA/RHS & VA Home Purchase Loans
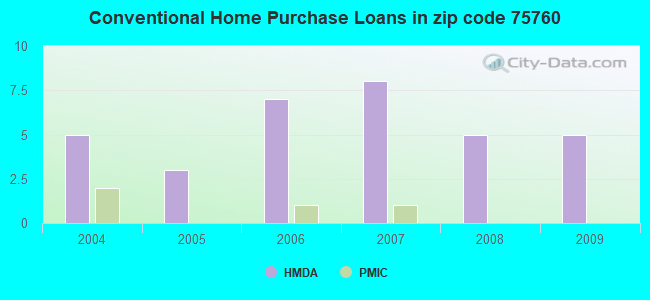
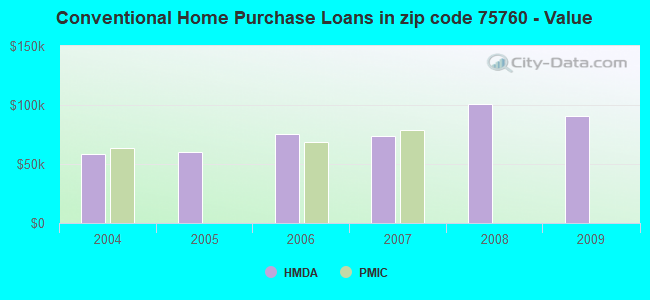
B) Conventional Home Purchase Loans
C) Refinancings
D) Home Improvement Loans
F) Non-occupant Loans on < 5 Family Dwellings (A B C & D)
G) Loans On Manufactured Home Dwelling (A B C & D)
Number
Average Value
Number
Average Value
Number
Average Value
Number
Average Value
Number
Average Value
Number
Average Value
LOANS ORIGINATED
2
$90,875
5
$90,914
3
$123,647
4
$28,565
2
$57,755
1
$69,140
APPLICATIONS APPROVED, NOT ACCEPTED
0
$0
0
$0
0
$0
0
$0
0
$0
0
$0
APPLICATIONS DENIED
0
$0
2
$54,650
1
$49,680
1
$9,520
0
$0
1
$27,320
APPLICATIONS WITHDRAWN
0
$0
0
$0
1
$158,560
0
$0
0
$0
0
$0
FILES CLOSED FOR INCOMPLETENESS
0
$0
0
$0
0
$0
0
$0
0
$0
0
$0
Aggregated Statistics For Year 2008 (Based on 2 partial tracts)
B) Conventional Home Purchase Loans
C) Refinancings
D) Home Improvement Loans
F) Non-occupant Loans on < 5 Family Dwellings (A B C & D)
G) Loans On Manufactured Home Dwelling (A B C & D)
Number
Average Value
Number
Average Value
Number
Average Value
Number
Average Value
Number
Average Value
LOANS ORIGINATED
5
$101,016
1
$54,230
2
$35,810
1
$84,040
1
$52,990
APPLICATIONS APPROVED, NOT ACCEPTED
1
$48,440
0
$0
0
$0
0
$0
1
$41,810
APPLICATIONS DENIED
1
$75,760
2
$46,370
2
$32,915
0
$0
2
$50,510
APPLICATIONS WITHDRAWN
0
$0
0
$0
0
$0
0
$0
0
$0
FILES CLOSED FOR INCOMPLETENESS
0
$0
0
$0
0
$0
0
$0
0
$0
Aggregated Statistics For Year 2007 (Based on 2 partial tracts)
B) Conventional Home Purchase Loans
C) Refinancings
D) Home Improvement Loans
F) Non-occupant Loans on < 5 Family Dwellings (A B C & D)
G) Loans On Manufactured Home Dwelling (A B C & D)
Number
Average Value
Number
Average Value
Number
Average Value
Number
Average Value
Number
Average Value
LOANS ORIGINATED
8
$73,795
4
$66,860
2
$29,600
1
$130,000
2
$64,790
APPLICATIONS APPROVED, NOT ACCEPTED
2
$47,815
1
$51,750
0
$0
0
$0
2
$32,915
APPLICATIONS DENIED
2
$80,730
4
$73,175
1
$55,060
0
$0
1
$52,160
APPLICATIONS WITHDRAWN
0
$0
1
$69,140
0
$0
0
$0
0
$0
FILES CLOSED FOR INCOMPLETENESS
1
$156,910
0
$0
0
$0
0
$0
0
$0
Aggregated Statistics For Year 2006 (Based on 2 partial tracts)
B) Conventional Home Purchase Loans
C) Refinancings
D) Home Improvement Loans
F) Non-occupant Loans on < 5 Family Dwellings (A B C & D)
G) Loans On Manufactured Home Dwelling (A B C & D)
Number
Average Value
Number
Average Value
Number
Average Value
Number
Average Value
Number
Average Value
LOANS ORIGINATED
7
$75,526
2
$77,420
5
$29,394
1
$22,770
0
$0
APPLICATIONS APPROVED, NOT ACCEPTED
2
$31,255
0
$0
0
$0
0
$0
1
$28,570
APPLICATIONS DENIED
1
$63,760
3
$55,890
1
$27,320
0
$0
0
$0
APPLICATIONS WITHDRAWN
1
$105,160
2
$56,925
0
$0
0
$0
0
$0
FILES CLOSED FOR INCOMPLETENESS
0
$0
1
$83,210
0
$0
0
$0
0
$0
Aggregated Statistics For Year 2005 (Based on 2 partial tracts)
B) Conventional Home Purchase Loans
C) Refinancings
D) Home Improvement Loans
F) Non-occupant Loans on < 5 Family Dwellings (A B C & D)
G) Loans On Manufactured Home Dwelling (A B C & D)
Number
Average Value
Number
Average Value
Number
Average Value
Number
Average Value
Number
Average Value
LOANS ORIGINATED
3
$59,753
4
$41,918
4
$12,628
1
$71,210
1
$27,320
APPLICATIONS APPROVED, NOT ACCEPTED
2
$54,855
0
$0
0
$0
0
$0
1
$21,940
APPLICATIONS DENIED
2
$29,810
4
$40,262
2
$26,910
1
$22,360
3
$27,323
APPLICATIONS WITHDRAWN
2
$49,475
2
$161,045
1
$24,010
0
$0
0
$0
FILES CLOSED FOR INCOMPLETENESS
0
$0
0
$0
0
$0
0
$0
0
$0
Aggregated Statistics For Year 2004 (Based on 2 partial tracts)
B) Conventional Home Purchase Loans
C) Refinancings
D) Home Improvement Loans
G) Loans On Manufactured Home Dwelling (A B C & D)


 Nearest zip codes: 75788, 75784, 75943, 75667, 75681, 75964.