Estimated zip code population in 2022: 6,355 Zip code population in 2010: 5,069 Zip code population in 2000: 4,379
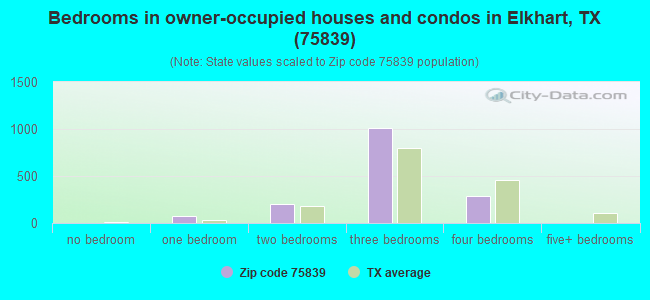
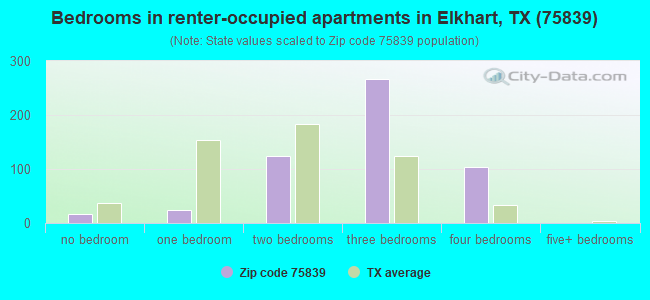
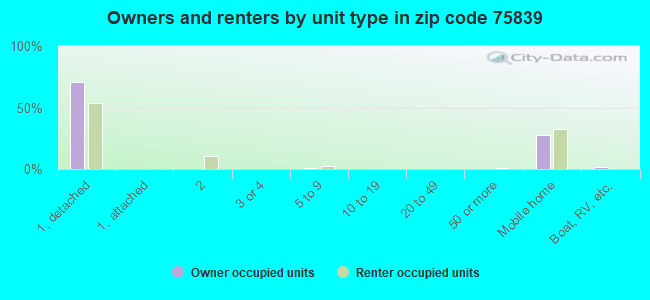
Houses and condos: 2,560 Renter-occupied apartments: 540
% of renters here:
25%
State:
38%
March 2022 cost of living index in zip code 75839: 79.3 (low, U.S. average is 100)
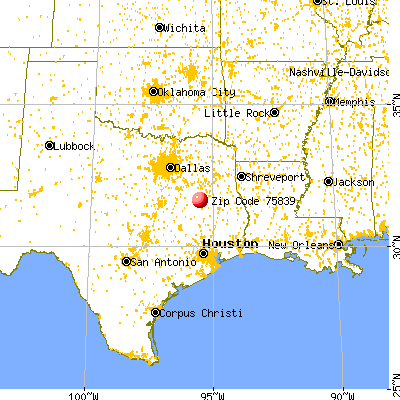
Land area: 147.4 sq. mi. Water area: 1.5 sq. mi.
Population density: 43 people per square mile
(very low).
OSM Map
General Map
Google Map
MSN Map
OSM Map
General Map
Google Map
MSN Map
OSM Map
General Map
Google Map
MSN Map
OSM Map
General Map
Google Map
MSN Map
Please wait while loading the map...
Real estate property taxes paid for housing units in 2022:
This zip code:
1.0% ($1,465)
Texas:
1.5% ($4,050)
Median real estate property taxes paid for housing units with mortgages in 2022: $2,046 (1.0%) Median real estate property taxes paid for housing units with no mortgage in 2022: $1,056 (0.8%)
Business Search- 14 Million verified businesses
Males: 3,316
(52.2%)
Females: 3,038
(47.8%)
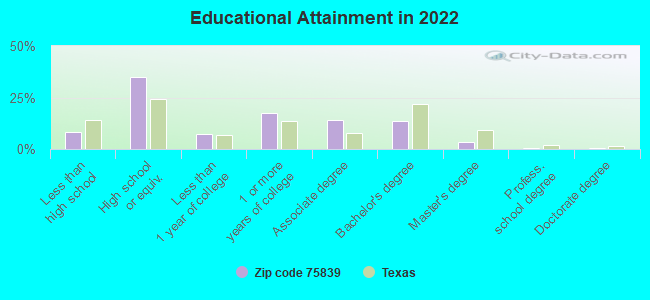
For population 25 years and over in 75839:
High school or higher: 90.6%
Bachelor's degree or higher: 17.9%
Graduate or professional degree: 4.6%
Unemployed: 2.6%
Mean travel time to work (commute): 26.4 minutes
For population 15 years and over in 75839:
Never married: 26.5%
Now married: 51.2%
Separated: 2.4%
Widowed: 8.3%
Divorced: 11.5%
Zip code 75839 compared to state average:
Median house value below state average.
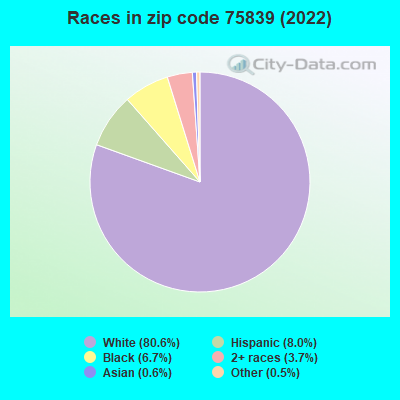
Black race population percentage below state average.
Hispanic race population percentage significantly below state average.
Foreign-born population percentage significantly below state average.
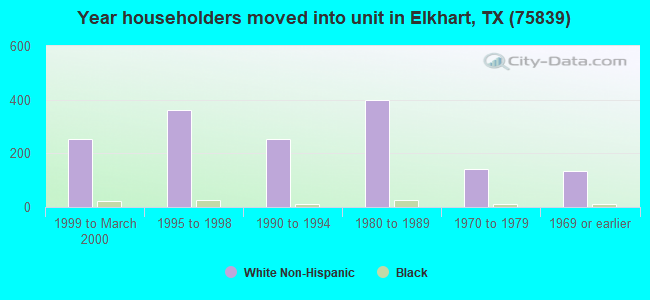
Length of stay since moving in significantly above state average.
Number of college students below state average.
Percentage of population with a bachelor's degree or higher below state average.
Averages for the 2020 tax year for zip code 75839, filed in 2021:
Average Adjusted Gross Income (AGI) in 2020: $50,311 (Individual Income Tax Returns)
Here:
$50,311
State:
$77,054
Salary/wage: $46,866 (reported on 81.2% of returns)
Here:
$46,866
State:
$62,766
(% of AGI for various income ranges: 1186.8% for AGIs below $25k, 3504.6% for AGIs $25k-50k, 6139.6% for AGIs $50k-75k, 8758.2% for AGIs $75k-100k, 13653.3% for AGIs $100k-200k)
Taxable interest for individuals: $865 (reported on 22.9% of returns)
This zip code:
$865
Texas:
$2,665
(% of AGI for various income ranges: 12.6% for AGIs below $25k, 23.9% for AGIs $25k-50k, 36.8% for AGIs $50k-75k, 32.4% for AGIs $75k-100k, 40.6% for AGIs $100k-200k)
Ordinary dividends: $2,919 (reported on 12.1% of returns)
Here:
$2,919
State:
$10,044
(% of AGI for various income ranges: 9.8% for AGIs below $25k, 24.3% for AGIs $25k-50k, 89.2% for AGIs $50k-75k, 76.5% for AGIs $75k-100k, 143.9% for AGIs $100k-200k)
Net capital gain/loss in AGI: +$4,900 (reported on 10.8% of returns)
Here:
+$4,900
State:
+$39,590
(% of AGI for various income ranges: 8.2% for AGIs below $25k, 26.1% for AGIs $25k-50k, 48.4% for AGIs $50k-75k, 152.9% for AGIs $75k-100k, 345.6% for AGIs $100k-200k)
Profit/loss from business: +$6,394 (reported on 15.2% of returns)
Here:
+$6,394
State:
+$10,888
(% of AGI for various income ranges: 69.1% for AGIs below $25k, 122.6% for AGIs $25k-50k, 108.8% for AGIs $50k-75k, 245.3% for AGIs $75k-100k, 262.2% for AGIs $100k-200k)
Taxable individual retirement arrangement distribution: $18,488 (reported on 7.6% of returns)
75839:
$18,488
Texas:
$24,740
(% of AGI for various income ranges: 36.0% for AGIs below $25k, 116.3% for AGIs $25k-50k, 243.6% for AGIs $50k-75k, 461.8% for AGIs $75k-100k, 544.4% for AGIs $100k-200k)
Total itemized deductions: $32,300 (reported on 3.6% of returns)
Here:
$32,300
State:
$40,428
(% of AGI for various income ranges: 183.3% for AGIs $25k-50k, 276.4% for AGIs $50k-75k, 583.3% for AGIs $100k-200k)
Charity contributions: $7,300 (reported on 2.2% of returns)
Here:
$7,300
State:
$18,201
(% of AGI for various income ranges: 18.7% for AGIs $25k-50k, 155.0% for AGIs $100k-200k)
Taxes paid: $6,388 (reported on 3.6% of returns)
75839:
$6,388
State:
$7,821
(% of AGI for various income ranges: 34.8% for AGIs $25k-50k, 58.8% for AGIs $50k-75k, 113.3% for AGIs $100k-200k)
Earned income credit: $2,738 (reported on 21.1% of returns)
Here:
$2,738
State:
$2,584
(% of AGI for various income ranges: 128.6% for AGIs below $25k, 98.0% for AGIs $25k-50k)
Percentage of individuals using paid preparers for their 2020 taxes: 94.6%
Here:
95%
State:
92%
(% for various income ranges: 92.6% for AGIs below $25k, 96.5% for AGIs $25k-50k, 93.9% for AGIs $50k-75k, 95.8% for AGIs $75k-100k, 96.0% for AGIs $100k-200k, 100.0% for AGIs over 200k)
Averages for the 2012 tax year for zip code 75839, filed in 2013:
Average Adjusted Gross Income (AGI) in 2012: $47,764 (Individual Income Tax Returns)
Here:
$47,764
State:
$65,384
Salary/wage: $41,318 (reported on 83.3% of returns)
Here:
$41,318
State:
$52,524
(% of AGI for various income ranges: 74.9% for AGIs below $25k, 82.3% for AGIs $25k-50k, 79.5% for AGIs $50k-75k, 86.2% for AGIs $75k-100k, 75.4% for AGIs $100k-200k, 21.7% for AGIs over 200k)
Taxable interest for individuals: $1,404 (reported on 21.4% of returns)
This zip code:
$1,404
Texas:
$2,372
(% of AGI for various income ranges: 1.1% for AGIs below $25k, 0.6% for AGIs $25k-50k, 1.3% for AGIs $50k-75k, 0.3% for AGIs $75k-100k, 0.6% for AGIs $100k-200k)
Ordinary dividends: $3,393 (reported on 12.9% of returns)
Here:
$3,393
State:
$9,721
(% of AGI for various income ranges: 1.5% for AGIs below $25k, 1.0% for AGIs $25k-50k, 0.6% for AGIs $50k-75k, 1.1% for AGIs $75k-100k, 1.3% for AGIs $100k-200k)
Net capital gain/loss in AGI: +$6,400 (reported on 11.4% of returns)
Here:
+$6,400
State:
+$35,319
(% of AGI for various income ranges: 0.5% for AGIs $25k-50k, 0.1% for AGIs $50k-75k, 0.2% for AGIs $75k-100k, 6.9% for AGIs $100k-200k)
Profit/loss from business: +$10,397 (reported on 16.7% of returns)
Here:
+$10,397
State:
+$13,732
(% of AGI for various income ranges: 6.9% for AGIs below $25k, 3.3% for AGIs $25k-50k, 3.0% for AGIs $50k-75k, 0.9% for AGIs $75k-100k, 7.5% for AGIs $100k-200k)
Taxable individual retirement arrangement distribution: $14,776 (reported on 8.1% of returns)
75839:
$14,776
Texas:
$19,511
(% of AGI for various income ranges: 3.0% for AGIs below $25k, 1.8% for AGIs $25k-50k, 4.9% for AGIs $50k-75k, 4.4% for AGIs $100k-200k)
Total itemized deductions: $20,372 (23% of AGI, reported on 17.1% of returns)
Here:
$20,372
State:
$24,724
Here:
22.9% of AGI
State:
15.9% of AGI
(% of AGI for various income ranges: 5.8% for AGIs below $25k, 6.6% for AGIs $25k-50k, 7.3% for AGIs $50k-75k, 8.7% for AGIs $75k-100k, 12.4% for AGIs $100k-200k)
Charity contributions: $5,342 (reported on 11.4% of returns)
Here:
$5,342
State:
$6,808
(% of AGI for various income ranges: 0.7% for AGIs below $25k, 1.0% for AGIs $25k-50k, 1.0% for AGIs $50k-75k, 1.6% for AGIs $75k-100k, 2.7% for AGIs $100k-200k)
Taxes paid: $4,123 (reported on 16.7% of returns)
75839:
$4,123
State:
$6,921
(% of AGI for various income ranges: 0.7% for AGIs below $25k, 1.2% for AGIs $25k-50k, 1.1% for AGIs $50k-75k, 1.4% for AGIs $75k-100k, 3.4% for AGIs $100k-200k)
Earned income credit: $2,453 (reported on 27.1% of returns)
Here:
$2,453
State:
$2,570
(% of AGI for various income ranges: 9.8% for AGIs below $25k, 1.8% for AGIs $25k-50k)
Percentage of individuals using paid preparers for their 2012 taxes: 56.2%
Here:
56%
State:
51%
(% for various income ranges: 49.4% for AGIs below $25k, 55.8% for AGIs $25k-50k, 65.6% for AGIs $50k-75k, 60.0% for AGIs $75k-100k, 68.8% for AGIs $100k-200k, 66.7% for AGIs over 200k)
Averages for the 2004 tax year for zip code 75839, filed in 2005:
Average Adjusted Gross Income (AGI) in 2004: $32,127 (Individual Income Tax Returns)
Here:
$32,127
State:
$47,881
Salary/wage: $32,711 (reported on 81.8% of returns)
Here:
$32,711
State:
$41,947
(% of AGI for various income ranges: 150.6% for AGIs below $10k, 78.2% for AGIs $10k-25k, 85.1% for AGIs $25k-50k, 86.2% for AGIs $50k-75k, 84.7% for AGIs $75k-100k, 69.0% for AGIs over 100k)
Taxable interest for individuals: $1,645 (reported on 30.9% of returns)
This zip code:
$1,645
Texas:
$2,255
(% of AGI for various income ranges: 8.3% for AGIs below $10k, 1.9% for AGIs $10k-25k, 1.8% for AGIs $25k-50k, 1.8% for AGIs $50k-75k, 0.7% for AGIs $75k-100k, 0.6% for AGIs over 100k)
Taxable dividends: $1,843 (reported on 16.9% of returns)
Here:
$1,843
State:
$4,261
(% of AGI for various income ranges: 8.2% for AGIs below $10k, 1.1% for AGIs $10k-25k, 0.7% for AGIs $25k-50k, 0.7% for AGIs $50k-75k, 0.7% for AGIs $75k-100k, 1.3% for AGIs over 100k)
Net capital gain/loss: +$2,241 (reported on 14.7% of returns)
Here:
+$2,241
State:
+$16,110
(% of AGI for various income ranges: -1.4% for AGIs below $10k, 0.7% for AGIs $10k-25k, 0.3% for AGIs $25k-50k, 1.2% for AGIs $50k-75k, 1.2% for AGIs $75k-100k, 2.9% for AGIs over 100k)
Profit/loss from business: +$3,954 (reported on 18.0% of returns)
Here:
+$3,954
State:
+$11,013
(% of AGI for various income ranges: 1.8% for AGIs below $10k, 4.9% for AGIs $10k-25k, 3.0% for AGIs $25k-50k, 1.2% for AGIs $50k-75k, 1.4% for AGIs $75k-100k, 0.1% for AGIs over 100k)
IRA payment deduction: $1,591 (reported on 1.1% of returns)
75839:
$1,591
Texas:
$3,120
Total itemized deductions: $16,537 (26% of AGI, reported on 13.5% of returns)
Here:
$16,537
State:
$19,631
Here:
25.9% of AGI
State:
18.9% of AGI
(% of AGI for various income ranges: 17.9% for AGIs below $10k, 5.3% for AGIs $10k-25k, 5.1% for AGIs $25k-50k, 7.4% for AGIs $50k-75k, 8.8% for AGIs $75k-100k, 8.3% for AGIs over 100k)
Charity contributions deductions: $3,892 (6% of AGI, reported on 10.1% of returns)
Here:
$3,892
State:
$4,753
Here:
5.9% of AGI
State:
4.2% of AGI
(% of AGI for various income ranges: 1.1% for AGIs $10k-25k, 0.7% for AGIs $25k-50k, 1.2% for AGIs $50k-75k, 1.8% for AGIs $75k-100k, 1.9% for AGIs over 100k)
Total tax: $4,054 (reported on 67.3% of returns)
75839:
$4,054
State:
$9,058
(% of AGI for various income ranges: 6.4% for AGIs below $10k, 3.7% for AGIs $10k-25k, 5.9% for AGIs $25k-50k, 8.3% for AGIs $50k-75k, 10.5% for AGIs $75k-100k, 18.0% for AGIs over 100k)
Earned income credit: $1,982 (reported on 26.0% of returns)
Here:
$1,982
State:
$2,024
Percentage of individuals using paid preparers for their 2004 taxes: 62.5%
Here:
62%
State:
57%
(% for various income ranges: 56.0% for AGIs below $10k, 63.1% for AGIs $10k-25k, 63.1% for AGIs $25k-50k, 68.6% for AGIs $50k-75k, 68.1% for AGIs $75k-100k, 64.7% for AGIs over 100k)
Likely homosexual households (counted as self-reported same-sex unmarried-partner households)
Lesbian couples: 0.6% of all households
Gay men: 0.0% of all households
Household received Food Stamps/SNAP in the past 12 months: 381 Household did not receive Food Stamps/SNAP in the past 12 months: 1,748
Women who had a birth in the past 12 months: 87 (84 now married, 4 unmarried) Women who did not have a birth in the past 12 months: 1,302 (553 now married, 749 unmarried)
Housing units in zip code 75839 with a mortgage: 704 (6 second mortgage) Median monthly owner costs for units with a mortgage: $1,230 Median monthly owner costs for units without a mortgage: $484
Residents with income below the poverty level in 2022:
This zip code:
15.1%
Whole state:
14.0%
Residents with income below 50% of the poverty level in 2022:
This zip code:
9.1%
Whole state:
7.4%
Median number of rooms in houses and condos:
Here:
5.6
State:
6.3
Median number of rooms in apartments:
Here:
5.0
State:
4.0
Notable locations in this zip code not listed on our city pages
Churches in zip code 75839 include: Sand Flat Church (A), Pilgrim Church (B), Beulah Church (C), Providence Church (D), Tabernacle Church (E), Sulphur Springs Church (F), Galilee Church (G), Rocky Mound Church (H), Saint Anna Church (I). Display/hide their locations on the map
Cemeteries: Perry Starr Cemetery (1), Crawford Cemetery (2), Davis Cemetery (3), Hauser Property Cemetery (4), Thomas Starr Cemetery (5), Garden of Memories Cemetery (6), Starr Cemetery (7). Display/hide their locations on the map
Streams, rivers, and creeks: Box Creek (A), Parker Branch (B), Alder Branch (C), Spring Branch (D), Squirrel Creek (E), Cedar Creek (F), Turkey Creek (G), Saddler Creek (H), Manson Creek (I). Display/hide their locations on the map
In group quarters: 90 (-1 institutionalized population)
Size of family households: 678 2-persons, 525 3-persons, 268 4-persons, 115 5-persons, 60 6-persons, 31 7-or-more-persons
Size of nonfamily households: 391 1-person, 35 2-persons, 12 4-persons
1,273 married couples with children.
226 single-parent households (81 men, 145 women).
96.6% of residents of 75839 zip code speak English at home.
3.1% of residents speak Spanish at home (52% very well, 19% well, 13% not well, 16% not at all).
0.1% of residents speak other Indo-European language at home (100% very well).
0.2% of residents speak Asian or Pacific Island language at home (100% very well).
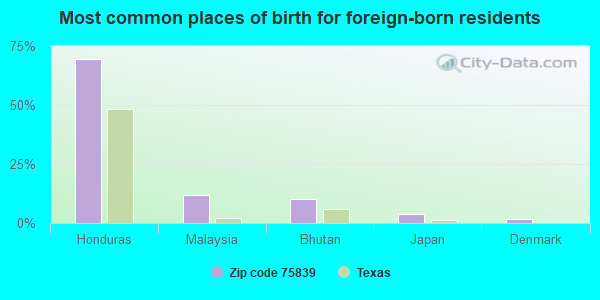
Foreign born population: 128 (2.0%) (52.2% of them are naturalized citizens)
This zip code:
2.0%
Whole state:
17.2%
69%Honduras
12%Malaysia
10%Bhutan
4%Japan
2%Denmark
32%English
22%American
10%German
5%Scottish
5%Irish
2%European
2%French
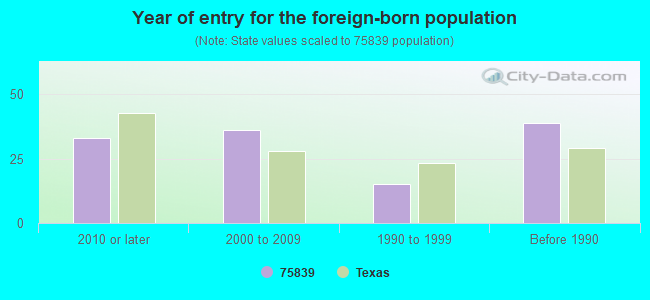
Year of entry for the foreign-born population
332010 or later
362000 to 2009
151990 to 1999
39Before 1990
Facilities with environmental interests located in this zip code:
ARCO PIPE LINE COMPANY (4 MI NORTHWEST OF in SLOCUM, TX)
(Resource Conservation and Recovery Act (tracking hazardous waste)) Alternative names: SLOCUM STATION
Housing units lacking complete plumbing facilities: 3.1% Housing units lacking complete kitchen facilities: 3.4%
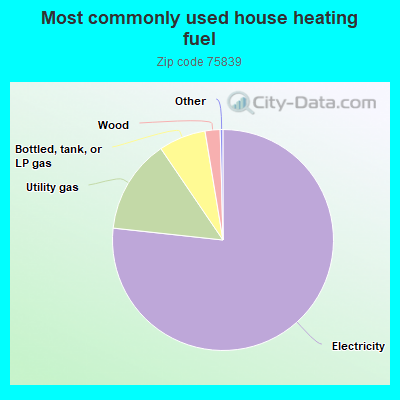
76.8%Electricity
13.8%Utility gas
6.9%Bottled, tank, or LP gas
2.2%Wood
Population in 1990: 4,767.
Place of birth for U.S.-born residents:
This state: 5,313
Northeast: 170
Midwest: 89
South: 385
West: 215
58% of the 75839 zip code residents lived in the same house 5 years ago. Out of people who lived in different houses, 66% lived in this county. Out of people who lived in different counties, 50% lived in Texas.
88% of the 75839 zip code residents lived in the same house 1 year ago. Out of people who lived in different houses, 38% moved from this county. Out of people who lived in different houses, 40% moved from different county within same state. Out of people who lived in different houses, 24% moved from different state.
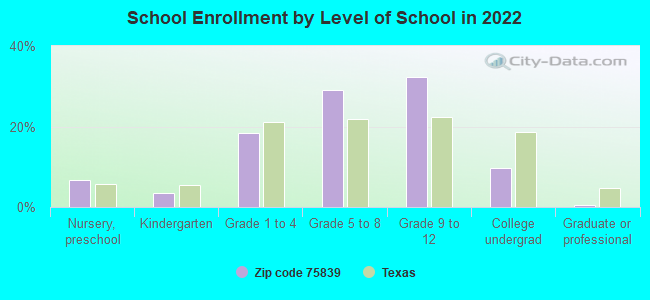
Private vs. public school enrollment:
Students in private schools in grades 1 to 8 (elementary and middle school): 24
Here:
3.2%
Texas:
8.8%
Students in private schools in grades 9 to 12 (high school): 22
Here:
4.5%
Texas:
8.0%
Students in private undergraduate colleges:
Here:
0.0%
Texas:
16.2%
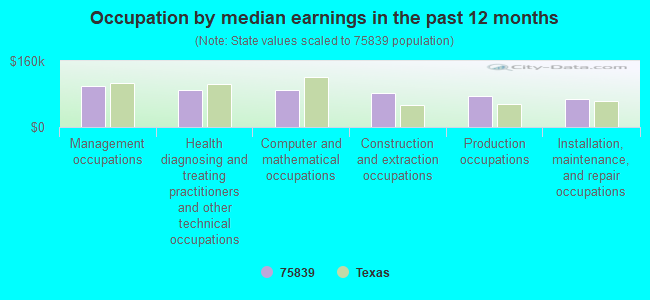
Occupation by median earnings in the past 12 months ($)
98,907Management occupations
90,438Health diagnosing and treating practitioners and other technical occupations
90,263Computer and mathematical occupations
82,259Construction and extraction occupations
75,830Production occupations
66,895Installation, maintenance, and repair occupations
Top industries in this zip code by the number of employees in 2005:
Mining: Crude Petroleum and Natural Gas Extraction (20-49 employees: 1 establishment, 10-19 employees: 1 establishment)
Mining: Support Activities for Oil and Gas Operations (20-49: 1, 1-4: 1)
Construction: Other Building Equipment Contractors (20-49: 1)
Finance and Insurance: Commercial Banking (20-49: 1)
Mining: Drilling Oil and Gas Wells (20-49: 1)
Health Care and Social Assistance: Residential Mental Retardation Facilities (10-19: 1)
Wholesale Trade: Other Farm Product Raw Material Merchant Wholesalers (10-19: 1)
People in group quarters in 2010:
71 people in nursing facilities/skilled-nursing facilities
6 people in other noninstitutional facilities
People in group quarters in 2000:
83 people in nursing homes
7 people in other group homes
6 people in homes for the mentally retarded
Fatal accident statistics in 2011:
Fatal accident count: 2
Vehicles involved in fatal accidents: 4
Fatal accidents caused by drunken drivers: 1
Fatalities: 2
Persons involved in fatal accidents: 11
Pedestrians involved in fatal accidents: 0
Fatal accident statistics in 2010:
Fatal accident count: 2
Vehicles involved in fatal accidents: 3
Fatal accidents caused by drunken drivers: 2
Fatalities: 2
Persons involved in fatal accidents: 3
Pedestrians involved in fatal accidents: 0
2003 - 2018 National Fire Incident Reporting System (NFIRS) incidents
Based on the data from the years 2003 - 2018 the average number of fires per year is 16. The highest number of reported fire incidents - 64 took place in 2006, and the least - 0 in 2010. The data has a declining trend.
When looking into fire subcategories, the most incidents belonged to: Outside Fires (59.1%), and Structure Fires (28.3%).
Fire incident types reported to NFIRS in Zip Code 75839


 Nearest zip codes: 75801, 75844, 75849, 75779, 75855, 75803.


 Based on the data from the years 2003 - 2018 the average number of fires per year is 16. The highest number of reported fire incidents - 64 took place in 2006, and the least - 0 in 2010. The data has a declining trend.
 When looking into fire subcategories, the most incidents belonged to: Outside Fires (59.1%), and Structure Fires (28.3%).