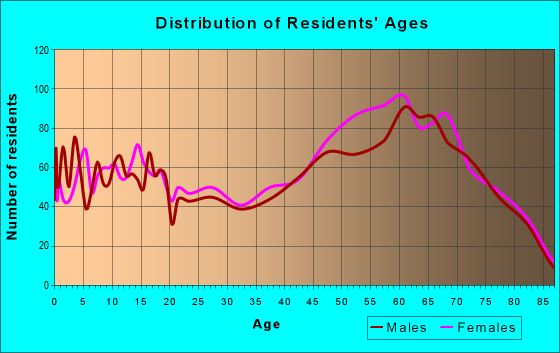
Estimated zip code population in 2022: 10,286 Zip code population in 2010: 10,091 Zip code population in 2000: 9,350
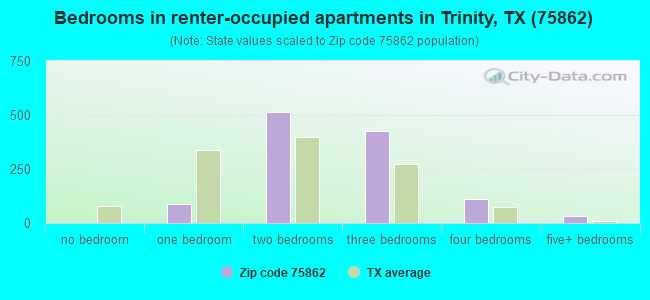
Houses and condos: 6,181 Renter-occupied apartments: 1,193
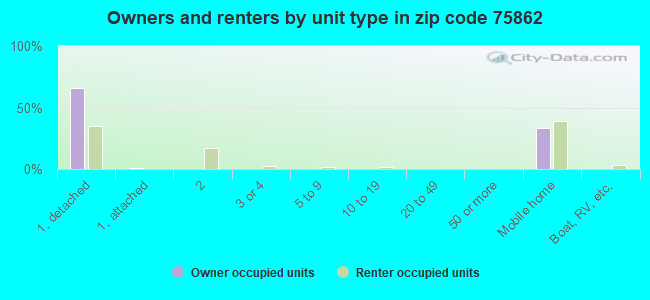
% of renters here:
26%
State:
38%
March 2022 cost of living index in zip code 75862: 78.8 (low, U.S. average is 100)
Land area: 246.8 sq. mi. Water area: 21.0 sq. mi.
Population density: 42 people per square mile
(very low).
OSM Map
General Map
Google Map
MSN Map
OSM Map
General Map
Google Map
MSN Map
OSM Map
General Map
Google Map
MSN Map
OSM Map
General Map
Google Map
MSN Map
Please wait while loading the map...
Real estate property taxes paid for housing units in 2022:
This zip code:
1.1% ($1,386)
Texas:
1.5% ($4,050)
Median real estate property taxes paid for housing units with mortgages in 2022: $2,263 (1.3%) Median real estate property taxes paid for housing units with no mortgage in 2022: $1,049 (1.1%)
Averages for the 2020 tax year for zip code 75862, filed in 2021:
Average Adjusted Gross Income (AGI) in 2020: $48,405 (Individual Income Tax Returns)
Here:
$48,405
State:
$77,054
Salary/wage: $42,535 (reported on 74.6% of returns)
Here:
$42,535
State:
$62,766
(% of AGI for various income ranges: 1030.4% for AGIs below $25k, 3352.9% for AGIs $25k-50k, 5693.1% for AGIs $50k-75k, 8100.4% for AGIs $75k-100k, 14508.1% for AGIs $100k-200k, 51173.3% for AGIs over 200k)
Taxable interest for individuals: $1,086 (reported on 22.8% of returns)
This zip code:
$1,086
Texas:
$2,665
(% of AGI for various income ranges: 13.2% for AGIs below $25k, 12.3% for AGIs $25k-50k, 43.8% for AGIs $50k-75k, 53.5% for AGIs $75k-100k, 118.1% for AGIs $100k-200k, 616.7% for AGIs over 200k)
Ordinary dividends: $4,942 (reported on 11.9% of returns)
Here:
$4,942
State:
$10,044
(% of AGI for various income ranges: 14.2% for AGIs below $25k, 23.4% for AGIs $25k-50k, 75.3% for AGIs $50k-75k, 128.3% for AGIs $75k-100k, 291.4% for AGIs $100k-200k, 2746.7% for AGIs over 200k)
Net capital gain/loss in AGI: +$11,568 (reported on 11.2% of returns)
Here:
+$11,568
State:
+$39,590
(% of AGI for various income ranges: 7.0% for AGIs below $25k, 19.9% for AGIs $25k-50k, 32.9% for AGIs $50k-75k, 170.0% for AGIs $75k-100k, 917.6% for AGIs $100k-200k, 9003.3% for AGIs over 200k)
Profit/loss from business: +$5,235 (reported on 17.8% of returns)
Here:
+$5,235
State:
+$10,888
(% of AGI for various income ranges: 69.1% for AGIs below $25k, 97.9% for AGIs $25k-50k, 119.3% for AGIs $50k-75k, 240.9% for AGIs $75k-100k, 486.7% for AGIs $100k-200k)
Taxable individual retirement arrangement distribution: $22,269 (reported on 9.3% of returns)
75862:
$22,269
Texas:
$24,740
(% of AGI for various income ranges: 56.9% for AGIs below $25k, 86.3% for AGIs $25k-50k, 227.3% for AGIs $50k-75k, 638.7% for AGIs $75k-100k, 2214.8% for AGIs $100k-200k)
Total itemized deductions: $35,185 (reported on 3.1% of returns)
Here:
$35,185
State:
$40,428
(% of AGI for various income ranges: 92.1% for AGIs $25k-50k, 164.9% for AGIs $50k-75k, 341.7% for AGIs $75k-100k, 1069.0% for AGIs $100k-200k)
Charity contributions: $10,458 (reported on 2.9% of returns)
Here:
$10,458
State:
$18,201
(% of AGI for various income ranges: 14.0% for AGIs below $25k, 87.1% for AGIs $50k-75k, 318.6% for AGIs $100k-200k)
Taxes paid: $6,392 (reported on 3.1% of returns)
75862:
$6,392
State:
$7,821
(% of AGI for various income ranges: 6.6% for AGIs below $25k, 24.4% for AGIs $50k-75k, 70.0% for AGIs $75k-100k, 222.9% for AGIs $100k-200k)
Earned income credit: $2,551 (reported on 24.5% of returns)
Here:
$2,551
State:
$2,584
(% of AGI for various income ranges: 132.2% for AGIs below $25k, 89.8% for AGIs $25k-50k, 2.2% for AGIs $50k-75k)
Percentage of individuals using paid preparers for their 2020 taxes: 92.4%
Here:
92%
State:
92%
(% for various income ranges: 92.1% for AGIs below $25k, 92.6% for AGIs $25k-50k, 93.2% for AGIs $50k-75k, 91.2% for AGIs $75k-100k, 91.4% for AGIs $100k-200k, 100.0% for AGIs over 200k)
Averages for the 2012 tax year for zip code 75862, filed in 2013:
Average Adjusted Gross Income (AGI) in 2012: $39,248 (Individual Income Tax Returns)
Here:
$39,248
State:
$65,384
Salary/wage: $33,744 (reported on 76.8% of returns)
Here:
$33,744
State:
$52,524
(% of AGI for various income ranges: 74.1% for AGIs below $25k, 74.3% for AGIs $25k-50k, 66.8% for AGIs $50k-75k, 63.1% for AGIs $75k-100k, 61.9% for AGIs $100k-200k, 41.3% for AGIs over 200k)
Taxable interest for individuals: $1,261 (reported on 24.5% of returns)
This zip code:
$1,261
Texas:
$2,372
(% of AGI for various income ranges: 1.1% for AGIs below $25k, 0.7% for AGIs $25k-50k, 1.0% for AGIs $50k-75k, 0.7% for AGIs $75k-100k, 0.6% for AGIs $100k-200k, 0.6% for AGIs over 200k)
Ordinary dividends: $3,868 (reported on 12.2% of returns)
Here:
$3,868
State:
$9,721
(% of AGI for various income ranges: 1.1% for AGIs below $25k, 0.8% for AGIs $25k-50k, 1.1% for AGIs $50k-75k, 1.5% for AGIs $75k-100k, 2.3% for AGIs $100k-200k)
Net capital gain/loss in AGI: +$3,692 (reported on 9.6% of returns)
Here:
+$3,692
State:
+$35,319
(% of AGI for various income ranges: 0.7% for AGIs below $25k, 0.5% for AGIs $25k-50k, 0.6% for AGIs $50k-75k, 0.2% for AGIs $75k-100k, 3.5% for AGIs $100k-200k)
Profit/loss from business: +$6,318 (reported on 17.7% of returns)
Here:
+$6,318
State:
+$13,732
(% of AGI for various income ranges: 7.0% for AGIs below $25k, 2.3% for AGIs $25k-50k, 1.1% for AGIs $50k-75k, 1.2% for AGIs $75k-100k, 4.4% for AGIs $100k-200k)
Taxable individual retirement arrangement distribution: $18,164 (reported on 11.5% of returns)
75862:
$18,164
Texas:
$19,511
(% of AGI for various income ranges: 3.6% for AGIs below $25k, 3.0% for AGIs $25k-50k, 4.7% for AGIs $50k-75k, 5.6% for AGIs $75k-100k, 12.5% for AGIs $100k-200k)
Total itemized deductions: $20,900 (27% of AGI, reported on 16.9% of returns)
Here:
$20,900
State:
$24,724
Here:
27.0% of AGI
State:
15.9% of AGI
(% of AGI for various income ranges: 6.4% for AGIs below $25k, 8.1% for AGIs $25k-50k, 10.2% for AGIs $50k-75k, 9.9% for AGIs $75k-100k, 10.8% for AGIs $100k-200k, 8.4% for AGIs over 200k)
Charity contributions: $5,083 (reported on 10.9% of returns)
Here:
$5,083
State:
$6,808
(% of AGI for various income ranges: 0.6% for AGIs below $25k, 1.1% for AGIs $25k-50k, 1.4% for AGIs $50k-75k, 1.3% for AGIs $75k-100k, 1.8% for AGIs $100k-200k, 3.1% for AGIs over 200k)
Taxes paid: $4,082 (reported on 16.1% of returns)
75862:
$4,082
State:
$6,921
(% of AGI for various income ranges: 0.9% for AGIs below $25k, 1.1% for AGIs $25k-50k, 1.6% for AGIs $50k-75k, 1.8% for AGIs $75k-100k, 2.7% for AGIs $100k-200k, 2.3% for AGIs over 200k)
Earned income credit: $2,613 (reported on 27.9% of returns)
Here:
$2,613
State:
$2,570
(% of AGI for various income ranges: 9.8% for AGIs below $25k, 1.3% for AGIs $25k-50k)
Percentage of individuals using paid preparers for their 2012 taxes: 55.5%
Here:
55%
State:
51%
(% for various income ranges: 51.3% for AGIs below $25k, 56.0% for AGIs $25k-50k, 57.8% for AGIs $50k-75k, 65.4% for AGIs $75k-100k, 68.2% for AGIs $100k-200k, 75.0% for AGIs over 200k)
Averages for the 2004 tax year for zip code 75862, filed in 2005:
Average Adjusted Gross Income (AGI) in 2004: $28,656 (Individual Income Tax Returns)
Here:
$28,656
State:
$47,881
Salary/wage: $25,534 (reported on 77.0% of returns)
Here:
$25,534
State:
$41,947
(% of AGI for various income ranges: 159.1% for AGIs below $10k, 74.1% for AGIs $10k-25k, 74.0% for AGIs $25k-50k, 68.4% for AGIs $50k-75k, 57.9% for AGIs $75k-100k, 46.3% for AGIs over 100k)
Taxable interest for individuals: $2,413 (reported on 32.1% of returns)
This zip code:
$2,413
Texas:
$2,255
(% of AGI for various income ranges: 9.1% for AGIs below $10k, 2.5% for AGIs $10k-25k, 1.8% for AGIs $25k-50k, 2.7% for AGIs $50k-75k, 2.8% for AGIs $75k-100k, 3.6% for AGIs over 100k)
Taxable dividends: $2,922 (reported on 14.3% of returns)
Here:
$2,922
State:
$4,261
(% of AGI for various income ranges: 7.4% for AGIs below $10k, 1.1% for AGIs $10k-25k, 0.9% for AGIs $25k-50k, 0.8% for AGIs $50k-75k, 1.2% for AGIs $75k-100k, 3.2% for AGIs over 100k)
Net capital gain/loss: +$6,197 (reported on 13.0% of returns)
Here:
+$6,197
State:
+$16,110
(% of AGI for various income ranges: 0.2% for AGIs below $10k, -0.1% for AGIs $10k-25k, 0.5% for AGIs $25k-50k, 1.0% for AGIs $50k-75k, 2.2% for AGIs $75k-100k, 13.9% for AGIs over 100k)
Profit/loss from business: +$4,913 (reported on 17.3% of returns)
Here:
+$4,913
State:
+$11,013
(% of AGI for various income ranges: 22.2% for AGIs below $10k, 4.9% for AGIs $10k-25k, 2.1% for AGIs $25k-50k, 0.9% for AGIs $50k-75k, 2.8% for AGIs $75k-100k, 2.5% for AGIs over 100k)
IRA payment deduction: $2,943 (reported on 1.8% of returns)
75862:
$2,943
Texas:
$3,120
Total itemized deductions: $17,483 (30% of AGI, reported on 14.9% of returns)
Here:
$17,483
State:
$19,631
Here:
29.6% of AGI
State:
18.9% of AGI
(% of AGI for various income ranges: 14.2% for AGIs below $10k, 6.3% for AGIs $10k-25k, 8.2% for AGIs $25k-50k, 9.6% for AGIs $50k-75k, 11.2% for AGIs $75k-100k, 11.3% for AGIs over 100k)
Charity contributions deductions: $4,274 (7% of AGI, reported on 11.0% of returns)
Here:
$4,274
State:
$4,753
Here:
6.7% of AGI
State:
4.2% of AGI
(% of AGI for various income ranges: 1.0% for AGIs below $10k, 1.0% for AGIs $10k-25k, 1.1% for AGIs $25k-50k, 1.8% for AGIs $50k-75k, 2.2% for AGIs $75k-100k, 3.0% for AGIs over 100k)
Total tax: $3,768 (reported on 64.1% of returns)
75862:
$3,768
State:
$9,058
(% of AGI for various income ranges: 4.1% for AGIs below $10k, 3.3% for AGIs $10k-25k, 5.9% for AGIs $25k-50k, 9.2% for AGIs $50k-75k, 11.5% for AGIs $75k-100k, 16.8% for AGIs over 100k)
Earned income credit: $1,943 (reported on 28.0% of returns)
Here:
$1,943
State:
$2,024
Percentage of individuals using paid preparers for their 2004 taxes: 65.0%
Here:
65%
State:
57%
(% for various income ranges: 62.9% for AGIs below $10k, 67.2% for AGIs $10k-25k, 63.1% for AGIs $25k-50k, 64.8% for AGIs $50k-75k, 62.7% for AGIs $75k-100k, 78.9% for AGIs over 100k)
Household received Food Stamps/SNAP in the past 12 months: 578 Household did not receive Food Stamps/SNAP in the past 12 months: 4,005
Women who had a birth in the past 12 months: 124 (83 now married, 40 unmarried) Women who did not have a birth in the past 12 months: 1,598 (726 now married, 871 unmarried)
Housing units in zip code 75862 with a mortgage: 1,288 (80 second mortgage, 15 home equity loan, 61 both second mortgage and home equity loan) Median monthly owner costs for units with a mortgage: $1,416 Median monthly owner costs for units without a mortgage: $428
Residents with income below the poverty level in 2022:
This zip code:
14.8%
Whole state:
14.0%
Residents with income below 50% of the poverty level in 2022:
This zip code:
4.8%
Whole state:
7.4%
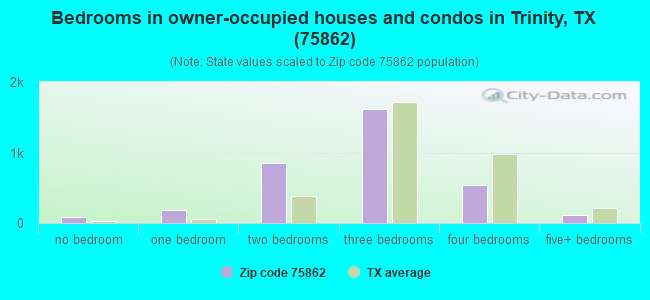
Median number of rooms in houses and condos:
Here:
5.1
State:
6.3
Median number of rooms in apartments:
Here:
4.7
State:
4.0
Notable locations in this zip code not listed on our city pages
Churches in zip code 75862 include: Thornton Church (A), Rocky Ford Church (B), New Hope Church (C), White Rock Church (D). Display/hide their locations on the map
Cemeteries: Spivey Cemetery (1), Dunlap Cemetery (2), Glendale Cemetery (3), Boontown Cemetery (4), Saron Cemetery (5), White Rock Cemetery (6), New Zion Cemetery (7). Display/hide their locations on the map
Lakes and reservoirs: Horseshoe Lake (A), Waller Lake (B), Sentell Lake (C), Mill Pond (D), Haraldson Lake (E), Thornton Lake (F), Horseshoe Lake (G), Westwood Lake (H). Display/hide their locations on the map
Streams, rivers, and creeks: Big Branch (A), Bear Branch (B), Baggy Branch (C), Turner Creek (D), Village Creek (E), Tantabogue Creek (F), Fountain Creek (G), Whites Creek (H), White Rock Creek (I). Display/hide their locations on the map
In group quarters: 80 (-1 institutionalized population)
Size of family households: 1,526 2-persons, 722 3-persons, 557 4-persons, 137 5-persons, 32 6-persons, 32 7-or-more-persons
Size of nonfamily households: 1,420 1-person, 136 2-persons, 32 3-persons
1,013 married couples with children.
811 single-parent households (433 men, 378 women).
88.1% of residents of 75862 zip code speak English at home.
9.7% of residents speak Spanish at home (55% very well, 30% well, 8% not well, 7% not at all).
2.1% of residents speak other Indo-European language at home (100% very well).
0.7% of residents speak Asian or Pacific Island language at home (100% very well).
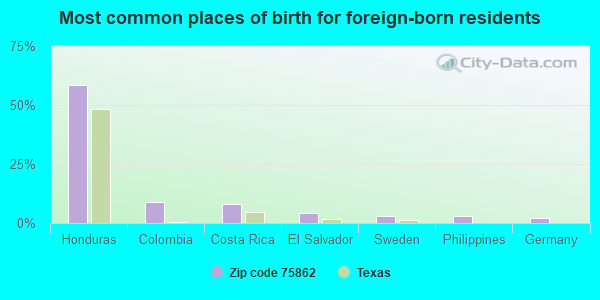
Foreign born population: 442 (4.3%) (36.9% of them are naturalized citizens)
This zip code:
4.3%
Whole state:
17.2%
59%Honduras
9%Colombia
8%Costa Rica
4%El Salvador
3%Sweden
3%Philippines
2%Germany
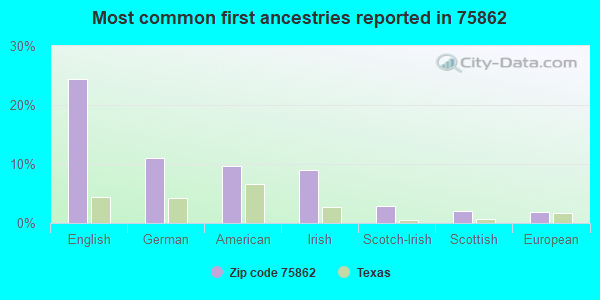
24%English
11%German
10%American
9%Irish
3%Scotch-Irish
2%Scottish
2%European
Year of entry for the foreign-born population
1232010 or later
1692000 to 2009
181990 to 1999
192Before 1990
Facilities with environmental interests located in this zip code:
A-1 AUTO & TRUCK SALVAGE (1810 ROBB ST in TRINITY, TX)
(Integrated Compliance Information System) - ICIS-06-2000-0059, FORMAL ENFORCEMENT ACTION Business SIC classification: MOTOR VEHICLE PARTS, USED
AINSWORTH FORD INC (HWY 19 NORTH OF in TRINITY, TX)
(Resource Conservation and Recovery Act (tracking hazardous waste))
AZTEC COVE WWTP (7MI E CITY OF TRINITY,N SIDE in TRINITY, TX)
National Pollutant Discharge Elimination System NON-MAJOR (Tracking pollutant discharge elimination systems) - permit Business SIC classification: SEWERAGE SYSTEMS Organizations: AZTEC COVE PROPERTY OWNERS (CONTACT/OWNER)
Alternative names: AZTEC COVE PROPERTY OWNERS, AZTEC COVE PROPERTY OWNERS AS, AZTEC COVE PROPERTY OWNERS ASS, AZTEC COVE WASTEWTR P OWNERS A
ATCHLEY LUMBER & SUPPLY INCORPORATED (200 PINE VALLEY DRIVE in TRINITY, TX)
Small Quantity Generators, between 100 kg and 1000 kg of hazardous waste/month (Resource Conservation and Recovery Act (tracking hazardous waste)) - notification TRI REPORTER (Tracking of toxic chemicals releasing facilities) Business SIC classification: WOOD PRESERVING Alternative names: ATCHLEY LMBR & SUPPLY
Housing units lacking complete plumbing facilities: 7.3% Housing units lacking complete kitchen facilities: 5.3%
80.4%Electricity
11.9%Utility gas
5.6%Bottled, tank, or LP gas
1.3%Wood
0.8%No fuel used
Population in 1990: 7,585. Population change in the 1990s: +1,765 (+23.3%).
Place of birth for U.S.-born residents:
This state: 7,196
Northeast: 278
Midwest: 645
South: 1,155
West: 449
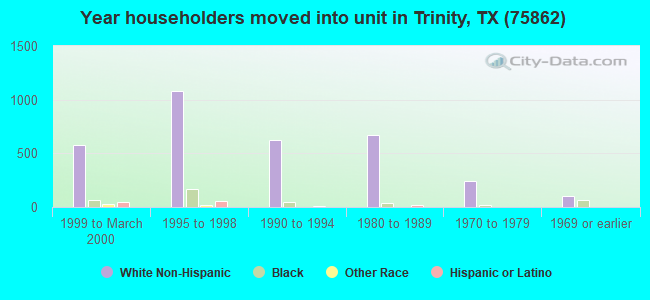
54% of the 75862 zip code residents lived in the same house 5 years ago. Out of people who lived in different houses, 39% lived in this county. Out of people who lived in different counties, 50% lived in Texas.
82% of the 75862 zip code residents lived in the same house 1 year ago. Out of people who lived in different houses, 26% moved from this county. Out of people who lived in different houses, 63% moved from different county within same state. Out of people who lived in different houses, 9% moved from different state. Out of people who lived in different houses, 3% moved from abroad.
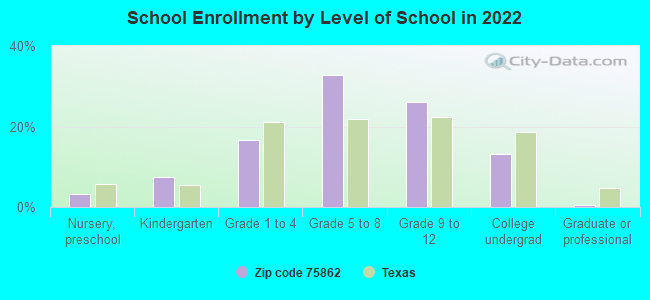
Private vs. public school enrollment:
Students in private schools in grades 1 to 8 (elementary and middle school): 150
Here:
16.1%
Texas:
8.8%
Students in private schools in grades 9 to 12 (high school): 25
Here:
5.4%
Texas:
8.0%
Students in private undergraduate colleges: 35
Here:
14.4%
Texas:
16.2%
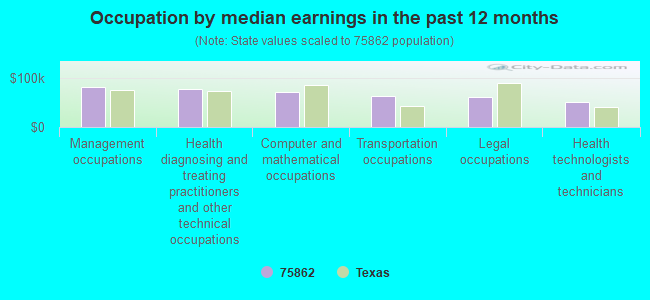
Occupation by median earnings in the past 12 months ($)
81,102Management occupations
76,989Health diagnosing and treating practitioners and other technical occupations
71,701Computer and mathematical occupations
63,589Transportation occupations
60,792Legal occupations
51,463Health technologists and technicians
Companies with federal contracts located in this zip code:
EHPRO CUSTOM FABRICATION (740 GRAND ROCK POINT DR in TRINITY, TX; small business)
$10,732 with Army for Structural Shapes. Taking place in IA. Signed on 2005-05-02. Completion date: 2005-06-17.
Top industries in this zip code by the number of employees in 2005:
Other Services (except Public Administration): Religious Organizations (20-49 employees: 2 establishments, 5-9 employees: 2 establishments, 1-4 employees: 8 establishments)
Arts, Entertainment, and Recreation: Golf Courses and Country Clubs (50-99: 1)
Health Care and Social Assistance: Nursing Care Facilities (50-99: 1)
Health Care and Social Assistance: General Medical and Surgical Hospitals (50-99: 1)
Wholesale Trade: Beer and Ale Merchant Wholesalers (20-49: 2)
3 people in local jails and other confinement facilities (including police lockups)
Fatal accident statistics in 2014:
Fatal accident count: 2
Vehicles involved in fatal accidents: 4
Fatal accidents caused by drunken drivers: 0
Fatalities: 3
Persons involved in fatal accidents: 9
Pedestrians involved in fatal accidents: 0
Fatal accident statistics in 2013:
Fatal accident count: 4
Vehicles involved in fatal accidents: 5
Fatal accidents caused by drunken drivers: 1
Fatalities: 5
Persons involved in fatal accidents: 6
Pedestrians involved in fatal accidents: 1
2003 - 2017 National Fire Incident Reporting System (NFIRS) incidents
According to the data from the years 2003 - 2017 the average number of fire incidents per year is 59. The highest number of reported fire incidents - 139 took place in 2008, and the least - 8 in 2007. The data has a decreasing trend.
When looking into fire subcategories, the most incidents belonged to: Outside Fires (55.3%), and Structure Fires (33.7%).
Fire incident types reported to NFIRS in Zip Code 75862
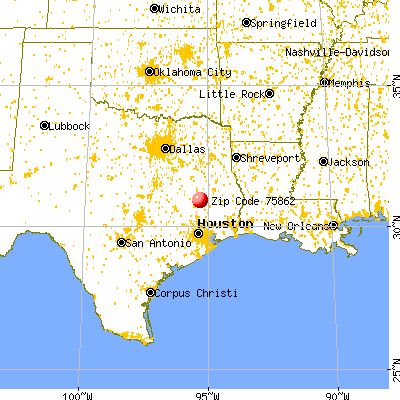


 Nearest zip codes: 77367, 77334, 77359, 75851, 77364, 75856.
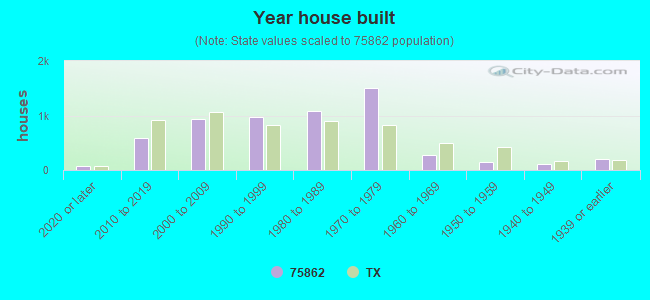


 According to the data from the years 2003 - 2017 the average number of fire incidents per year is 59. The highest number of reported fire incidents - 139 took place in 2008, and the least - 8 in 2007. The data has a decreasing trend.
 When looking into fire subcategories, the most incidents belonged to: Outside Fires (55.3%), and Structure Fires (33.7%).