Estimated zip code population in 2022: 2,185 Zip code population in 2010: 1,766 Zip code population in 2000: 2,045
Houses and condos: 1,091 Renter-occupied apartments: 190
% of renters here:
21%
State:
38%
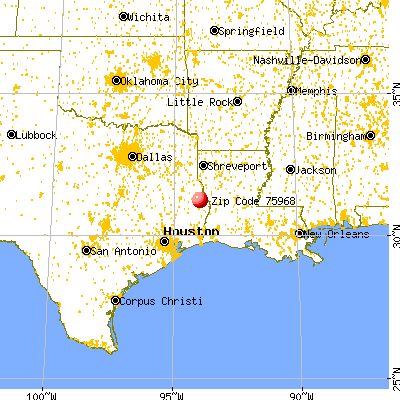
March 2022 cost of living index in zip code 75968: 77.8 (low, U.S. average is 100)
Land area: 73.4 sq. mi. Water area: 1.5 sq. mi.
Population density: 30 people per square mile
(very low).
OSM Map
General Map
Google Map
MSN Map
OSM Map
General Map
Google Map
MSN Map
OSM Map
General Map
Google Map
MSN Map
OSM Map
General Map
Google Map
MSN Map
Please wait while loading the map...
Real estate property taxes paid for housing units in 2022:
This zip code:
1.0% ($1,111)
Texas:
1.5% ($4,050)
Median real estate property taxes paid for housing units with mortgages in 2022: $1,400 (1.5%) Median real estate property taxes paid for housing units with no mortgage in 2022: $1,022 (0.8%)
Business Search- 14 Million verified businesses
Males: 978
(44.8%)
Females: 1,206
(55.2%)
For population 25 years and over in 75968:
High school or higher: 82.4%
Bachelor's degree or higher: 11.7%
Graduate or professional degree: 6.3%
Unemployed: 7.4%
Mean travel time to work (commute): 22.2 minutes
For population 15 years and over in 75968:
Never married: 31.2%
Now married: 45.5%
Separated: 0.7%
Widowed: 10.7%
Divorced: 11.9%
Zip code 75968 compared to state average:
Median household income below state average.
Median house value significantly below state average.
Hispanic race population percentage significantly below state average.
Median age above state average.
Foreign-born population percentage significantly below state average.
Renting percentage below state average.
Percentage of population with a bachelor's degree or higher significantly below state average.
Averages for the 2020 tax year for zip code 75968, filed in 2021:
Average Adjusted Gross Income (AGI) in 2020: $46,956 (Individual Income Tax Returns)
Here:
$46,956
State:
$77,054
Salary/wage: $45,226 (reported on 82.7% of returns)
Here:
$45,226
State:
$62,766
(% of AGI for various income ranges: 1165.4% for AGIs below $25k, 3755.3% for AGIs $25k-50k, 6371.4% for AGIs $50k-75k, 9710.0% for AGIs $75k-100k, 16770.0% for AGIs $100k-200k)
Taxable interest for individuals: $553 (reported on 20.0% of returns)
This zip code:
$553
Texas:
$2,665
(% of AGI for various income ranges: 3.8% for AGIs below $25k, 18.7% for AGIs $25k-50k, 21.4% for AGIs $50k-75k, 50.0% for AGIs $100k-200k)
Ordinary dividends: $3,600 (reported on 4.0% of returns)
Here:
$3,600
State:
$10,044
(% of AGI for various income ranges: 154.3% for AGIs $50k-75k)
Net capital gain/loss in AGI: +$1,275 (reported on 5.3% of returns)
Here:
+$1,275
State:
+$39,590
(% of AGI for various income ranges: 72.9% for AGIs $50k-75k)
Taxable individual retirement arrangement distribution: $24,560 (reported on 6.7% of returns)
75968:
$24,560
Texas:
$24,740
(% of AGI for various income ranges: 105.0% for AGIs below $25k, 1364.3% for AGIs $50k-75k)
Earned income credit: $2,676 (reported on 28.0% of returns)
Here:
$2,676
State:
$2,584
(% of AGI for various income ranges: 167.3% for AGIs below $25k, 84.7% for AGIs $25k-50k)
Percentage of individuals using paid preparers for their 2020 taxes: 92.0%
Here:
92%
State:
92%
(% for various income ranges: 93.5% for AGIs below $25k, 94.7% for AGIs $25k-50k, 88.9% for AGIs $50k-75k, 85.7% for AGIs $75k-100k, 88.9% for AGIs $100k-200k)
Averages for the 2012 tax year for zip code 75968, filed in 2013:
Average Adjusted Gross Income (AGI) in 2012: $46,089 (Individual Income Tax Returns)
Here:
$46,089
State:
$65,384
Salary/wage: $41,648 (reported on 88.7% of returns)
Here:
$41,648
State:
$52,524
(% of AGI for various income ranges: 81.7% for AGIs below $25k, 89.8% for AGIs $25k-50k, 87.3% for AGIs $50k-75k, 83.6% for AGIs $75k-100k, 68.2% for AGIs $100k-200k)
Taxable interest for individuals: $683 (reported on 16.9% of returns)
This zip code:
$683
Texas:
$2,372
(% of AGI for various income ranges: 0.1% for AGIs below $25k, 0.5% for AGIs $50k-75k, 0.4% for AGIs $100k-200k)
Ordinary dividends: $3,675 (reported on 5.6% of returns)
Here:
$3,675
State:
$9,721
Profit/loss from business: +$10,136 (reported on 15.5% of returns)
Here:
+$10,136
State:
+$13,732
(% of AGI for various income ranges: 2.5% for AGIs below $25k, 0.4% for AGIs $25k-50k, 9.4% for AGIs $100k-200k)
Taxable individual retirement arrangement distribution: $12,475 (reported on 5.6% of returns)
75968:
$12,475
Texas:
$19,511
Total itemized deductions: $25,708 (31% of AGI, reported on 16.9% of returns)
Here:
$25,708
State:
$24,724
Here:
31.0% of AGI
State:
15.9% of AGI
(% of AGI for various income ranges: 10.5% for AGIs $25k-50k, 14.3% for AGIs $50k-75k, 11.1% for AGIs $75k-100k, 8.4% for AGIs $100k-200k)
Charity contributions: $3,457 (reported on 9.9% of returns)
Here:
$3,457
State:
$6,808
Taxes paid: $3,182 (reported on 15.5% of returns)
75968:
$3,182
State:
$6,921
(% of AGI for various income ranges: 1.0% for AGIs $25k-50k, 1.4% for AGIs $50k-75k, 1.1% for AGIs $75k-100k, 1.3% for AGIs $100k-200k)
Earned income credit: $2,452 (reported on 29.6% of returns)
Here:
$2,452
State:
$2,570
(% of AGI for various income ranges: 10.7% for AGIs below $25k, 1.6% for AGIs $25k-50k)
Percentage of individuals using paid preparers for their 2012 taxes: 57.7%
Here:
58%
State:
51%
(% for various income ranges: 53.1% for AGIs below $25k, 57.1% for AGIs $25k-50k, 54.5% for AGIs $50k-75k, 71.4% for AGIs $75k-100k, 71.4% for AGIs $100k-200k)
Averages for the 2004 tax year for zip code 75968, filed in 2005:
Average Adjusted Gross Income (AGI) in 2004: $33,641 (Individual Income Tax Returns)
Here:
$33,641
State:
$47,881
Salary/wage: $30,598 (reported on 88.3% of returns)
Here:
$30,598
State:
$41,947
(% of AGI for various income ranges: 97.8% for AGIs below $10k, 80.5% for AGIs $10k-25k, 87.3% for AGIs $25k-50k, 86.2% for AGIs $50k-75k, 80.7% for AGIs $75k-100k, 55.7% for AGIs over 100k)
Taxable interest for individuals: $1,177 (reported on 26.3% of returns)
This zip code:
$1,177
Texas:
$2,255
(% of AGI for various income ranges: 1.2% for AGIs below $10k, 0.4% for AGIs $10k-25k, 0.8% for AGIs $25k-50k, 1.6% for AGIs $50k-75k, 0.0% for AGIs $75k-100k, 0.9% for AGIs over 100k)
Taxable dividends: $2,426 (reported on 7.6% of returns)
Here:
$2,426
State:
$4,261
(% of AGI for various income ranges: 0.2% for AGIs $10k-25k, 0.3% for AGIs $25k-50k, 0.2% for AGIs $50k-75k, 2.3% for AGIs over 100k)
Net capital gain/loss: +$20 (reported on 7.2% of returns)
Here:
+$20
State:
+$16,110
(% of AGI for various income ranges: -1.1% for AGIs below $10k, 0.1% for AGIs $25k-50k, -0.3% for AGIs $50k-75k, 0.5% for AGIs over 100k)
Profit/loss from business: +$4,204 (reported on 15.3% of returns)
Here:
+$4,204
State:
+$11,013
(% of AGI for various income ranges: 3.8% for AGIs below $10k, 7.3% for AGIs $10k-25k, 0.4% for AGIs $25k-50k, 2.1% for AGIs $50k-75k)
Total itemized deductions: $18,340 (26% of AGI, reported on 13.3% of returns)
Here:
$18,340
State:
$19,631
Here:
25.9% of AGI
State:
18.9% of AGI
(% of AGI for various income ranges: 4.5% for AGIs $10k-25k, 6.5% for AGIs $25k-50k, 11.7% for AGIs $50k-75k, 9.1% for AGIs over 100k)
Charity contributions deductions: $4,210 (6% of AGI, reported on 8.8% of returns)
Here:
$4,210
State:
$4,753
Here:
5.9% of AGI
State:
4.2% of AGI
Total tax: $4,199 (reported on 66.1% of returns)
75968:
$4,199
State:
$9,058
(% of AGI for various income ranges: 2.2% for AGIs below $10k, 3.1% for AGIs $10k-25k, 5.5% for AGIs $25k-50k, 8.6% for AGIs $50k-75k, 12.0% for AGIs $75k-100k, 15.4% for AGIs over 100k)
Earned income credit: $1,965 (reported on 28.0% of returns)
Here:
$1,965
State:
$2,024
Percentage of individuals using paid preparers for their 2004 taxes: 60.4%
Here:
60%
State:
57%
(% for various income ranges: 57.1% for AGIs below $10k, 64.2% for AGIs $10k-25k, 60.4% for AGIs $25k-50k, 57.9% for AGIs $50k-75k, 51.9% for AGIs $75k-100k, 65.4% for AGIs over 100k)
Household received Food Stamps/SNAP in the past 12 months: 204 Household did not receive Food Stamps/SNAP in the past 12 months: 691
Women who had a birth in the past 12 months: 59 (27 now married, 31 unmarried) Women who did not have a birth in the past 12 months: 469 (183 now married, 286 unmarried)
Housing units in zip code 75968 with a mortgage: 228 Median monthly owner costs for units with a mortgage: $959 Median monthly owner costs for units without a mortgage: $443
Residents with income below the poverty level in 2022:
This zip code:
30.2%
Whole state:
14.0%
Residents with income below 50% of the poverty level in 2022:
This zip code:
16.8%
Whole state:
7.4%
Median number of rooms in houses and condos:
Here:
6.0
State:
6.3
Median number of rooms in apartments:
Here:
4.4
State:
4.0
Notable locations in this zip code not listed on our city pages
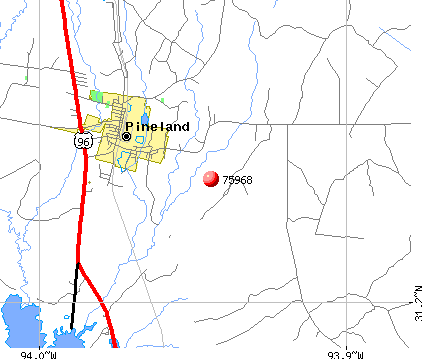
Cemeteries: Lott Cemetery (1), Martin Cemetery (2), Pleasant Grove Cemetery (3), Bethany Chapel Baptist Church Cemetery (4), Goodwill Cemetery (5), Jacks Cemetery (6), Lone Star Cemetery (7). Display/hide their locations on the map
Streams, rivers, and creeks: Walker Creek (A), Rush Branch (B), Oz Branch (C), Little Creek (D), Easley Creek (E), Devils Ford Creek (F), Cobb Branch (G), Sandy Creek (H), Lick Branch (I). Display/hide their locations on the map
179 married couples with children.
240 single-parent households (78 men, 162 women).
98.9% of residents of 75968 zip code speak English at home.
1.0% of residents speak Spanish at home (90% very well, 10% not at all).
Foreign born population: 4 (0.2%) (0.0% of them are naturalized citizens)
:
0.2%
Whole state:
17.2%
80%Honduras
42%American
13%Irish
8%English
2%French
1%Scottish
1%Scotch-Irish
1%European
Year of entry for the foreign-born population
02010 or later
02000 to 2009
01990 to 1999
12Before 1990
Housing units lacking complete plumbing facilities: 8.9% Housing units lacking complete kitchen facilities: 7.4%
80.2%Electricity
10.4%Utility gas
5.0%Bottled, tank, or LP gas
2.7%Other fuel
2.0%No fuel used
Population in 1990: 1,279. Population change in the 1990s: +766 (+59.9%).
Place of birth for U.S.-born residents:
This state: 1,728
Northeast: 32
Midwest: 53
South: 245
West: 97
64% of the 75968 zip code residents lived in the same house 5 years ago. Out of people who lived in different houses, 58% lived in this county. Out of people who lived in different counties, 50% lived in Texas.
90% of the 75968 zip code residents lived in the same house 1 year ago. Out of people who lived in different houses, 39% moved from this county. Out of people who lived in different houses, 53% moved from different county within same state. Out of people who lived in different houses, 9% moved from different state.
Private vs. public school enrollment:
Students in private schools in grades 1 to 8 (elementary and middle school):
Here:
0.0%
Texas:
8.8%
Students in private schools in grades 9 to 12 (high school): 41
Here:
20.8%
Texas:
8.0%
Students in private undergraduate colleges:
Here:
0.0%
Texas:
16.2%
Occupation by median earnings in the past 12 months ($)
76,050Transportation occupations
67,498Construction and extraction occupations
63,554Health diagnosing and treating practitioners and other technical occupations
58,362Management occupations
56,422Business and financial operations occupations
56,293Education, training, and library occupations
Companies with federal contracts located in this zip code:
ROGER D MITCHELL (116 MAYBELLE LOOP in PINELAND, TX) : $47,177 in 11 contractsfrom 2003 to 2005
Contracts for Recreation Site Maintenance Services (non-construction), Landscaping/Groundskeeping Services by Army, U.S. Army Corps of Engineers - civil program financing only Signed by year:2000: $0; 2001: $0; 2002: $0; 2003: $5,628; 2004: $39,594; 2005: $1,955; 2006: $0.
Biggest contracts:
$18,984 with Army for Recreation Site Maintenance Services (non-construction). Signed on 2004-01-16. Completion date: 2003-12-30.
$15,000 with Army for Landscaping/Groundskeeping Services. Signed on 2004-03-05. Completion date: 2005-02-28.
$3,740 with U.S. Army Corps of Engineers - civil program financing only for Recreation Site Maintenance Services (non-construction). Signed on 2004-10-25. Completion date: 2004-08-10.
$2,380, same as above.Signed on 2004-12-16. Completion date: 2004-08-10.
DICKERSON, ROBERT (204 MAGNOLIA ST in PINELAND, TX; small business) : $41,850 in 3 contractsfrom 2005 to 2006
$14,670 with Army for Recreation Site Maintenance Services (non-construction). Signed on 2006-02-16. Completion date: 2006-02-06.
$13,590, same as above.Signed on 2005-03-17. Completion date: 2005-09-06.
$13,590 with U.S. Army Corps of Engineers - civil program financing only for Recreation Site Maintenance Services (non-construction). Signed on 2005-03-17. Completion date: 2005-09-06.
Top industries in this zip code by the number of employees in 2005:
Finance and Insurance: Commercial Banking (10-19: 1)
Wholesale Trade: Motor Vehicle Parts (Used) Merchant Wholesalers (10-19: 1)
Other Services (except Public Administration): Religious Organizations (5-9: 1, 1-4: 2)
Administrative and Support and Waste Management and Remediation Services: Landscaping Services (5-9: 1, 1-4: 1)
People in group quarters in 2010:
6 people in residential treatment centers for adults
People in group quarters in 2000:
50 people in nursing homes
6 people in homes for the mentally retarded
Fatal accident statistics in 2013:
Fatal accident count: 1
Vehicles involved in fatal accidents: 2
Fatal accidents caused by drunken drivers: 0
Fatalities: 1
Persons involved in fatal accidents: 4
Pedestrians involved in fatal accidents: 0
Fatal accident statistics in 2010:
Fatal accident count: 3
Vehicles involved in fatal accidents: 5
Fatal accidents caused by drunken drivers: 0
Fatalities: 4
Persons involved in fatal accidents: 7
Pedestrians involved in fatal accidents: 0
2002 - 2018 National Fire Incident Reporting System (NFIRS) incidents
According to the data from the years 2002 - 2018 the average number of fires per year is 9. The highest number of fire incidents - 62 took place in 2005, and the least - 0 in 2003. The data has a dropping trend.
When looking into fire subcategories, the most incidents belonged to: Outside Fires (44.0%), and Structure Fires (30.8%).
Fire incident types reported to NFIRS in Zip Code 75968


 Nearest zip codes: 75930, 75931, 75948, 75929, 75977, 75959.


 : $47,177 in 11 contracts from 2003 to 2005


 According to the data from the years 2002 - 2018 the average number of fires per year is 9. The highest number of fire incidents - 62 took place in 2005, and the least - 0 in 2003. The data has a dropping trend.
 When looking into fire subcategories, the most incidents belonged to: Outside Fires (44.0%), and Structure Fires (30.8%).