Estimated zip code population in 2022: 2,589 Zip code population in 2010: 2,836 Zip code population in 2000: 2,548
Houses and condos: 1,968 Renter-occupied apartments: 143
% of renters here:
13%
State:
38%
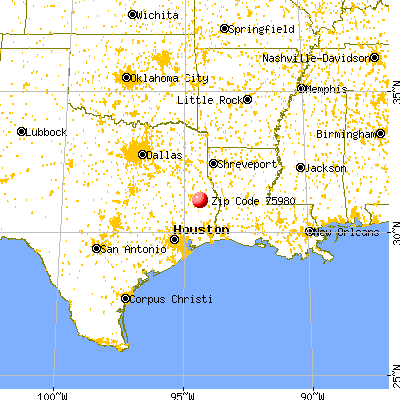
March 2022 cost of living index in zip code 75980: 78.6 (low, U.S. average is 100)
Land area: 161.6 sq. mi. Water area: 38.2 sq. mi.
Population density: 16 people per square mile
(very low).
OSM Map
General Map
Google Map
MSN Map
OSM Map
General Map
Google Map
MSN Map
OSM Map
General Map
Google Map
MSN Map
OSM Map
General Map
Google Map
MSN Map
Please wait while loading the map...
Real estate property taxes paid for housing units in 2022:
This zip code:
0.7% ($653)
Texas:
1.5% ($4,050)
Median real estate property taxes paid for housing units with mortgages in 2022: $1,339 (1.4%) Median real estate property taxes paid for housing units with no mortgage in 2022: $620 (0.8%)
Averages for the 2020 tax year for zip code 75980, filed in 2021:
Average Adjusted Gross Income (AGI) in 2020: $59,989 (Individual Income Tax Returns)
Here:
$59,989
State:
$77,054
Salary/wage: $46,500 (reported on 75.7% of returns)
Here:
$46,500
State:
$62,766
(% of AGI for various income ranges: 1005.8% for AGIs below $25k, 3184.0% for AGIs $25k-50k, 6065.0% for AGIs $50k-75k, 7728.6% for AGIs $75k-100k, 16786.7% for AGIs $100k-200k)
Taxable interest for individuals: $1,111 (reported on 27.2% of returns)
This zip code:
$1,111
Texas:
$2,665
(% of AGI for various income ranges: 17.9% for AGIs below $25k, 11.0% for AGIs $25k-50k, 34.0% for AGIs $50k-75k, 81.4% for AGIs $75k-100k, 154.4% for AGIs $100k-200k)
Ordinary dividends: $2,746 (reported on 12.6% of returns)
Here:
$2,746
State:
$10,044
(% of AGI for various income ranges: 17.6% for AGIs below $25k, 29.5% for AGIs $25k-50k, 80.0% for AGIs $75k-100k, 204.4% for AGIs $100k-200k)
Net capital gain/loss in AGI: +$14,058 (reported on 11.7% of returns)
Here:
+$14,058
State:
+$39,590
(% of AGI for various income ranges: 9.4% for AGIs below $25k, 15.5% for AGIs $25k-50k, 43.0% for AGIs $50k-75k, 1757.8% for AGIs $100k-200k)
Profit/loss from business: +$4,400 (reported on 14.6% of returns)
Here:
+$4,400
State:
+$10,888
(% of AGI for various income ranges: 51.5% for AGIs below $25k, 79.0% for AGIs $50k-75k, 501.1% for AGIs $100k-200k)
Taxable individual retirement arrangement distribution: $25,000 (reported on 9.7% of returns)
75980:
$25,000
Texas:
$24,740
(% of AGI for various income ranges: 230.5% for AGIs $25k-50k, 937.0% for AGIs $50k-75k, 1224.4% for AGIs $100k-200k)
Total itemized deductions: $31,267 (reported on 2.9% of returns)
Here:
$31,267
State:
$40,428
(% of AGI for various income ranges: 938.0% for AGIs $50k-75k)
Taxes paid: $6,550 (reported on 1.9% of returns)
75980:
$6,550
State:
$7,821
(% of AGI for various income ranges: 131.0% for AGIs $50k-75k)
Earned income credit: $2,300 (reported on 23.3% of returns)
Here:
$2,300
State:
$2,584
(% of AGI for various income ranges: 126.7% for AGIs below $25k, 67.0% for AGIs $25k-50k)
Percentage of individuals using paid preparers for their 2020 taxes: 94.2%
Here:
94%
State:
92%
(% for various income ranges: 92.7% for AGIs below $25k, 96.0% for AGIs $25k-50k, 92.3% for AGIs $50k-75k, 90.0% for AGIs $75k-100k, 100.0% for AGIs $100k-200k, 100.0% for AGIs over 200k)
Averages for the 2012 tax year for zip code 75980, filed in 2013:
Average Adjusted Gross Income (AGI) in 2012: $45,054 (Individual Income Tax Returns)
Here:
$45,054
State:
$65,384
Salary/wage: $42,267 (reported on 76.5% of returns)
Here:
$42,267
State:
$52,524
(% of AGI for various income ranges: 66.9% for AGIs below $25k, 71.0% for AGIs $25k-50k, 76.5% for AGIs $50k-75k, 78.3% for AGIs $75k-100k, 67.7% for AGIs $100k-200k)
Taxable interest for individuals: $1,148 (reported on 23.5% of returns)
This zip code:
$1,148
Texas:
$2,372
(% of AGI for various income ranges: 1.0% for AGIs below $25k, 0.8% for AGIs $25k-50k, 1.0% for AGIs $50k-75k, 0.3% for AGIs $100k-200k)
Ordinary dividends: $2,136 (reported on 11.2% of returns)
Here:
$2,136
State:
$9,721
(% of AGI for various income ranges: 0.8% for AGIs below $25k, 1.0% for AGIs $25k-50k, 0.6% for AGIs $50k-75k, 0.8% for AGIs $75k-100k)
Profit/loss from business: +$9,521 (reported on 14.3% of returns)
Here:
+$9,521
State:
+$13,732
(% of AGI for various income ranges: 9.8% for AGIs below $25k, 1.7% for AGIs $25k-50k, 10.0% for AGIs $75k-100k)
Taxable individual retirement arrangement distribution: $18,983 (reported on 12.2% of returns)
75980:
$18,983
Texas:
$19,511
(% of AGI for various income ranges: 4.4% for AGIs below $25k, 4.9% for AGIs $25k-50k, 3.4% for AGIs $50k-75k, 19.0% for AGIs $75k-100k)
Total itemized deductions: $24,633 (25% of AGI, reported on 15.3% of returns)
Here:
$24,633
State:
$24,724
Here:
25.4% of AGI
State:
15.9% of AGI
(% of AGI for various income ranges: 9.9% for AGIs $25k-50k, 6.7% for AGIs $50k-75k, 10.0% for AGIs $75k-100k, 10.7% for AGIs $100k-200k)
Charity contributions: $4,267 (reported on 9.2% of returns)
Here:
$4,267
State:
$6,808
(% of AGI for various income ranges: 1.0% for AGIs $25k-50k, 1.4% for AGIs $50k-75k, 1.2% for AGIs $100k-200k)
Taxes paid: $3,921 (reported on 14.3% of returns)
75980:
$3,921
State:
$6,921
(% of AGI for various income ranges: 1.0% for AGIs $25k-50k, 0.7% for AGIs $50k-75k, 1.5% for AGIs $75k-100k, 2.1% for AGIs $100k-200k)
Earned income credit: $2,312 (reported on 25.5% of returns)
Here:
$2,312
State:
$2,570
(% of AGI for various income ranges: 9.9% for AGIs below $25k, 0.8% for AGIs $25k-50k)
Percentage of individuals using paid preparers for their 2012 taxes: 46.9%
Here:
47%
State:
51%
(% for various income ranges: 44.2% for AGIs below $25k, 41.7% for AGIs $25k-50k, 46.7% for AGIs $50k-75k, 62.5% for AGIs $75k-100k, 62.5% for AGIs $100k-200k)
Averages for the 2004 tax year for zip code 75980, filed in 2005:
Average Adjusted Gross Income (AGI) in 2004: $30,103 (Individual Income Tax Returns)
Here:
$30,103
State:
$47,881
Salary/wage: $27,336 (reported on 78.0% of returns)
Here:
$27,336
State:
$41,947
(% of AGI for various income ranges: 84.4% for AGIs below $10k, 71.9% for AGIs $10k-25k, 73.5% for AGIs $25k-50k, 76.1% for AGIs $50k-75k, 79.6% for AGIs $75k-100k, 44.7% for AGIs over 100k)
Taxable interest for individuals: $1,625 (reported on 32.9% of returns)
This zip code:
$1,625
Texas:
$2,255
(% of AGI for various income ranges: 4.6% for AGIs below $10k, 3.1% for AGIs $10k-25k, 1.1% for AGIs $25k-50k, 2.2% for AGIs $50k-75k, 0.7% for AGIs $75k-100k, 0.6% for AGIs over 100k)
Taxable dividends: $1,242 (reported on 12.3% of returns)
Here:
$1,242
State:
$4,261
(% of AGI for various income ranges: 2.2% for AGIs below $10k, 1.1% for AGIs $10k-25k, 0.3% for AGIs $25k-50k, 0.6% for AGIs $50k-75k)
Net capital gain/loss: +$2,303 (reported on 10.2% of returns)
Here:
+$2,303
State:
+$16,110
(% of AGI for various income ranges: -2.1% for AGIs below $10k, -0.4% for AGIs $10k-25k, 0.3% for AGIs $25k-50k, 1.2% for AGIs $50k-75k, 6.2% for AGIs $75k-100k)
Profit/loss from business: +$6,101 (reported on 18.3% of returns)
Here:
+$6,101
State:
+$11,013
(% of AGI for various income ranges: 16.5% for AGIs below $10k, 4.3% for AGIs $10k-25k, 3.2% for AGIs $25k-50k, 5.6% for AGIs $50k-75k)
IRA payment deduction: $3,000 (reported on 1.2% of returns)
75980:
$3,000
Texas:
$3,120
Total itemized deductions: $17,694 (35% of AGI, reported on 12.8% of returns)
Here:
$17,694
State:
$19,631
Here:
34.7% of AGI
State:
18.9% of AGI
(% of AGI for various income ranges: 7.8% for AGIs $10k-25k, 6.4% for AGIs $25k-50k, 13.7% for AGIs $50k-75k, 5.8% for AGIs over 100k)
Charity contributions deductions: $3,477 (7% of AGI, reported on 8.8% of returns)
Here:
$3,477
State:
$4,753
Here:
7.1% of AGI
State:
4.2% of AGI
(% of AGI for various income ranges: 1.5% for AGIs $10k-25k, 0.6% for AGIs $25k-50k, 1.8% for AGIs $50k-75k, 1.3% for AGIs $75k-100k)
Total tax: $3,211 (reported on 66.5% of returns)
75980:
$3,211
State:
$9,058
(% of AGI for various income ranges: 3.2% for AGIs below $10k, 3.0% for AGIs $10k-25k, 5.9% for AGIs $25k-50k, 8.0% for AGIs $50k-75k, 10.4% for AGIs $75k-100k, 13.0% for AGIs over 100k)
Earned income credit: $1,805 (reported on 26.4% of returns)
Here:
$1,805
State:
$2,024
Percentage of individuals using paid preparers for their 2004 taxes: 53.3%
Here:
53%
State:
57%
(% for various income ranges: 45.4% for AGIs below $10k, 53.8% for AGIs $10k-25k, 56.4% for AGIs $25k-50k, 51.8% for AGIs $50k-75k, 61.3% for AGIs $75k-100k, 85.7% for AGIs over 100k)
Household received Food Stamps/SNAP in the past 12 months: 315 Household did not receive Food Stamps/SNAP in the past 12 months: 783
Women who had a birth in the past 12 months: 7 (0 now married, 6 unmarried) Women who did not have a birth in the past 12 months: 504 (336 now married, 164 unmarried)
Housing units in zip code 75980 with a mortgage: 198 Median monthly owner costs for units with a mortgage: $1,236 Median monthly owner costs for units without a mortgage: $332
Residents with income below the poverty level in 2022:
This zip code:
25.5%
Whole state:
14.0%
Residents with income below 50% of the poverty level in 2022:
This zip code:
6.5%
Whole state:
7.4%
Median number of rooms in houses and condos:
Here:
4.5
State:
6.3
Median number of rooms in apartments:
Here:
4.0
State:
4.0
Notable locations in this zip code not listed on our city pages
Notable locations in zip code 75980: Caney Creek Recreation Site (A), Monterey Boat Ramp (B), Cassell Boykin Park Recreation Site (C), Monterey Park Campground (D), Bouton Lake Recreation Site (E), Monterey (F), Sandy Creek Recreation Site (G), Zavalla Forest Service Facility (H), Zavalla Volunteer Fire Department (I). Display/hide their locations on the map
Churches in zip code 75980 include: Sulphur Springs Church (A), Concord Church (B), Plum Ridge Church (C), Rockwall Church (D). Display/hide their locations on the map
Cemeteries: Cassels Cemetery (1), Poland Cemetery (2), McGilberry Cemetery (3), Dunkin Cemetery (4), Rockwall Cemetery (5), Barge Cemetery (6), Runnels Cemetery (7). Display/hide their locations on the map
Streams, rivers, and creeks: Julia Creek (A), Salt Branch (B), Dry Creek (C), Wilkes Branch (D), White Oak Branch (E), Turpentine Creek (F), Sulphur Spring Branch (G), Speir Branch (H), Shawnee Creek (I). Display/hide their locations on the map
Size of family households: 411 2-persons, 105 3-persons, 206 4-persons, 58 5-persons, 12 6-persons
Size of nonfamily households: 261 1-person, 29 2-persons, 3 3-persons
169 married couples with children.
340 single-parent households (86 men, 254 women).
98.5% of residents of 75980 zip code speak English at home.
0.4% of residents speak Spanish at home (44% very well, 56% not at all).
0.5% of residents speak other Indo-European language at home (42% very well, 58% well).
0.5% of residents speak Asian or Pacific Island language at home (100% very well).
Foreign born population: 33 (1.3%) (85.3% of them are naturalized citizens)
This zip code:
1.3%
Whole state:
17.2%
59%Malaysia
12%Honduras
37%American
20%English
13%Cajun
6%German
3%Irish
2%Italian
2%Scottish
Year of entry for the foreign-born population
62010 or later
182000 to 2009
01990 to 1999
15Before 1990
Housing units lacking complete plumbing facilities: 6.1% Housing units lacking complete kitchen facilities: 1.5%
74.0%Electricity
21.5%Bottled, tank, or LP gas
1.8%No fuel used
1.6%Utility gas
1.4%Wood
Population in 1990: 2,295. Population change in the 1990s: +253 (+11.0%).
Place of birth for U.S.-born residents:
This state: 1,969
Northeast: 30
Midwest: 236
South: 210
West: 83
58% of the 75980 zip code residents lived in the same house 5 years ago. Out of people who lived in different houses, 48% lived in this county. Out of people who lived in different counties, 50% lived in Texas.
91% of the 75980 zip code residents lived in the same house 1 year ago. Out of people who lived in different houses, 51% moved from this county. Out of people who lived in different houses, 44% moved from different county within same state. Out of people who lived in different houses, 4% moved from different state.
Private vs. public school enrollment:
Students in private schools in grades 1 to 8 (elementary and middle school):
Here:
0.0%
Texas:
8.8%
Students in private schools in grades 9 to 12 (high school):
Here:
0.0%
Texas:
8.0%
Students in private undergraduate colleges: 1
Here:
5.7%
Texas:
16.2%
Occupation by median earnings in the past 12 months ($)
110,375Management occupations
58,094Business and financial operations occupations
53,939Construction and extraction occupations
43,383Education, training, and library occupations
37,242Sales and related occupations
35,708Fire fighting and prevention, and other protective service workers including supervisors
Companies with federal contracts located in this zip code:
COBB, BRITTA (340 SPEIRS RD in ZAVALLA, TX; small business) : $26,138 in 6 contractsfrom 2003 to 2004
Contracts for Recreational Services by Army Signed by year:2000: $0; 2001: $0; 2002: $0; 2003: $7,588; 2004: $18,550; 2005: $0; 2006: $0.
Biggest contracts:
$18,550 with Army for Recreational Services. Signed on 2004-01-16. Completion date: 2003-12-30.
$3,670, same as above.Signed on 2003-11-20. Completion date: 2003-11-30.
$2,182, same as above.Signed on 2003-10-07. Completion date: 2003-10-30.
$2,034, same as above.Signed on 2003-12-29. Completion date: 2003-12-30.
Top industries in this zip code by the number of employees in 2005:
Accommodation and Food Services: Limited-Service Restaurants (10-19 employees: 1 establishment)
Other Services (except Public Administration): Religious Organizations (5-9: 2)
Accommodation and Food Services: Full-Service Restaurants (5-9: 2)
Health Care and Social Assistance: Other Residential Care Facilities (5-9: 1)
Administrative and Support and Waste Management and Remediation Services: Landscaping Services (1-4: 1)
Professional, Scientific, and Technical Services: Marketing Research and Public Opinion Polling (1-4: 1)
Fatal accident statistics in 2014:
Fatal accident count: 1
Vehicles involved in fatal accidents: 1
Fatal accidents caused by drunken drivers: 0
Fatalities: 1
Persons involved in fatal accidents: 1
Pedestrians involved in fatal accidents: 0
Fatal accident statistics in 2013:
Fatal accident count: 2
Vehicles involved in fatal accidents: 2
Fatal accidents caused by drunken drivers: 0
Fatalities: 2
Persons involved in fatal accidents: 7
Pedestrians involved in fatal accidents: 1
2002 - 2018 National Fire Incident Reporting System (NFIRS) incidents
Based on the data from the years 2002 - 2018 the average number of fires per year is 6. The highest number of fires - 24 took place in 2002, and the least - 1 in 2003. The data has a dropping trend.
When looking into fire subcategories, the most reports belonged to: Outside Fires (51.9%), and Structure Fires (26.0%).
Fire incident types reported to NFIRS in Zip Code 75980


 Nearest zip codes: 75949, 75944, 75938, 75929, 75936, 75901.


 : $26,138 in 6 contracts from 2003 to 2004


 Based on the data from the years 2002 - 2018 the average number of fires per year is 6. The highest number of fires - 24 took place in 2002, and the least - 1 in 2003. The data has a dropping trend.
 When looking into fire subcategories, the most reports belonged to: Outside Fires (51.9%), and Structure Fires (26.0%).