Estimated zip code population in 2022: 7,476 Zip code population in 2010: 7,071 Zip code population in 2000: 5,695
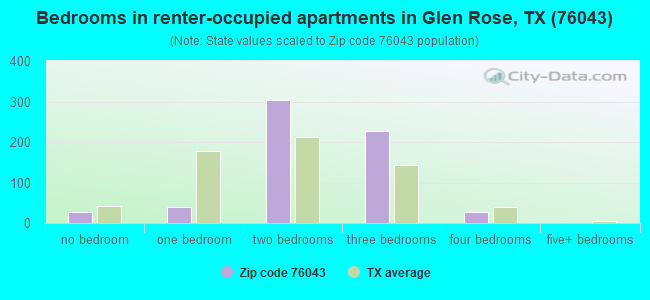
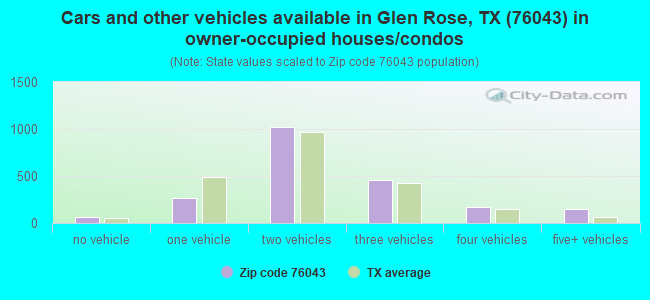
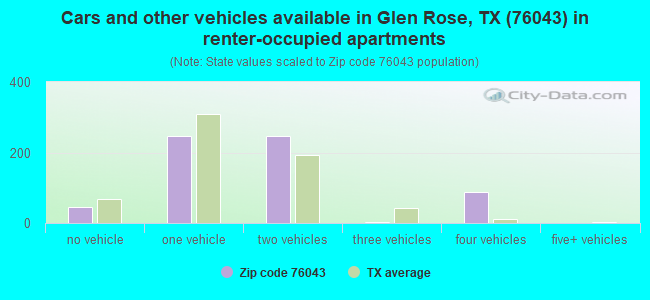
Houses and condos: 3,035 Renter-occupied apartments: 628
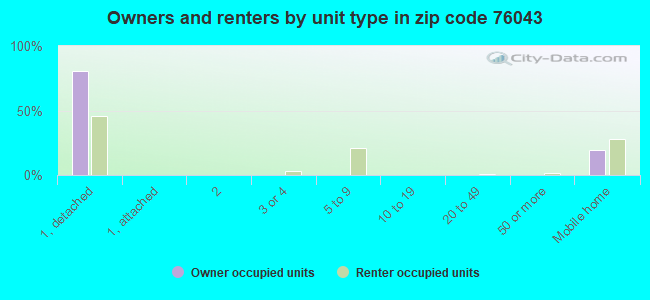
% of renters here:
23%
State:
38%
March 2022 cost of living index in zip code 76043: 80.1 (low, U.S. average is 100)
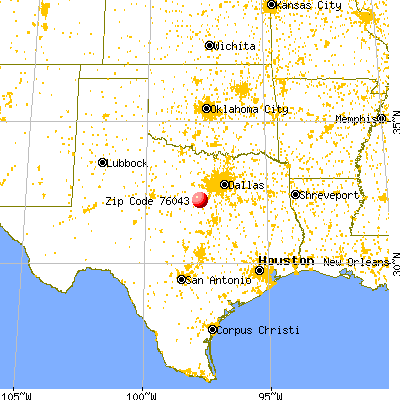
Land area: 137.3 sq. mi. Water area: 4.0 sq. mi.
Population density: 54 people per square mile
(very low).
OSM Map
General Map
Google Map
MSN Map
OSM Map
General Map
Google Map
MSN Map
OSM Map
General Map
Google Map
MSN Map
OSM Map
General Map
Google Map
MSN Map
Please wait while loading the map...
Real estate property taxes paid for housing units in 2022:
This zip code:
0.9% ($2,699)
Texas:
1.5% ($4,050)
Median real estate property taxes paid for housing units with mortgages in 2022: $3,524 (1.0%) Median real estate property taxes paid for housing units with no mortgage in 2022: $2,143 (0.9%)
Averages for the 2020 tax year for zip code 76043, filed in 2021:
Average Adjusted Gross Income (AGI) in 2020: $75,570 (Individual Income Tax Returns)
Here:
$75,570
State:
$77,054
Salary/wage: $60,567 (reported on 79.5% of returns)
Here:
$60,567
State:
$62,766
(% of AGI for various income ranges: 1220.5% for AGIs below $25k, 3351.9% for AGIs $25k-50k, 6268.3% for AGIs $50k-75k, 8718.0% for AGIs $75k-100k, 17646.7% for AGIs $100k-200k, 55663.3% for AGIs over 200k)
Taxable interest for individuals: $2,209 (reported on 26.2% of returns)
This zip code:
$2,209
Texas:
$2,665
(% of AGI for various income ranges: 15.2% for AGIs below $25k, 18.3% for AGIs $25k-50k, 93.4% for AGIs $50k-75k, 74.5% for AGIs $75k-100k, 153.9% for AGIs $100k-200k, 1241.7% for AGIs over 200k)
Ordinary dividends: $4,456 (reported on 17.6% of returns)
Here:
$4,456
State:
$10,044
(% of AGI for various income ranges: 16.9% for AGIs below $25k, 37.6% for AGIs $25k-50k, 60.0% for AGIs $50k-75k, 218.0% for AGIs $75k-100k, 160.6% for AGIs $100k-200k, 1815.0% for AGIs over 200k)
Net capital gain/loss in AGI: +$40,736 (reported on 18.2% of returns)
Here:
+$40,736
State:
+$39,590
(% of AGI for various income ranges: 3.2% for AGIs below $25k, 42.2% for AGIs $25k-50k, 96.2% for AGIs $50k-75k, 342.0% for AGIs $75k-100k, 513.1% for AGIs $100k-200k, 36275.0% for AGIs over 200k)
Profit/loss from business: +$12,684 (reported on 22.6% of returns)
Here:
+$12,684
State:
+$10,888
(% of AGI for various income ranges: 166.2% for AGIs below $25k, 106.6% for AGIs $25k-50k, 106.9% for AGIs $50k-75k, 359.0% for AGIs $75k-100k, 693.3% for AGIs $100k-200k, 7011.7% for AGIs over 200k)
Taxable individual retirement arrangement distribution: $28,197 (reported on 10.4% of returns)
76043:
$28,197
Texas:
$24,740
(% of AGI for various income ranges: 55.3% for AGIs below $25k, 133.7% for AGIs $25k-50k, 366.2% for AGIs $50k-75k, 644.5% for AGIs $75k-100k, 894.2% for AGIs $100k-200k, 5140.0% for AGIs over 200k)
Total itemized deductions: $54,625 (reported on 6.0% of returns)
Here:
$54,625
State:
$40,428
(% of AGI for various income ranges: 206.8% for AGIs $25k-50k, 366.0% for AGIs $75k-100k, 800.0% for AGIs $100k-200k, 10155.0% for AGIs over 200k)
Charity contributions: $21,394 (reported on 5.1% of returns)
Here:
$21,394
State:
$18,201
(% of AGI for various income ranges: 146.2% for AGIs $50k-75k, 240.3% for AGIs $100k-200k, 3913.3% for AGIs over 200k)
Taxes paid: $6,775 (reported on 6.0% of returns)
76043:
$6,775
State:
$7,821
(% of AGI for various income ranges: 28.6% for AGIs $25k-50k, 74.0% for AGIs $75k-100k, 136.7% for AGIs $100k-200k, 910.0% for AGIs over 200k)
Earned income credit: $2,423 (reported on 17.0% of returns)
Here:
$2,423
State:
$2,584
(% of AGI for various income ranges: 108.7% for AGIs below $25k, 92.2% for AGIs $25k-50k)
Percentage of individuals using paid preparers for their 2020 taxes: 92.0%
Here:
92%
State:
92%
(% for various income ranges: 89.6% for AGIs below $25k, 93.3% for AGIs $25k-50k, 92.9% for AGIs $50k-75k, 93.8% for AGIs $75k-100k, 91.9% for AGIs $100k-200k, 94.7% for AGIs over 200k)
Averages for the 2012 tax year for zip code 76043, filed in 2013:
Average Adjusted Gross Income (AGI) in 2012: $59,395 (Individual Income Tax Returns)
Here:
$59,395
State:
$65,384
Salary/wage: $49,625 (reported on 83.5% of returns)
Here:
$49,625
State:
$52,524
(% of AGI for various income ranges: 74.0% for AGIs below $25k, 77.5% for AGIs $25k-50k, 75.2% for AGIs $50k-75k, 77.1% for AGIs $75k-100k, 77.9% for AGIs $100k-200k, 41.0% for AGIs over 200k)
Taxable interest for individuals: $1,877 (reported on 27.1% of returns)
This zip code:
$1,877
Texas:
$2,372
(% of AGI for various income ranges: 1.6% for AGIs below $25k, 0.8% for AGIs $25k-50k, 0.8% for AGIs $50k-75k, 1.0% for AGIs $75k-100k, 0.6% for AGIs $100k-200k, 0.9% for AGIs over 200k)
Ordinary dividends: $3,234 (reported on 15.1% of returns)
Here:
$3,234
State:
$9,721
(% of AGI for various income ranges: 1.1% for AGIs below $25k, 0.9% for AGIs $25k-50k, 0.6% for AGIs $50k-75k, 1.2% for AGIs $75k-100k, 0.7% for AGIs $100k-200k, 0.7% for AGIs over 200k)
Net capital gain/loss in AGI: +$14,338 (reported on 14.4% of returns)
Here:
+$14,338
State:
+$35,319
(% of AGI for various income ranges: 0.5% for AGIs below $25k, 0.9% for AGIs $25k-50k, 0.8% for AGIs $50k-75k, 0.6% for AGIs $75k-100k, 1.2% for AGIs $100k-200k, 14.0% for AGIs over 200k)
Profit/loss from business: +$13,749 (reported on 20.3% of returns)
Here:
+$13,749
State:
+$13,732
(% of AGI for various income ranges: 9.8% for AGIs below $25k, 3.4% for AGIs $25k-50k, 2.7% for AGIs $50k-75k, 2.7% for AGIs $75k-100k, 5.5% for AGIs $100k-200k, 5.3% for AGIs over 200k)
Taxable individual retirement arrangement distribution: $19,393 (reported on 9.6% of returns)
76043:
$19,393
Texas:
$19,511
(% of AGI for various income ranges: 2.6% for AGIs below $25k, 2.4% for AGIs $25k-50k, 2.9% for AGIs $50k-75k, 4.1% for AGIs $75k-100k, 5.4% for AGIs $100k-200k)
Total itemized deductions: $22,944 (20% of AGI, reported on 24.4% of returns)
Here:
$22,944
State:
$24,724
Here:
19.6% of AGI
State:
15.9% of AGI
(% of AGI for various income ranges: 6.4% for AGIs below $25k, 8.9% for AGIs $25k-50k, 10.3% for AGIs $50k-75k, 9.6% for AGIs $75k-100k, 9.7% for AGIs $100k-200k, 9.9% for AGIs over 200k)
Charity contributions: $7,355 (reported on 18.2% of returns)
Here:
$7,355
State:
$6,808
(% of AGI for various income ranges: 0.5% for AGIs below $25k, 1.4% for AGIs $25k-50k, 1.5% for AGIs $50k-75k, 1.5% for AGIs $75k-100k, 2.0% for AGIs $100k-200k, 5.1% for AGIs over 200k)
Taxes paid: $5,109 (reported on 23.7% of returns)
76043:
$5,109
State:
$6,921
(% of AGI for various income ranges: 1.0% for AGIs below $25k, 1.4% for AGIs $25k-50k, 1.8% for AGIs $50k-75k, 1.6% for AGIs $75k-100k, 2.3% for AGIs $100k-200k, 2.9% for AGIs over 200k)
Earned income credit: $2,396 (reported on 17.5% of returns)
Here:
$2,396
State:
$2,570
(% of AGI for various income ranges: 6.8% for AGIs below $25k, 1.4% for AGIs $25k-50k)
Percentage of individuals using paid preparers for their 2012 taxes: 57.0%
Here:
57%
State:
51%
(% for various income ranges: 51.4% for AGIs below $25k, 54.4% for AGIs $25k-50k, 61.0% for AGIs $50k-75k, 60.7% for AGIs $75k-100k, 63.2% for AGIs $100k-200k, 88.9% for AGIs over 200k)
Averages for the 2004 tax year for zip code 76043, filed in 2005:
Average Adjusted Gross Income (AGI) in 2004: $46,047 (Individual Income Tax Returns)
Here:
$46,047
State:
$47,881
Salary/wage: $37,931 (reported on 83.2% of returns)
Here:
$37,931
State:
$41,947
(% of AGI for various income ranges: 215.9% for AGIs below $10k, 74.4% for AGIs $10k-25k, 76.3% for AGIs $25k-50k, 84.1% for AGIs $50k-75k, 85.1% for AGIs $75k-100k, 43.6% for AGIs over 100k)
Taxable interest for individuals: $2,363 (reported on 33.1% of returns)
This zip code:
$2,363
Texas:
$2,255
(% of AGI for various income ranges: 15.4% for AGIs below $10k, 2.8% for AGIs $10k-25k, 1.6% for AGIs $25k-50k, 1.1% for AGIs $50k-75k, 0.8% for AGIs $75k-100k, 1.8% for AGIs over 100k)
Taxable dividends: $1,772 (reported on 17.4% of returns)
Here:
$1,772
State:
$4,261
(% of AGI for various income ranges: 8.1% for AGIs below $10k, 0.8% for AGIs $10k-25k, 0.7% for AGIs $25k-50k, 0.4% for AGIs $50k-75k, 0.7% for AGIs $75k-100k, 0.5% for AGIs over 100k)
Net capital gain/loss: +$15,091 (reported on 18.0% of returns)
Here:
+$15,091
State:
+$16,110
(% of AGI for various income ranges: 6.4% for AGIs below $10k, 1.4% for AGIs $10k-25k, 2.5% for AGIs $25k-50k, 0.6% for AGIs $50k-75k, 1.2% for AGIs $75k-100k, 13.6% for AGIs over 100k)
Profit/loss from business: +$8,135 (reported on 19.7% of returns)
Here:
+$8,135
State:
+$11,013
(% of AGI for various income ranges: -19.0% for AGIs below $10k, 9.8% for AGIs $10k-25k, 5.9% for AGIs $25k-50k, 3.0% for AGIs $50k-75k, 2.3% for AGIs $75k-100k, 2.2% for AGIs over 100k)
IRA payment deduction: $3,705 (reported on 1.7% of returns)
76043:
$3,705
Texas:
$3,120
Total itemized deductions: $17,660 (20% of AGI, reported on 22.2% of returns)
Here:
$17,660
State:
$19,631
Here:
19.7% of AGI
State:
18.9% of AGI
(% of AGI for various income ranges: 15.4% for AGIs below $10k, 6.5% for AGIs $10k-25k, 8.5% for AGIs $25k-50k, 9.8% for AGIs $50k-75k, 10.8% for AGIs $75k-100k, 7.1% for AGIs over 100k)
Charity contributions deductions: $4,538 (5% of AGI, reported on 16.7% of returns)
Here:
$4,538
State:
$4,753
Here:
5.0% of AGI
State:
4.2% of AGI
(% of AGI for various income ranges: 1.4% for AGIs below $10k, 0.8% for AGIs $10k-25k, 0.9% for AGIs $25k-50k, 1.5% for AGIs $50k-75k, 2.0% for AGIs $75k-100k, 2.2% for AGIs over 100k)
Total tax: $7,500 (reported on 72.1% of returns)
76043:
$7,500
State:
$9,058
(% of AGI for various income ranges: 6.2% for AGIs below $10k, 4.1% for AGIs $10k-25k, 6.3% for AGIs $25k-50k, 8.7% for AGIs $50k-75k, 10.6% for AGIs $75k-100k, 18.5% for AGIs over 100k)
Earned income credit: $2,064 (reported on 19.2% of returns)
Here:
$2,064
State:
$2,024
Percentage of individuals using paid preparers for their 2004 taxes: 63.8%
Here:
64%
State:
57%
(% for various income ranges: 52.1% for AGIs below $10k, 70.4% for AGIs $10k-25k, 66.8% for AGIs $25k-50k, 65.1% for AGIs $50k-75k, 61.5% for AGIs $75k-100k, 70.7% for AGIs over 100k)
Likely homosexual households (counted as self-reported same-sex unmarried-partner households)
Lesbian couples: 0.3% of all households
Gay men: 0.0% of all households
Household received Food Stamps/SNAP in the past 12 months: 211 Household did not receive Food Stamps/SNAP in the past 12 months: 2,550
Women who had a birth in the past 12 months: 12 (0 now married, 11 unmarried) Women who did not have a birth in the past 12 months: 1,707 (838 now married, 865 unmarried)
Housing units in zip code 76043 with a mortgage: 1,002 (10 second mortgage, 11 both second mortgage and home equity loan) Median monthly owner costs for units with a mortgage: $1,932 Median monthly owner costs for units without a mortgage: $543
Residents with income below the poverty level in 2022:
This zip code:
4.2%
Whole state:
14.0%
Residents with income below 50% of the poverty level in 2022:
This zip code:
2.9%
Whole state:
7.4%
Median number of rooms in houses and condos:
Here:
6.2
State:
6.3
Median number of rooms in apartments:
Here:
4.7
State:
4.0
Notable locations in this zip code not listed on our city pages
Notable locations in zip code 76043: Cedar Brake (A), Glen Lake Camp (B), Fossil Rim Wildlife Center (C), Happy Hill Farm Academy Gymnasium (D), Glen Rose Fire Department (E), Somervell County Museum (F), Dinosaur Valley State Park (G), Somervell County Fire Rescue Emergency Medical Services (H), Commanche Peak Nuclear Power Plant Ambulance (I), LifeStar 5 - Southwest Helicopters - Glen Rose (J), Barnards Mill (K). Display/hide their locations on the map
Churches in zip code 76043 include: Rock Creek Church (A), White Church (B), Chalk Mountain Church (C), Cottonwood Church (D), Saint Rose of Lima Catholic Church (E), Oden Church (F). Display/hide their locations on the map
Cemeteries: Ward Branch Cemetery (1), Nancy Smith Cemetery (2), Squaw Creek Cemetery (3), Post Oak Cemetery (4), Lanham Mill Cemetery (5). Display/hide their locations on the map
Reservoirs: Twin Arena Lake (A), Lake Reed (B), Glen Lake (C), Arena Lake (D), Shipman Lake (E), Russell Lake (F), Drechsel Lake (G), Squaw Creek Reservoir (H). Display/hide their locations on the map
Streams, rivers, and creeks: White Bluff Creek (A), Van Zant Branch (B), Squaw Creek (C), Rough Creek (D), Prairie Creek (E), Panther Creek (F), Panther Branch (G), Montgomery Branch (H), Million Branch (I). Display/hide their locations on the map
Parks in zip code 76043 include: Dinosaur Valley State Park (1), Tiger Stadium (2), Happy Hill Farm Academy Football Field (3), Happy Hill Farm Academy Baseball Field (4). Display/hide their locations on the map
In group quarters: 177 (-1 institutionalized population)
Size of family households: 1,108 2-persons, 393 3-persons, 329 4-persons, 229 5-persons, 20 6-persons, 88 7-or-more-persons
Size of nonfamily households: 526 1-person, 67 2-persons
1,005 married couples with children.
338 single-parent households (209 men, 129 women).
80.5% of residents of 76043 zip code speak English at home.
18.3% of residents speak Spanish at home (58% very well, 31% well, 6% not well, 5% not at all).
0.5% of residents speak other Indo-European language at home (100% very well).
0.8% of residents speak Asian or Pacific Island language at home (100% very well).
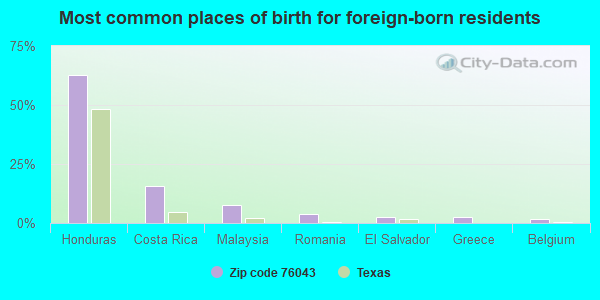
Foreign born population: 660 (8.8%) (27.7% of them are naturalized citizens)
This zip code:
8.8%
Whole state:
17.2%
63%Honduras
15%Costa Rica
8%Malaysia
4%Romania
3%El Salvador
3%Greece
1%Belgium
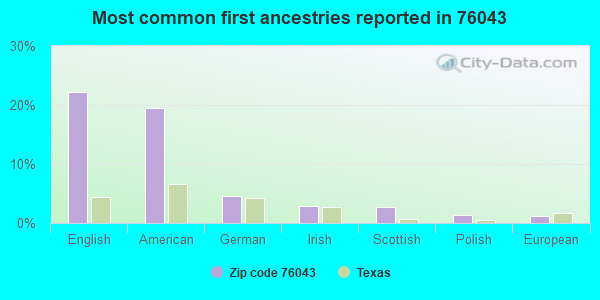
22%English
19%American
5%German
3%Irish
3%Scottish
1%Polish
1%European
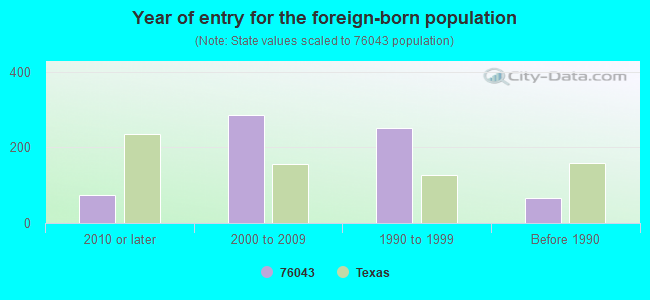
Year of entry for the foreign-born population
742010 or later
2862000 to 2009
2521990 to 1999
67Before 1990
Facilities with environmental interests located in this zip code:
ACE SCHOOL (1102 STADIUM DR in GLEN ROSE, TX)
(National Center for Education Statistics) - STATE ID-213901002 Organizations: GLEN ROSE ISD (SCHOOL DISTRICT)
Housing units lacking complete plumbing facilities: 2.0% Housing units lacking complete kitchen facilities: 0.7%
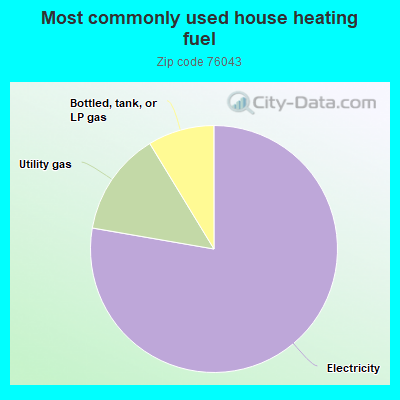
77.8%Electricity
13.6%Utility gas
8.7%Bottled, tank, or LP gas
Population in 1990: 4,432. Population change in the 1990s: +1,263 (+28.5%).
Place of birth for U.S.-born residents:
This state: 4,742
Northeast: 62
Midwest: 805
South: 561
West: 587
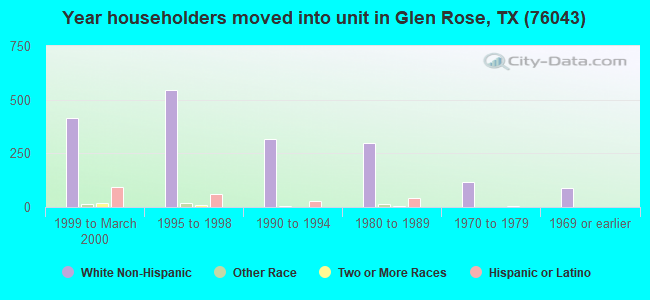
51% of the 76043 zip code residents lived in the same house 5 years ago. Out of people who lived in different houses, 35% lived in this county. Out of people who lived in different counties, 50% lived in Texas.
86% of the 76043 zip code residents lived in the same house 1 year ago. Out of people who lived in different houses, 42% moved from this county. Out of people who lived in different houses, 53% moved from different county within same state. Out of people who lived in different houses, 4% moved from different state.
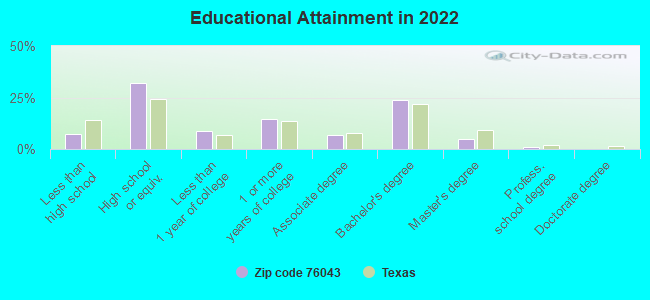
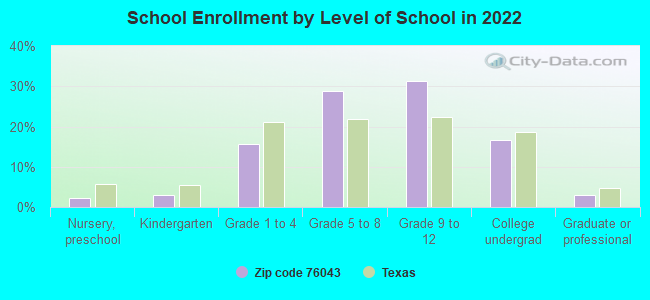
Private vs. public school enrollment:
Students in private schools in grades 1 to 8 (elementary and middle school): 61
Here:
8.2%
Texas:
8.8%
Students in private schools in grades 9 to 12 (high school): 77
Here:
14.7%
Texas:
8.0%
Students in private undergraduate colleges:
Here:
0.0%
Texas:
16.2%
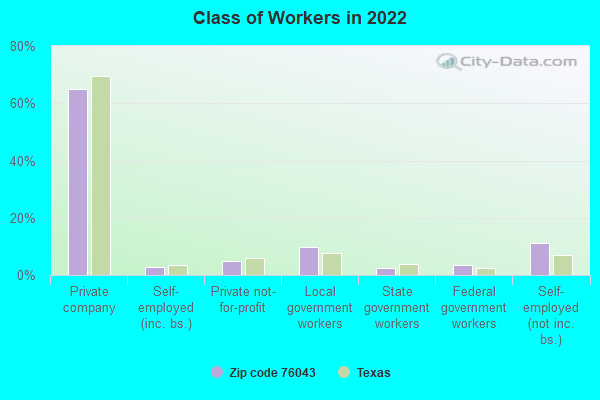
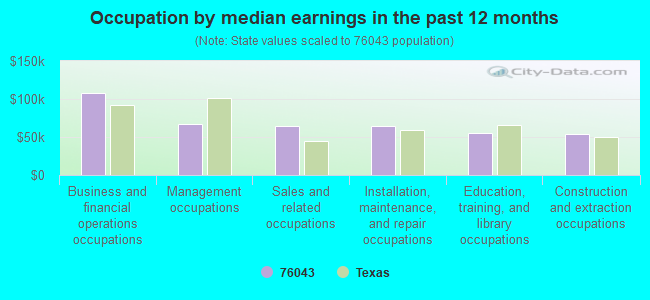
Occupation by median earnings in the past 12 months ($)
108,378Business and financial operations occupations
67,292Management occupations
64,465Sales and related occupations
63,928Installation, maintenance, and repair occupations
55,366Education, training, and library occupations
54,048Construction and extraction occupations
Companies with federal contracts located in this zip code:
POLLOCK WATER WELL DRILLING & (2910 HWY 67 N in GLEN ROSE, TX; small business)
$99,962 with U.S. Army Corps of Engineers - civil program financing only for Maintenance, Repair or Alteration of Real Property -- Unimproved Real Property (Land). Signed on 2001-08-14. Completion date: 2001-09-13.
Top industries in this zip code by the number of employees in 2005:
Utilities: Fossil Fuel Electric Power Generation (500-999 employees: 1 establishment, 1-4 employees: 2 establishments)
Administrative and Support and Waste Management and Remediation Services: Security Systems Services (except Locksmiths) (250-499: 1)
Health Care and Social Assistance: Nursing Care Facilities (100-249: 1, 50-99: 1)
Health Care and Social Assistance: Specialty (except Psychiatric and Substance Abuse) Hospitals (100-249: 1)
Health Care and Social Assistance: General Medical and Surgical Hospitals (100-249: 1)
Accommodation and Food Services: RV (Recreational Vehicle) Parks and Campgrounds (50-99: 1, 5-9: 1, 1-4: 2)
People in group quarters in 2010:
152 people in nursing facilities/skilled-nursing facilities
5 people in group homes for juveniles (non-correctional)
3 people in workers' group living quarters and job corps centers
People in group quarters in 2000:
81 people in orthopedic wards and institutions for the physically handicapped
55 people in nursing homes
15 people in local jails and other confinement facilities (including police lockups)
6 people in homes for the mentally retarded
Fatal accident statistics in 2014:
Fatal accident count: 2
Vehicles involved in fatal accidents: 3
Fatal accidents caused by drunken drivers: 1
Fatalities: 2
Persons involved in fatal accidents: 8
Pedestrians involved in fatal accidents: 0
Fatal accident statistics in 2013:
Fatal accident count: 2
Vehicles involved in fatal accidents: 3
Fatal accidents caused by drunken drivers: 0
Fatalities: 5
Persons involved in fatal accidents: 12
Pedestrians involved in fatal accidents: 0
2004 - 2018 National Fire Incident Reporting System (NFIRS) incidents
Based on the data from the years 2004 - 2018 the average number of fires per year is 19. The highest number of reported fires - 70 took place in 2018, and the least - 1 in 2010. The data has a rising trend.
When looking into fire subcategories, the most incidents belonged to: Outside Fires (65.6%), and Structure Fires (21.6%).
Fire incident types reported to NFIRS in Zip Code 76043


 Nearest zip codes: 76077, 76690, 76070, 76476, 76048, 76649.


 Based on the data from the years 2004 - 2018 the average number of fires per year is 19. The highest number of reported fires - 70 took place in 2018, and the least - 1 in 2010. The data has a rising trend.
 When looking into fire subcategories, the most incidents belonged to: Outside Fires (65.6%), and Structure Fires (21.6%).