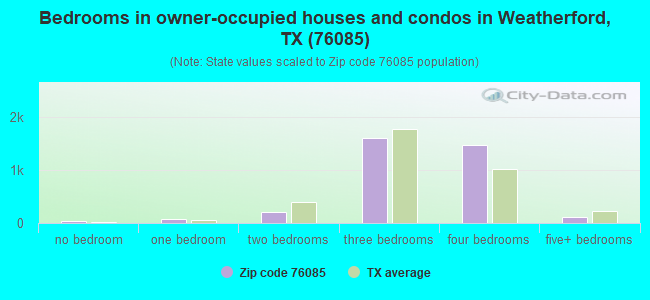
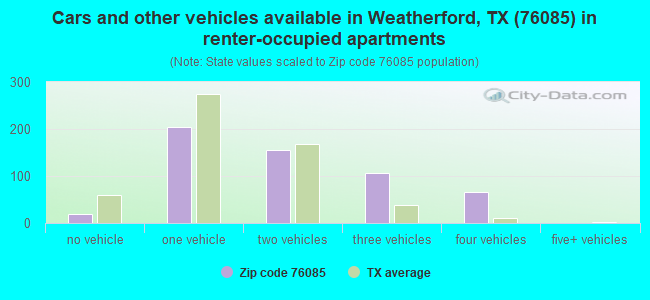
Houses and condos: 4,253 Renter-occupied apartments: 556
% of renters here:
14%
State:
38%
March 2022 cost of living index in zip code 76085: 87.7 (less than average, U.S. average is 100)
Land area: 63.8 sq. mi. Water area: 0.2 sq. mi.
Population density: 188 people per square mile
(very low).
OSM Map
Google Map
MSN Map
OSM Map
General Map
Google Map
MSN Map
OSM Map
Google Map
MSN Map
OSM Map
Google Map
MSN Map
Please wait while loading the map...
Real estate property taxes paid for housing units in 2022:
This zip code:
1.1% ($3,956)
Texas:
1.5% ($4,050)
Median real estate property taxes paid for housing units with mortgages in 2022: $4,567 (1.2%) Median real estate property taxes paid for housing units with no mortgage in 2022: $2,910 (0.8%)
Averages for the 2020 tax year for zip code 76085, filed in 2021:
Average Adjusted Gross Income (AGI) in 2020: $75,373 (Individual Income Tax Returns)
Here:
$75,373
State:
$77,054
Salary/wage: $67,200 (reported on 80.4% of returns)
Here:
$67,200
State:
$62,766
(% of AGI for various income ranges: 1088.7% for AGIs below $25k, 3420.6% for AGIs $25k-50k, 6438.9% for AGIs $50k-75k, 9213.3% for AGIs $75k-100k, 18066.3% for AGIs $100k-200k, 51751.7% for AGIs over 200k)
Taxable interest for individuals: $1,496 (reported on 27.0% of returns)
This zip code:
$1,496
Texas:
$2,665
(% of AGI for various income ranges: 17.0% for AGIs below $25k, 16.3% for AGIs $25k-50k, 63.4% for AGIs $50k-75k, 42.1% for AGIs $75k-100k, 97.6% for AGIs $100k-200k, 612.5% for AGIs over 200k)
Ordinary dividends: $4,029 (reported on 15.1% of returns)
Here:
$4,029
State:
$10,044
(% of AGI for various income ranges: 15.3% for AGIs below $25k, 27.0% for AGIs $25k-50k, 67.1% for AGIs $50k-75k, 88.1% for AGIs $75k-100k, 161.7% for AGIs $100k-200k, 963.3% for AGIs over 200k)
Net capital gain/loss in AGI: +$14,306 (reported on 14.9% of returns)
Here:
+$14,306
State:
+$39,590
(% of AGI for various income ranges: 5.3% for AGIs below $25k, 20.5% for AGIs $25k-50k, 57.1% for AGIs $50k-75k, 218.8% for AGIs $75k-100k, 400.4% for AGIs $100k-200k, 6640.8% for AGIs over 200k)
Profit/loss from business: +$12,136 (reported on 21.8% of returns)
Here:
+$12,136
State:
+$10,888
(% of AGI for various income ranges: 179.2% for AGIs below $25k, 181.3% for AGIs $25k-50k, 309.3% for AGIs $50k-75k, 337.7% for AGIs $75k-100k, 386.1% for AGIs $100k-200k, 4429.2% for AGIs over 200k)
Taxable individual retirement arrangement distribution: $22,162 (reported on 9.0% of returns)
76085:
$22,162
Texas:
$24,740
(% of AGI for various income ranges: 64.0% for AGIs below $25k, 103.0% for AGIs $25k-50k, 204.8% for AGIs $50k-75k, 377.9% for AGIs $75k-100k, 651.0% for AGIs $100k-200k, 1967.5% for AGIs over 200k)
Self-employed (Keogh) retirement plans: $18,600 (reported on 0.3% of returns)
76085:
$18,600
Texas:
$29,298
(% of AGI for various income ranges: 66.4% for AGIs $50k-75k)
Total itemized deductions: $33,673 (reported on 8.5% of returns)
Here:
$33,673
State:
$40,428
(% of AGI for various income ranges: 47.5% for AGIs below $25k, 138.3% for AGIs $25k-50k, 269.5% for AGIs $50k-75k, 462.3% for AGIs $75k-100k, 715.3% for AGIs $100k-200k, 5023.3% for AGIs over 200k)
Charity contributions: $11,397 (reported on 6.8% of returns)
Here:
$11,397
State:
$18,201
(% of AGI for various income ranges: 25.4% for AGIs $25k-50k, 83.8% for AGIs $50k-75k, 105.6% for AGIs $75k-100k, 171.4% for AGIs $100k-200k, 1727.5% for AGIs over 200k)
Taxes paid: $7,411 (reported on 8.0% of returns)
76085:
$7,411
State:
$7,821
(% of AGI for various income ranges: 7.6% for AGIs below $25k, 21.5% for AGIs $25k-50k, 61.6% for AGIs $50k-75k, 125.6% for AGIs $75k-100k, 183.7% for AGIs $100k-200k, 774.2% for AGIs over 200k)
Earned income credit: $2,345 (reported on 14.2% of returns)
Here:
$2,345
State:
$2,584
(% of AGI for various income ranges: 94.6% for AGIs below $25k, 70.2% for AGIs $25k-50k, 2.7% for AGIs $50k-75k)
Percentage of individuals using paid preparers for their 2020 taxes: 94.1%
Here:
94%
State:
92%
(% for various income ranges: 93.5% for AGIs below $25k, 94.3% for AGIs $25k-50k, 94.8% for AGIs $50k-75k, 95.2% for AGIs $75k-100k, 94.0% for AGIs $100k-200k, 93.3% for AGIs over 200k)
Averages for the 2012 tax year for zip code 76085, filed in 2013:
Average Adjusted Gross Income (AGI) in 2012: $59,571 (Individual Income Tax Returns)
Here:
$59,571
State:
$65,384
Salary/wage: $54,688 (reported on 84.3% of returns)
Here:
$54,688
State:
$52,524
(% of AGI for various income ranges: 74.5% for AGIs below $25k, 79.1% for AGIs $25k-50k, 78.5% for AGIs $50k-75k, 81.3% for AGIs $75k-100k, 82.2% for AGIs $100k-200k, 59.1% for AGIs over 200k)
Taxable interest for individuals: $1,085 (reported on 28.4% of returns)
This zip code:
$1,085
Texas:
$2,372
(% of AGI for various income ranges: 1.0% for AGIs below $25k, 0.8% for AGIs $25k-50k, 0.5% for AGIs $50k-75k, 0.3% for AGIs $75k-100k, 0.2% for AGIs $100k-200k, 1.1% for AGIs over 200k)
Ordinary dividends: $3,268 (reported on 13.5% of returns)
Here:
$3,268
State:
$9,721
(% of AGI for various income ranges: 0.8% for AGIs below $25k, 0.5% for AGIs $25k-50k, 0.6% for AGIs $50k-75k, 0.4% for AGIs $75k-100k, 0.5% for AGIs $100k-200k, 2.1% for AGIs over 200k)
Net capital gain/loss in AGI: +$2,926 (reported on 11.6% of returns)
Here:
+$2,926
State:
+$35,319
(% of AGI for various income ranges: 0.1% for AGIs $25k-50k, 0.4% for AGIs $100k-200k, 3.1% for AGIs over 200k)
Profit/loss from business: +$10,628 (reported on 21.4% of returns)
Here:
+$10,628
State:
+$13,732
(% of AGI for various income ranges: 10.0% for AGIs below $25k, 4.6% for AGIs $25k-50k, 4.0% for AGIs $50k-75k, 2.9% for AGIs $75k-100k, 3.0% for AGIs $100k-200k, 2.9% for AGIs over 200k)
Taxable individual retirement arrangement distribution: $18,695 (reported on 8.5% of returns)
76085:
$18,695
Texas:
$19,511
(% of AGI for various income ranges: 3.3% for AGIs below $25k, 1.8% for AGIs $25k-50k, 2.2% for AGIs $50k-75k, 2.6% for AGIs $75k-100k, 2.9% for AGIs $100k-200k, 3.1% for AGIs over 200k)
Total itemized deductions: $20,278 (20% of AGI, reported on 30.3% of returns)
Here:
$20,278
State:
$24,724
Here:
19.7% of AGI
State:
15.9% of AGI
(% of AGI for various income ranges: 8.4% for AGIs below $25k, 9.8% for AGIs $25k-50k, 10.4% for AGIs $50k-75k, 11.8% for AGIs $75k-100k, 10.8% for AGIs $100k-200k, 8.8% for AGIs over 200k)
Charity contributions: $4,561 (reported on 22.9% of returns)
Here:
$4,561
State:
$6,808
(% of AGI for various income ranges: 0.6% for AGIs below $25k, 0.8% for AGIs $25k-50k, 1.6% for AGIs $50k-75k, 1.6% for AGIs $75k-100k, 2.0% for AGIs $100k-200k, 2.9% for AGIs over 200k)
Taxes paid: $5,503 (reported on 29.7% of returns)
76085:
$5,503
State:
$6,921
(% of AGI for various income ranges: 1.6% for AGIs below $25k, 2.2% for AGIs $25k-50k, 2.5% for AGIs $50k-75k, 3.2% for AGIs $75k-100k, 3.2% for AGIs $100k-200k, 2.5% for AGIs over 200k)
Earned income credit: $2,328 (reported on 16.2% of returns)
Here:
$2,328
State:
$2,570
(% of AGI for various income ranges: 6.5% for AGIs below $25k, 1.3% for AGIs $25k-50k)
Percentage of individuals using paid preparers for their 2012 taxes: 52.6%
Here:
53%
State:
51%
(% for various income ranges: 48.1% for AGIs below $25k, 50.5% for AGIs $25k-50k, 56.7% for AGIs $50k-75k, 53.7% for AGIs $75k-100k, 58.6% for AGIs $100k-200k, 66.7% for AGIs over 200k)
Averages for the 2004 tax year for zip code 76085, filed in 2005:
Average Adjusted Gross Income (AGI) in 2004: $43,896 (Individual Income Tax Returns)
Here:
$43,896
State:
$47,881
Salary/wage: $42,027 (reported on 86.2% of returns)
Here:
$42,027
State:
$41,947
(% of AGI for various income ranges: 123.2% for AGIs below $10k, 75.3% for AGIs $10k-25k, 84.2% for AGIs $25k-50k, 85.2% for AGIs $50k-75k, 86.2% for AGIs $75k-100k, 76.6% for AGIs over 100k)
Taxable interest for individuals: $1,116 (reported on 33.3% of returns)
This zip code:
$1,116
Texas:
$2,255
(% of AGI for various income ranges: 2.2% for AGIs below $10k, 2.2% for AGIs $10k-25k, 0.7% for AGIs $25k-50k, 0.5% for AGIs $50k-75k, 0.5% for AGIs $75k-100k, 1.0% for AGIs over 100k)
Taxable dividends: $1,148 (reported on 14.9% of returns)
Here:
$1,148
State:
$4,261
(% of AGI for various income ranges: 1.5% for AGIs below $10k, 0.7% for AGIs $10k-25k, 0.3% for AGIs $25k-50k, 0.3% for AGIs $50k-75k, 0.3% for AGIs $75k-100k, 0.4% for AGIs over 100k)
Net capital gain/loss: +$3,100 (reported on 13.7% of returns)
Here:
+$3,100
State:
+$16,110
(% of AGI for various income ranges: -1.5% for AGIs below $10k, -0.2% for AGIs $10k-25k, 0.1% for AGIs $25k-50k, 0.6% for AGIs $50k-75k, 1.3% for AGIs $75k-100k, 2.2% for AGIs over 100k)
Profit/loss from business: +$8,798 (reported on 22.0% of returns)
Here:
+$8,798
State:
+$11,013
(% of AGI for various income ranges: 21.5% for AGIs below $10k, 10.9% for AGIs $10k-25k, 4.8% for AGIs $25k-50k, 4.1% for AGIs $50k-75k, 2.8% for AGIs $75k-100k, 2.6% for AGIs over 100k)
IRA payment deduction: $3,278 (reported on 2.2% of returns)
76085:
$3,278
Texas:
$3,120
Total itemized deductions: $17,376 (23% of AGI, reported on 30.6% of returns)
Here:
$17,376
State:
$19,631
Here:
22.8% of AGI
State:
18.9% of AGI
(% of AGI for various income ranges: 15.2% for AGIs below $10k, 9.1% for AGIs $10k-25k, 12.5% for AGIs $25k-50k, 11.9% for AGIs $50k-75k, 13.5% for AGIs $75k-100k, 11.9% for AGIs over 100k)
Charity contributions deductions: $3,110 (4% of AGI, reported on 23.7% of returns)
Here:
$3,110
State:
$4,753
Here:
3.8% of AGI
State:
4.2% of AGI
(% of AGI for various income ranges: 0.6% for AGIs below $10k, 0.7% for AGIs $10k-25k, 1.2% for AGIs $25k-50k, 1.7% for AGIs $50k-75k, 1.8% for AGIs $75k-100k, 2.3% for AGIs over 100k)
Total tax: $6,042 (reported on 75.7% of returns)
76085:
$6,042
State:
$9,058
(% of AGI for various income ranges: 4.3% for AGIs below $10k, 4.7% for AGIs $10k-25k, 6.4% for AGIs $25k-50k, 8.7% for AGIs $50k-75k, 10.7% for AGIs $75k-100k, 16.7% for AGIs over 100k)
Earned income credit: $1,876 (reported on 17.0% of returns)
Here:
$1,876
State:
$2,024
Percentage of individuals using paid preparers for their 2004 taxes: 56.3%
Here:
56%
State:
57%
(% for various income ranges: 46.4% for AGIs below $10k, 60.4% for AGIs $10k-25k, 59.7% for AGIs $25k-50k, 56.9% for AGIs $50k-75k, 54.9% for AGIs $75k-100k, 59.6% for AGIs over 100k)
Likely homosexual households (counted as self-reported same-sex unmarried-partner households)
Lesbian couples: 0.1% of all households
Gay men: 0.0% of all households
Household received Food Stamps/SNAP in the past 12 months: 250 Household did not receive Food Stamps/SNAP in the past 12 months: 3,790
Women who had a birth in the past 12 months: 109 (48 now married, 59 unmarried) Women who did not have a birth in the past 12 months: 2,322 (1,514 now married, 793 unmarried)
Housing units in zip code 76085 with a mortgage: 2,104 (131 second mortgage, 54 home equity loan, 78 both second mortgage and home equity loan) Houses without a mortgage: 60
Median monthly owner costs for units with a mortgage: $2,013 Median monthly owner costs for units without a mortgage: $677
Residents with income below the poverty level in 2022:
This zip code:
9.1%
Whole state:
14.0%
Residents with income below 50% of the poverty level in 2022:
This zip code:
3.5%
Whole state:
7.4%
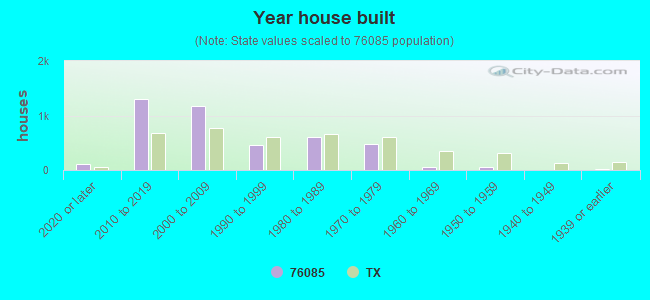
Median number of rooms in houses and condos:
Here:
6.4
State:
6.3
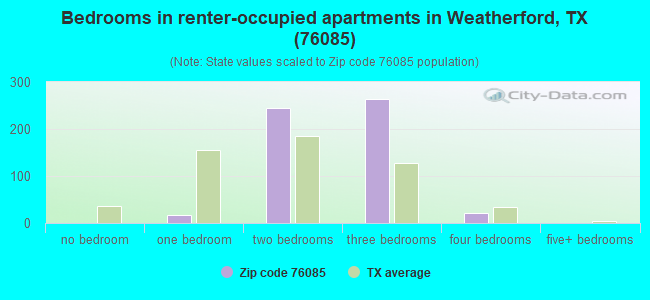
Median number of rooms in apartments:
Here:
4.8
State:
4.0
Notable locations in this zip code not listed on our city pages
Cemeteries: Wampler Cemetery (1), Bethel Cemetery (2), Bud Clark Cemetery (3), Clark Cemetery (4), Wright Cemetery (5). Display/hide their locations on the map
Reservoirs: Reservoir Number Twentyeight (A), Reservoir Number Twentyseven (B), Reservoir Number Twentytwo A (C), Reservoir Number Twentyone (D), Reservoir Number Nineteen (E), Reservoir Number Eighteen (F), Reservoir Number Seventeen (G), Soil Conservation Service Site 22a Reservoir (H). Display/hide their locations on the map
Streams, rivers, and creeks: Rankin Branch (A), Patton Branch (B), Mill Branch (C), McKnight Branch (D), Green Branch (E), Indian Creek (F), Holder Branch (G), Dobbs Branch (H), Brown Branch (I). Display/hide their locations on the map
Size of family households: 1,461 2-persons, 844 3-persons, 845 4-persons, 141 5-persons, 57 6-persons, 102 7-or-more-persons
Size of nonfamily households: 506 1-person, 69 2-persons
1,971 married couples with children.
107 single-parent households (62 men, 45 women).
94.3% of residents of 76085 zip code speak English at home.
4.9% of residents speak Spanish at home (69% very well, 18% well, 14% not well).
0.8% of residents speak Asian or Pacific Island language at home (64% very well, 36% well).
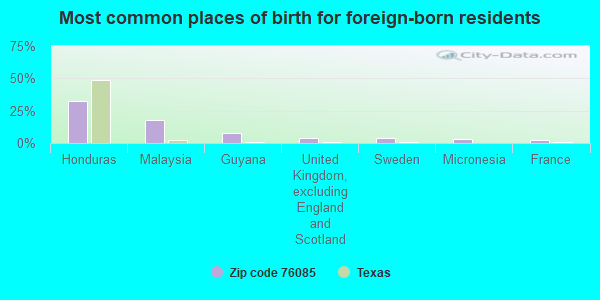
Foreign born population: 297 (2.5%) (78.6% of them are naturalized citizens)
This zip code:
2.5%
Whole state:
17.2%
33%Honduras
17%Malaysia
8%Guyana
4%United Kingdom, excluding England and Scotland
4%Sweden
3%Micronesia
2%France
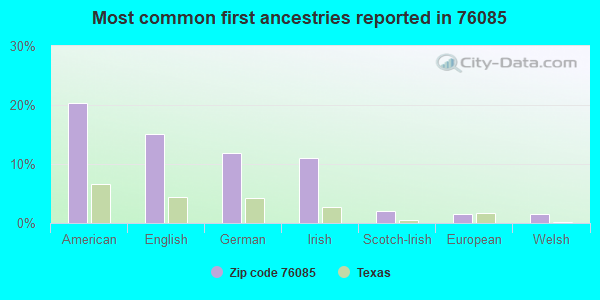
20%American
15%English
12%German
11%Irish
2%Scotch-Irish
2%European
1%Welsh
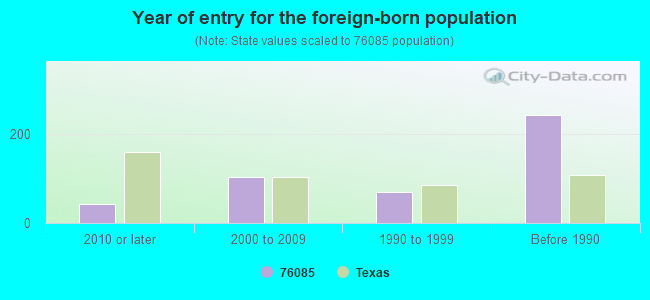
Year of entry for the foreign-born population
422010 or later
1022000 to 2009
691990 to 1999
242Before 1990
Housing units lacking complete plumbing facilities: 1.9% Housing units lacking complete kitchen facilities: 1.9%
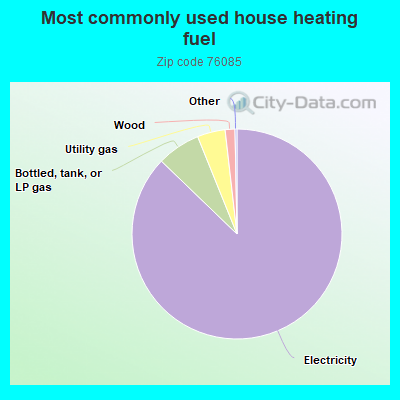
87.3%Electricity
6.7%Bottled, tank, or LP gas
4.3%Utility gas
1.5%Wood
Place of birth for U.S.-born residents:
This state: 8,113
Northeast: 338
Midwest: 1,019
South: 945
West: 1,092
89% of the 76085 zip code residents lived in the same house 1 year ago. Out of people who lived in different houses, 50% moved from this county. Out of people who lived in different houses, 39% moved from different county within same state. Out of people who lived in different houses, 9% moved from different state. Out of people who lived in different houses, 2% moved from abroad.
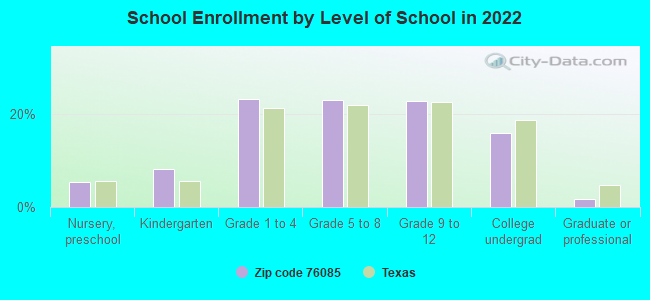
Private vs. public school enrollment:
Students in private schools in grades 1 to 8 (elementary and middle school): 259
Here:
22.7%
Texas:
8.8%
Students in private schools in grades 9 to 12 (high school): 192
Here:
33.8%
Texas:
8.0%
Students in private undergraduate colleges: 34
Here:
8.8%
Texas:
16.2%
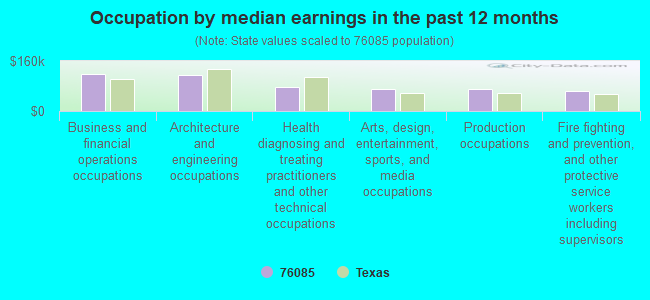
Occupation by median earnings in the past 12 months ($)
118,613Business and financial operations occupations
114,210Architecture and engineering occupations
77,816Health diagnosing and treating practitioners and other technical occupations
71,064Arts, design, entertainment, sports, and media occupations
70,100Production occupations
63,943Fire fighting and prevention, and other protective service workers including supervisors
Companies with federal contracts located in this zip code:
AMAZON SYSTEMS, INC (555 EMBERS LANE in WEATHERFORD, TX; small business)
$22,280 with Army for Preservative and Sealing Compounds. Signed on 2006-03-14. Completion date: 2006-06-30.
Top industries in this zip code by the number of employees in 2005:
Real Estate and Rental and Leasing: Passenger Car Rental (20-49: 1)
Professional, Scientific, and Technical Services: Other Accounting Services (10-19: 1)
Construction: New Single-Family Housing Construction (except Operative Builders) (1-4: 7)
Construction: All Other Specialty Trade Contractors (5-9: 1, 1-4: 1)
Other Services (except Public Administration): Business Associations (5-9: 1)
Construction: Drywall and Insulation Contractors (5-9: 1)
Fatal accident statistics in 2014:
Fatal accident count: 1
Vehicles involved in fatal accidents: 1
Fatal accidents caused by drunken drivers: 0
Fatalities: 1
Persons involved in fatal accidents: 1
Pedestrians involved in fatal accidents: 0
Fatal accident statistics in 2012:
Fatal accident count: 1
Vehicles involved in fatal accidents: 2
Fatal accidents caused by drunken drivers: 0
Fatalities: 1
Persons involved in fatal accidents: 4
Pedestrians involved in fatal accidents: 0
2002 - 2018 National Fire Incident Reporting System (NFIRS) incidents
Based on the data from the years 2002 - 2018 the average number of fires per year is 36. The highest number of fire incidents - 105 took place in 2018, and the least - 10 in 2002. The data has a growing trend.
When looking into fire subcategories, the most incidents belonged to: Outside Fires (65.2%), and Structure Fires (25.8%).
Fire incident types reported to NFIRS in Zip Code 76085


 Based on the data from the years 2002 - 2018 the average number of fires per year is 36. The highest number of fire incidents - 105 took place in 2018, and the least - 10 in 2002. The data has a growing trend.
 When looking into fire subcategories, the most incidents belonged to: Outside Fires (65.2%), and Structure Fires (25.8%).