Estimated zip code population in 2022: 3,578 Zip code population in 2010: 2,095 Zip code population in 2000: 1,743
Houses and condos: 1,383 Renter-occupied apartments: 301
% of renters here:
22%
State:
38%
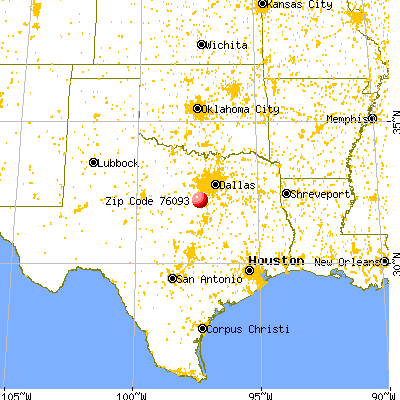
March 2022 cost of living index in zip code 76093: 84.2 (less than average, U.S. average is 100)
Land area: 37.0 sq. mi. Water area: 0.3 sq. mi.
Population density: 97 people per square mile
(very low).
OSM Map
General Map
Google Map
MSN Map
OSM Map
General Map
Google Map
MSN Map
OSM Map
General Map
Google Map
MSN Map
OSM Map
General Map
Google Map
MSN Map
Please wait while loading the map...
Real estate property taxes paid for housing units in 2022:
This zip code:
2.6% ($3,180)
Texas:
1.5% ($4,050)
Median real estate property taxes paid for housing units with mortgages in 2022: $3,552 (2.2%) Median real estate property taxes paid for housing units with no mortgage in 2022: $2,220 (1.9%)
Business Search- 14 Million verified businesses
Males: 1,992
(55.7%)
Females: 1,586
(44.3%)
For population 25 years and over in 76093:
High school or higher: 76.9%
Bachelor's degree or higher: 13.6%
Graduate or professional degree: 4.9%
Unemployed: 11.7%
Mean travel time to work (commute): 44.2 minutes
For population 15 years and over in 76093:
Never married: 32.0%
Now married: 51.3%
Separated: 1.3%
Widowed: 3.1%
Divorced: 12.2%
Zip code 76093 compared to state average:
Median house value below state average.
Unemployed percentage above state average.
Black race population percentage significantly below state average.
Hispanic race population percentage below state average.
Median age above state average.
Foreign-born population percentage significantly below state average.
Renting percentage below state average.
Length of stay since moving in significantly above state average.
Number of college students significantly below state average.
Percentage of population with a bachelor's degree or higher significantly below state average.
Averages for the 2020 tax year for zip code 76093, filed in 2021:
Average Adjusted Gross Income (AGI) in 2020: $59,666 (Individual Income Tax Returns)
Here:
$59,666
State:
$77,054
Salary/wage: $54,662 (reported on 81.8% of returns)
Here:
$54,662
State:
$62,766
(% of AGI for various income ranges: 1079.7% for AGIs below $25k, 3667.9% for AGIs $25k-50k, 6312.0% for AGIs $50k-75k, 9088.0% for AGIs $75k-100k, 14817.5% for AGIs $100k-200k)
Taxable interest for individuals: $881 (reported on 17.4% of returns)
This zip code:
$881
Texas:
$2,665
(% of AGI for various income ranges: 13.4% for AGIs below $25k, 7.1% for AGIs $25k-50k, 8.0% for AGIs $50k-75k, 10.0% for AGIs $75k-100k, 48.3% for AGIs $100k-200k)
Ordinary dividends: $2,080 (reported on 8.3% of returns)
Here:
$2,080
State:
$10,044
(% of AGI for various income ranges: 8.3% for AGIs below $25k, 50.0% for AGIs $50k-75k, 90.8% for AGIs $100k-200k)
Net capital gain/loss in AGI: +$40,380 (reported on 8.3% of returns)
Here:
+$40,380
State:
+$39,590
(% of AGI for various income ranges: 33.8% for AGIs below $25k, 65.3% for AGIs $50k-75k, 3201.7% for AGIs $100k-200k)
Profit/loss from business: +$10,505 (reported on 18.2% of returns)
Here:
+$10,505
State:
+$10,888
(% of AGI for various income ranges: 183.1% for AGIs below $25k, 182.5% for AGIs $25k-50k, 145.3% for AGIs $50k-75k, 81.0% for AGIs $75k-100k, 869.2% for AGIs $100k-200k)
Taxable individual retirement arrangement distribution: $14,933 (reported on 5.0% of returns)
76093:
$14,933
Texas:
$24,740
(% of AGI for various income ranges: 220.4% for AGIs $25k-50k, 367.0% for AGIs $75k-100k)
Total itemized deductions: $30,580 (reported on 4.1% of returns)
Here:
$30,580
State:
$40,428
(% of AGI for various income ranges: 1529.0% for AGIs $75k-100k)
Charity contributions: $18,200 (reported on 2.5% of returns)
Here:
$18,200
State:
$18,201
(% of AGI for various income ranges: 546.0% for AGIs $75k-100k)
Taxes paid: $5,100 (reported on 4.1% of returns)
76093:
$5,100
State:
$7,821
(% of AGI for various income ranges: 255.0% for AGIs $75k-100k)
Earned income credit: $2,475 (reported on 19.8% of returns)
Here:
$2,475
State:
$2,584
(% of AGI for various income ranges: 126.9% for AGIs below $25k, 94.2% for AGIs $25k-50k)
Percentage of individuals using paid preparers for their 2020 taxes: 93.4%
Here:
93%
State:
92%
(% for various income ranges: 92.1% for AGIs below $25k, 96.7% for AGIs $25k-50k, 94.7% for AGIs $50k-75k, 92.3% for AGIs $75k-100k, 94.1% for AGIs $100k-200k, 75.0% for AGIs over 200k)
Averages for the 2012 tax year for zip code 76093, filed in 2013:
Average Adjusted Gross Income (AGI) in 2012: $46,403 (Individual Income Tax Returns)
Here:
$46,403
State:
$65,384
Salary/wage: $42,876 (reported on 87.8% of returns)
Here:
$42,876
State:
$52,524
(% of AGI for various income ranges: 76.3% for AGIs below $25k, 82.4% for AGIs $25k-50k, 86.1% for AGIs $50k-75k, 89.8% for AGIs $75k-100k, 72.7% for AGIs $100k-200k)
Taxable interest for individuals: $865 (reported on 17.3% of returns)
This zip code:
$865
Texas:
$2,372
(% of AGI for various income ranges: 0.3% for AGIs below $25k, 0.6% for AGIs $25k-50k, 0.1% for AGIs $50k-75k, 0.4% for AGIs $100k-200k)
Ordinary dividends: $3,143 (reported on 7.1% of returns)
Here:
$3,143
State:
$9,721
(% of AGI for various income ranges: 1.9% for AGIs below $25k, 0.3% for AGIs $50k-75k, 0.8% for AGIs $100k-200k)
Net capital gain/loss in AGI: +$4,433 (reported on 6.1% of returns)
Here:
+$4,433
State:
+$35,319
(% of AGI for various income ranges: 2.2% for AGIs $100k-200k)
Profit/loss from business: +$7,647 (reported on 17.3% of returns)
Here:
+$7,647
State:
+$13,732
(% of AGI for various income ranges: 13.3% for AGIs below $25k, 2.9% for AGIs $25k-50k, 2.4% for AGIs $50k-75k, 2.3% for AGIs $75k-100k)
Taxable individual retirement arrangement distribution: $9,180 (reported on 5.1% of returns)
76093:
$9,180
Texas:
$19,511
Total itemized deductions: $22,495 (27% of AGI, reported on 19.4% of returns)
Here:
$22,495
State:
$24,724
Here:
27.4% of AGI
State:
15.9% of AGI
(% of AGI for various income ranges: 9.7% for AGIs $25k-50k, 7.3% for AGIs $50k-75k, 12.6% for AGIs $75k-100k, 12.1% for AGIs $100k-200k)
Charity contributions: $5,169 (reported on 13.3% of returns)
Here:
$5,169
State:
$6,808
(% of AGI for various income ranges: 1.0% for AGIs $25k-50k, 1.0% for AGIs $50k-75k, 1.3% for AGIs $75k-100k, 2.9% for AGIs $100k-200k)
Taxes paid: $4,217 (reported on 18.4% of returns)
76093:
$4,217
State:
$6,921
(% of AGI for various income ranges: 1.4% for AGIs $25k-50k, 1.5% for AGIs $50k-75k, 2.3% for AGIs $75k-100k, 2.2% for AGIs $100k-200k)
Earned income credit: $2,224 (reported on 21.4% of returns)
Here:
$2,224
State:
$2,570
(% of AGI for various income ranges: 7.4% for AGIs below $25k, 1.4% for AGIs $25k-50k)
Percentage of individuals using paid preparers for their 2012 taxes: 54.1%
Here:
54%
State:
51%
(% for various income ranges: 48.6% for AGIs below $25k, 53.8% for AGIs $25k-50k, 58.8% for AGIs $50k-75k, 55.6% for AGIs $75k-100k, 66.7% for AGIs $100k-200k)
Averages for the 2004 tax year for zip code 76093, filed in 2005:
Average Adjusted Gross Income (AGI) in 2004: $39,878 (Individual Income Tax Returns)
Here:
$39,878
State:
$47,881
Salary/wage: $34,101 (reported on 86.6% of returns)
Here:
$34,101
State:
$41,947
(% of AGI for various income ranges: 147.5% for AGIs below $10k, 81.4% for AGIs $10k-25k, 86.5% for AGIs $25k-50k, 85.4% for AGIs $50k-75k, 86.0% for AGIs $75k-100k, 34.2% for AGIs over 100k)
Taxable interest for individuals: $1,180 (reported on 24.3% of returns)
This zip code:
$1,180
Texas:
$2,255
(% of AGI for various income ranges: 3.2% for AGIs below $10k, 0.7% for AGIs $10k-25k, 0.5% for AGIs $25k-50k, 0.5% for AGIs $50k-75k, 0.1% for AGIs $75k-100k, 1.5% for AGIs over 100k)
Taxable dividends: $597 (reported on 8.9% of returns)
Here:
$597
State:
$4,261
(% of AGI for various income ranges: 0.2% for AGIs $10k-25k, 0.1% for AGIs $25k-50k, 0.2% for AGIs $50k-75k, 0.1% for AGIs over 100k)
Net capital gain/loss: +$7,935 (reported on 8.9% of returns)
Here:
+$7,935
State:
+$16,110
(% of AGI for various income ranges: 0.4% for AGIs $10k-25k, 0.7% for AGIs $25k-50k, 1.9% for AGIs $50k-75k, 4.6% for AGIs over 100k)
Profit/loss from business: +$5,521 (reported on 19.2% of returns)
Here:
+$5,521
State:
+$11,013
(% of AGI for various income ranges: 12.8% for AGIs below $10k, 6.4% for AGIs $10k-25k, 1.1% for AGIs $25k-50k, 2.7% for AGIs $50k-75k, 5.5% for AGIs $75k-100k)
Total itemized deductions: $15,597 (17% of AGI, reported on 14.3% of returns)
Here:
$15,597
State:
$19,631
Here:
17.4% of AGI
State:
18.9% of AGI
(% of AGI for various income ranges: 3.4% for AGIs $10k-25k, 5.4% for AGIs $25k-50k, 5.5% for AGIs $50k-75k, 9.2% for AGIs $75k-100k, 5.1% for AGIs over 100k)
Charity contributions deductions: $4,081 (4% of AGI, reported on 11.4% of returns)
Here:
$4,081
State:
$4,753
Here:
4.5% of AGI
State:
4.2% of AGI
(% of AGI for various income ranges: 4.0% for AGIs below $10k, 0.6% for AGIs $25k-50k, 0.8% for AGIs $50k-75k, 1.9% for AGIs $75k-100k, 2.1% for AGIs over 100k)
Total tax: $5,699 (reported on 70.9% of returns)
76093:
$5,699
State:
$9,058
(% of AGI for various income ranges: 2.8% for AGIs below $10k, 3.9% for AGIs $10k-25k, 5.5% for AGIs $25k-50k, 8.7% for AGIs $50k-75k, 10.9% for AGIs $75k-100k, 19.7% for AGIs over 100k)
Earned income credit: $1,972 (reported on 20.2% of returns)
Here:
$1,972
State:
$2,024
Percentage of individuals using paid preparers for their 2004 taxes: 58.9%
Here:
59%
State:
57%
(% for various income ranges: 47.0% for AGIs below $10k, 61.6% for AGIs $10k-25k, 60.9% for AGIs $25k-50k, 62.7% for AGIs $50k-75k, 57.9% for AGIs $75k-100k, 71.0% for AGIs over 100k)
Household received Food Stamps/SNAP in the past 12 months: 58 Household did not receive Food Stamps/SNAP in the past 12 months: 1,277
Women who had a birth in the past 12 months: 18 (10 now married, 7 unmarried) Women who did not have a birth in the past 12 months: 748 (501 now married, 241 unmarried)
Housing units in zip code 76093 with a mortgage: 607 (25 second mortgage, 10 both second mortgage and home equity loan) Median monthly owner costs for units with a mortgage: $1,535 Median monthly owner costs for units without a mortgage: $437
Residents with income below the poverty level in 2022:
This zip code:
10.4%
Whole state:
14.0%
Residents with income below 50% of the poverty level in 2022:
This zip code:
4.0%
Whole state:
7.4%
Median number of rooms in houses and condos:
Here:
5.5
State:
6.3
Median number of rooms in apartments:
Here:
4.9
State:
4.0
Notable locations in this zip code not listed on our city pages
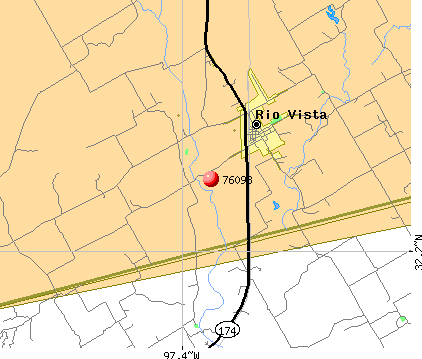
Notable locations in zip code 76093: Fishermans Paradise (A), Meredith Hart House (B), Rio Vista Volunteer Fire Department (C). Display/hide their locations on the map
Size of family households: 339 2-persons, 87 3-persons, 496 4-persons, 50 5-persons, 13 6-persons, 11 7-or-more-persons
Size of nonfamily households: 295 1-person, 29 2-persons, 3 4-persons
635 married couples with children.
176 single-parent households (79 men, 97 women).
86.9% of residents of 76093 zip code speak English at home.
12.6% of residents speak Spanish at home (18% very well, 47% not well, 35% not at all).
Foreign born population: 104 (2.9%) (82.0% of them are naturalized citizens)
This zip code:
2.9%
Whole state:
17.2%
75%France
18%Honduras
41%American
8%English
7%German
5%Irish
1%Italian
0%European
0%Scottish
Year of entry for the foreign-born population
02010 or later
182000 to 2009
01990 to 1999
74Before 1990
Housing units lacking complete plumbing facilities: 5.4% Housing units lacking complete kitchen facilities: 4.8%
68.8%Electricity
19.5%Bottled, tank, or LP gas
9.6%Utility gas
2.4%Wood
Population in 1990: 1,819.
Place of birth for U.S.-born residents:
This state: 2,754
Northeast: 384
Midwest: 60
South: 106
West: 149
56% of the 76093 zip code residents lived in the same house 5 years ago. Out of people who lived in different houses, 66% lived in this county. Out of people who lived in different counties, 50% lived in Texas.
94% of the 76093 zip code residents lived in the same house 1 year ago. Out of people who lived in different houses, 58% moved from this county. Out of people who lived in different houses, 42% moved from different county within same state.
Private vs. public school enrollment:
Students in private schools in grades 1 to 8 (elementary and middle school): 2
Here:
0.7%
Texas:
8.8%
Students in private schools in grades 9 to 12 (high school): 14
Here:
5.0%
Texas:
8.0%
Students in private undergraduate colleges: 5
Here:
13.0%
Texas:
16.2%
Occupation by median earnings in the past 12 months ($)
175,833Fire fighting and prevention, and other protective service workers including supervisors
94,198Production occupations
67,482Health technologists and technicians
57,200Education, training, and library occupations
49,748Installation, maintenance, and repair occupations
45,140Transportation occupations
Top industries in this zip code by the number of employees in 2005:
Construction: Commercial and Institutional Building Construction (50-99 employees: 1 establishment)
Construction: Masonry Contractors (20-49: 1)
Construction: Electrical Contractors (20-49: 1)
Finance and Insurance: Commercial Banking (5-9: 1, 1-4: 2)
Accommodation and Food Services: Limited-Service Restaurants (5-9: 1)
Other Services (except Public Administration): Religious Organizations (5-9: 1)
Finance and Insurance: Insurance Agencies and Brokerages (1-4: 2)
Fatal accident statistics in 2014:
Fatal accident count: 1
Vehicles involved in fatal accidents: 2
Fatal accidents caused by drunken drivers: 0
Fatalities: 1
Persons involved in fatal accidents: 4
Pedestrians involved in fatal accidents: 0
Fatal accident statistics in 2012:
Fatal accident count: 2
Vehicles involved in fatal accidents: 3
Fatal accidents caused by drunken drivers: 0
Fatalities: 2
Persons involved in fatal accidents: 6
Pedestrians involved in fatal accidents: 0
Home Mortgage Disclosure Act Aggregated Statistics For Year 2009 (Based on 2 partial tracts)
A) FHA, FSA/RHS & VA Home Purchase Loans
B) Conventional Home Purchase Loans
C) Refinancings
D) Home Improvement Loans
F) Non-occupant Loans on < 5 Family Dwellings (A B C & D)
G) Loans On Manufactured Home Dwelling (A B C & D)
Number
Average Value
Number
Average Value
Number
Average Value
Number
Average Value
Number
Average Value
Number
Average Value
LOANS ORIGINATED
15
$144,895
14
$137,930
33
$154,796
7
$20,734
4
$84,460
4
$74,992
APPLICATIONS APPROVED, NOT ACCEPTED
1
$138,770
2
$112,110
5
$143,198
1
$46,060
0
$0
1
$99,080
APPLICATIONS DENIED
5
$107,746
6
$96,607
18
$149,059
10
$31,997
2
$38,935
2
$74,235
APPLICATIONS WITHDRAWN
2
$105,900
3
$81,810
10
$133,017
2
$59,845
1
$27,570
0
$0
FILES CLOSED FOR INCOMPLETENESS
0
$0
1
$64,540
2
$157,560
0
$0
0
$0
0
$0
Aggregated Statistics For Year 2008 (Based on 2 partial tracts)
A) FHA, FSA/RHS & VA Home Purchase Loans
B) Conventional Home Purchase Loans
C) Refinancings
D) Home Improvement Loans
F) Non-occupant Loans on < 5 Family Dwellings (A B C & D)
G) Loans On Manufactured Home Dwelling (A B C & D)
Number
Average Value
Number
Average Value
Number
Average Value
Number
Average Value
Number
Average Value
Number
Average Value
LOANS ORIGINATED
18
$135,744
20
$129,003
19
$155,056
8
$23,938
9
$102,514
5
$78,598
APPLICATIONS APPROVED, NOT ACCEPTED
0
$0
3
$90,193
3
$108,980
1
$23,330
1
$39,390
1
$66,050
APPLICATIONS DENIED
3
$124,937
5
$85,324
13
$135,395
7
$27,227
1
$126,650
4
$43,025
APPLICATIONS WITHDRAWN
1
$131,810
1
$169,680
5
$133,502
0
$0
0
$0
0
$0
FILES CLOSED FOR INCOMPLETENESS
0
$0
0
$0
2
$90,595
0
$0
0
$0
0
$0
Aggregated Statistics For Year 2007 (Based on 2 partial tracts)
A) FHA, FSA/RHS & VA Home Purchase Loans
B) Conventional Home Purchase Loans
C) Refinancings
D) Home Improvement Loans
F) Non-occupant Loans on < 5 Family Dwellings (A B C & D)
G) Loans On Manufactured Home Dwelling (A B C & D)
Number
Average Value
Number
Average Value
Number
Average Value
Number
Average Value
Number
Average Value
Number
Average Value
LOANS ORIGINATED
10
$115,231
42
$126,156
20
$142,016
9
$44,002
5
$157,256
4
$69,312
APPLICATIONS APPROVED, NOT ACCEPTED
0
$0
6
$94,587
6
$148,572
1
$21,210
0
$0
2
$41,815
APPLICATIONS DENIED
2
$120,140
12
$83,577
27
$134,554
8
$37,080
2
$72,415
7
$48,870
APPLICATIONS WITHDRAWN
1
$155,740
5
$118,292
11
$147,395
2
$160,740
0
$0
0
$0
FILES CLOSED FOR INCOMPLETENESS
1
$90,600
2
$77,115
7
$136,220
1
$18,180
0
$0
0
$0
Aggregated Statistics For Year 2006 (Based on 2 partial tracts)
A) FHA, FSA/RHS & VA Home Purchase Loans
B) Conventional Home Purchase Loans
C) Refinancings
D) Home Improvement Loans
F) Non-occupant Loans on < 5 Family Dwellings (A B C & D)
G) Loans On Manufactured Home Dwelling (A B C & D)
Number
Average Value
Number
Average Value
Number
Average Value
Number
Average Value
Number
Average Value
Number
Average Value
LOANS ORIGINATED
6
$122,665
56
$99,719
25
$144,361
11
$36,195
8
$97,111
3
$55,953
APPLICATIONS APPROVED, NOT ACCEPTED
0
$0
6
$109,080
5
$91,748
1
$27,880
2
$60,295
2
$35,905
APPLICATIONS DENIED
2
$69,385
17
$78,584
27
$125,779
9
$77,737
4
$90,370
5
$58,600
APPLICATIONS WITHDRAWN
1
$92,110
5
$127,442
16
$124,628
3
$105,443
1
$157,560
0
$0
FILES CLOSED FOR INCOMPLETENESS
0
$0
0
$0
6
$116,402
0
$0
1
$65,750
0
$0
Aggregated Statistics For Year 2005 (Based on 2 partial tracts)
A) FHA, FSA/RHS & VA Home Purchase Loans
B) Conventional Home Purchase Loans
C) Refinancings
D) Home Improvement Loans
F) Non-occupant Loans on < 5 Family Dwellings (A B C & D)
G) Loans On Manufactured Home Dwelling (A B C & D)
Number
Average Value
Number
Average Value
Number
Average Value
Number
Average Value
Number
Average Value
Number
Average Value
LOANS ORIGINATED
8
$102,111
54
$96,848
31
$113,684
8
$54,275
5
$89,386
6
$63,528
APPLICATIONS APPROVED, NOT ACCEPTED
0
$0
5
$128,412
4
$115,065
2
$82,720
1
$60,600
1
$63,330
APPLICATIONS DENIED
1
$87,570
15
$69,710
27
$91,371
8
$33,141
4
$85,295
6
$53,883
APPLICATIONS WITHDRAWN
0
$0
8
$81,582
21
$118,401
4
$178,240
1
$19,390
1
$49,990
FILES CLOSED FOR INCOMPLETENESS
1
$58,480
2
$114,080
5
$106,474
0
$0
0
$0
0
$0
Aggregated Statistics For Year 2004 (Based on 2 partial tracts)
A) FHA, FSA/RHS & VA Home Purchase Loans
B) Conventional Home Purchase Loans
C) Refinancings
D) Home Improvement Loans
F) Non-occupant Loans on < 5 Family Dwellings (A B C & D)
G) Loans On Manufactured Home Dwelling (A B C & D)
Number
Average Value
Number
Average Value
Number
Average Value
Number
Average Value
Number
Average Value
Number
Average Value
LOANS ORIGINATED
8
$104,270
42
$93,014
45
$106,319
9
$28,886
6
$66,963
5
$65,932
APPLICATIONS APPROVED, NOT ACCEPTED
1
$103,020
5
$113,322
9
$126,182
1
$27,570
1
$102,410
2
$38,635
APPLICATIONS DENIED
1
$138,770
18
$82,483
28
$92,664
7
$41,294
4
$86,202
7
$44,714
APPLICATIONS WITHDRAWN
2
$70,600
5
$140,956
18
$113,204
1
$78,780
1
$23,630
1
$83,630
FILES CLOSED FOR INCOMPLETENESS
0
$0
2
$74,085
7
$135,139
0
$0
0
$0
0
$0
Aggregated Statistics For Year 2003 (Based on 2 partial tracts)
A) FHA, FSA/RHS & VA Home Purchase Loans
B) Conventional Home Purchase Loans
C) Refinancings
D) Home Improvement Loans
F) Non-occupant Loans on < 5 Family Dwellings (A B C & D)
Number
Average Value
Number
Average Value
Number
Average Value
Number
Average Value
Number
Average Value
LOANS ORIGINATED
6
$95,192
33
$89,055
76
$106,233
8
$34,731
5
$60,116
APPLICATIONS APPROVED, NOT ACCEPTED
1
$50,900
8
$69,804
11
$106,408
1
$69,390
1
$72,110
APPLICATIONS DENIED
2
$54,995
12
$65,246
39
$95,243
6
$12,675
1
$57,270
APPLICATIONS WITHDRAWN
2
$68,780
3
$123,320
21
$91,881
0
$0
1
$137,870
FILES CLOSED FOR INCOMPLETENESS
0
$0
2
$87,110
5
$67,690
0
$0
0
$0
Aggregated Statistics For Year 2002 (Based on 2 partial tracts)
A) FHA, FSA/RHS & VA Home Purchase Loans
B) Conventional Home Purchase Loans
C) Refinancings
D) Home Improvement Loans
F) Non-occupant Loans on < 5 Family Dwellings (A B C & D)
Number
Average Value
Number
Average Value
Number
Average Value
Number
Average Value
Number
Average Value
LOANS ORIGINATED
11
$91,671
35
$84,918
53
$89,419
9
$26,597
10
$61,570
APPLICATIONS APPROVED, NOT ACCEPTED
1
$107,870
5
$79,144
9
$80,127
2
$20,150
2
$63,025
APPLICATIONS DENIED
2
$84,990
14
$79,213
25
$93,336
8
$19,544
2
$33,025
APPLICATIONS WITHDRAWN
1
$61,210
4
$77,948
10
$86,658
0
$0
0
$0
FILES CLOSED FOR INCOMPLETENESS
0
$0
2
$78,780
5
$83,446
1
$37,880
0
$0
Aggregated Statistics For Year 2001 (Based on 2 partial tracts)
A) FHA, FSA/RHS & VA Home Purchase Loans
B) Conventional Home Purchase Loans
C) Refinancings
D) Home Improvement Loans
E) Loans on Dwellings For 5+ Families
F) Non-occupant Loans on < 5 Family Dwellings (A B C & D)
Number
Average Value
Number
Average Value
Number
Average Value
Number
Average Value
Number
Average Value
Number
Average Value
LOANS ORIGINATED
11
$100,514
35
$88,762
42
$88,433
15
$23,937
1
$329,060
8
$71,811
APPLICATIONS APPROVED, NOT ACCEPTED
0
$0
8
$52,911
4
$92,642
3
$24,643
0
$0
0
$0
APPLICATIONS DENIED
0
$0
25
$56,734
22
$73,835
8
$14,999
0
$0
2
$19,695
APPLICATIONS WITHDRAWN
0
$0
4
$106,580
12
$91,557
2
$23,030
0
$0
0
$0
FILES CLOSED FOR INCOMPLETENESS
0
$0
0
$0
2
$121,505
0
$0
0
$0
0
$0
Aggregated Statistics For Year 2000 (Based on 2 partial tracts)
A) FHA, FSA/RHS & VA Home Purchase Loans
B) Conventional Home Purchase Loans
C) Refinancings
D) Home Improvement Loans
F) Non-occupant Loans on < 5 Family Dwellings (A B C & D)
Number
Average Value
Number
Average Value
Number
Average Value
Number
Average Value
Number
Average Value
LOANS ORIGINATED
15
$85,305
36
$83,746
12
$100,217
10
$18,725
2
$96,960
APPLICATIONS APPROVED, NOT ACCEPTED
1
$77,870
9
$53,462
5
$72,962
2
$21,360
1
$44,240
APPLICATIONS DENIED
2
$42,725
24
$47,495
10
$101,475
9
$10,807
2
$56,055
APPLICATIONS WITHDRAWN
3
$86,760
6
$100,092
5
$77,992
1
$3,330
1
$83,020
FILES CLOSED FOR INCOMPLETENESS
1
$31,510
2
$61,660
2
$91,050
0
$0
0
$0
Aggregated Statistics For Year 1999 (Based on 1 partial tract)
A) FHA, FSA/RHS & VA Home Purchase Loans
B) Conventional Home Purchase Loans
C) Refinancings
D) Home Improvement Loans
F) Non-occupant Loans on < 5 Family Dwellings (A B C & D)
Detailed PMIC statistics for the following Tracts:1306.00
2002 - 2018 National Fire Incident Reporting System (NFIRS) incidents
According to the data from the years 2002 - 2018 the average number of fires per year is 50. The highest number of fires - 117 took place in 2011, and the least - 3 in 2002. The data has an increasing trend.
When looking into fire subcategories, the most incidents belonged to: Outside Fires (69.3%), and Structure Fires (18.6%).
Fire incident types reported to NFIRS in Zip Code 76093


 Nearest zip codes: 76627, 76636, 76033, 76031, 76059, 76652.


 According to the data from the years 2002 - 2018 the average number of fires per year is 50. The highest number of fires - 117 took place in 2011, and the least - 3 in 2002. The data has an increasing trend.
 When looking into fire subcategories, the most incidents belonged to: Outside Fires (69.3%), and Structure Fires (18.6%).