Estimated zip code population in 2022: 2,802 Zip code population in 2010: 2,863 Zip code population in 2000: 2,799
Houses and condos: 1,248 Renter-occupied apartments: 207
% of renters here:
19%
State:
38%
March 2022 cost of living index in zip code 76252: 80.2 (low, U.S. average is 100)
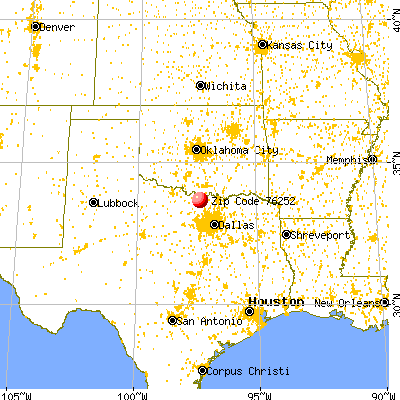
Land area: 185.0 sq. mi. Water area: 0.5 sq. mi.
Population density: 15 people per square mile
(very low).
OSM Map
General Map
Google Map
MSN Map
OSM Map
General Map
Google Map
MSN Map
OSM Map
General Map
Google Map
MSN Map
OSM Map
General Map
Google Map
MSN Map
Please wait while loading the map...
Real estate property taxes paid for housing units in 2022:
This zip code:
1.5% ($4,584)
Texas:
1.5% ($4,050)
Median real estate property taxes paid for housing units with mortgages in 2022: $5,202 (1.4%) Median real estate property taxes paid for housing units with no mortgage in 2022: $4,303 (1.6%)
Business Search- 14 Million verified businesses
Males: 1,496
(53.4%)
Females: 1,305
(46.6%)
For population 25 years and over in 76252:
High school or higher: 94.1%
Bachelor's degree or higher: 35.9%
Graduate or professional degree: 12.6%
Unemployed: 6.6%
Mean travel time to work (commute): 20.8 minutes
For population 15 years and over in 76252:
Never married: 28.2%
Now married: 58.0%
Separated: 0.4%
Widowed: 5.3%
Divorced: 8.2%
Zip code 76252 compared to state average:
Black race population percentage significantly below state average.
Hispanic race population percentage significantly below state average.
Median age significantly above state average.
Foreign-born population percentage significantly below state average.
Renting percentage below state average.
Length of stay since moving in significantly above state average.
Estimated median house/condo value in 2022: $296,344
76252:
$296,344
Texas:
$275,400
According to our research of Texas and other state lists, there were 5 registered sex offenders living in 76252 zip code as of May 28, 2024. The ratio of all residents to sex offenders in zip code 76252 is 560 to 1. The ratio of registered sex offenders to all residents in this zip code is lower than the state average.
Median resident age:
This zip code:
46.1 years
Texas median age:
35.6 years
Average household size:
This zip code:
2.6 people
Texas:
2.6 people
Averages for the 2020 tax year for zip code 76252, filed in 2021:
Average Adjusted Gross Income (AGI) in 2020: $77,899 (Individual Income Tax Returns)
Here:
$77,899
State:
$77,054
Salary/wage: $58,210 (reported on 81.7% of returns)
Here:
$58,210
State:
$62,766
(% of AGI for various income ranges: 1544.8% for AGIs below $25k, 3798.3% for AGIs $25k-50k, 7270.0% for AGIs $50k-75k, 8887.5% for AGIs $75k-100k, 14829.4% for AGIs $100k-200k)
Taxable interest for individuals: $1,418 (reported on 44.4% of returns)
This zip code:
$1,418
Texas:
$2,665
(% of AGI for various income ranges: 37.4% for AGIs below $25k, 33.9% for AGIs $25k-50k, 25.7% for AGIs $50k-75k, 49.2% for AGIs $75k-100k, 93.3% for AGIs $100k-200k)
Ordinary dividends: $10,621 (reported on 25.5% of returns)
Here:
$10,621
State:
$10,044
(% of AGI for various income ranges: 57.0% for AGIs below $25k, 65.2% for AGIs $25k-50k, 117.9% for AGIs $50k-75k, 234.2% for AGIs $75k-100k, 289.4% for AGIs $100k-200k)
Net capital gain/loss in AGI: +$32,662 (reported on 25.5% of returns)
Here:
+$32,662
State:
+$39,590
(% of AGI for various income ranges: 35.2% for AGIs below $25k, 61.7% for AGIs $25k-50k, 277.9% for AGIs $50k-75k, 458.3% for AGIs $75k-100k, 764.4% for AGIs $100k-200k)
Profit/loss from business: +$12,008 (reported on 24.2% of returns)
Here:
+$12,008
State:
+$10,888
(% of AGI for various income ranges: 177.8% for AGIs below $25k, 261.3% for AGIs $25k-50k, 355.0% for AGIs $50k-75k, 710.0% for AGIs $75k-100k, 696.1% for AGIs $100k-200k)
Taxable individual retirement arrangement distribution: $14,544 (reported on 11.8% of returns)
76252:
$14,544
Texas:
$24,740
(% of AGI for various income ranges: 113.7% for AGIs below $25k, 210.4% for AGIs $25k-50k, 505.0% for AGIs $75k-100k, 678.3% for AGIs $100k-200k)
Total itemized deductions: $51,280 (reported on 6.5% of returns)
Here:
$51,280
State:
$40,428
(% of AGI for various income ranges: 242.2% for AGIs below $25k, 589.3% for AGIs $50k-75k, 690.6% for AGIs $100k-200k)
Charity contributions: $11,633 (reported on 5.9% of returns)
Here:
$11,633
State:
$18,201
(% of AGI for various income ranges: 57.0% for AGIs $25k-50k, 177.8% for AGIs $100k-200k)
Taxes paid: $7,340 (reported on 6.5% of returns)
76252:
$7,340
State:
$7,821
(% of AGI for various income ranges: 43.3% for AGIs below $25k, 84.3% for AGIs $50k-75k, 120.0% for AGIs $100k-200k)
Earned income credit: $1,958 (reported on 7.8% of returns)
Here:
$1,958
State:
$2,584
(% of AGI for various income ranges: 44.4% for AGIs below $25k, 50.0% for AGIs $25k-50k)
Percentage of individuals using paid preparers for their 2020 taxes: 94.1%
Here:
94%
State:
92%
(% for various income ranges: 91.3% for AGIs below $25k, 96.8% for AGIs $25k-50k, 95.2% for AGIs $50k-75k, 94.4% for AGIs $75k-100k, 96.3% for AGIs $100k-200k, 90.0% for AGIs over 200k)
Averages for the 2012 tax year for zip code 76252, filed in 2013:
Average Adjusted Gross Income (AGI) in 2012: $87,011 (Individual Income Tax Returns)
Here:
$87,011
State:
$65,384
Salary/wage: $49,538 (reported on 83.1% of returns)
Here:
$49,538
State:
$52,524
(% of AGI for various income ranges: 71.1% for AGIs below $25k, 79.9% for AGIs $25k-50k, 72.6% for AGIs $50k-75k, 85.1% for AGIs $75k-100k, 69.8% for AGIs $100k-200k, 13.9% for AGIs over 200k)
Taxable interest for individuals: $2,222 (reported on 48.6% of returns)
This zip code:
$2,222
Texas:
$2,372
(% of AGI for various income ranges: 2.3% for AGIs below $25k, 1.3% for AGIs $25k-50k, 0.3% for AGIs $50k-75k, 0.4% for AGIs $75k-100k, 0.4% for AGIs $100k-200k, 1.9% for AGIs over 200k)
Ordinary dividends: $5,121 (reported on 26.8% of returns)
Here:
$5,121
State:
$9,721
(% of AGI for various income ranges: 2.4% for AGIs below $25k, 0.9% for AGIs $25k-50k, 1.3% for AGIs $50k-75k, 1.0% for AGIs $75k-100k, 1.7% for AGIs $100k-200k, 1.8% for AGIs over 200k)
Net capital gain/loss in AGI: +$25,806 (reported on 22.5% of returns)
Here:
+$25,806
State:
+$35,319
(% of AGI for various income ranges: 2.6% for AGIs $50k-75k, 1.1% for AGIs $75k-100k, 2.2% for AGIs $100k-200k, 12.9% for AGIs over 200k)
Profit/loss from business: +$41,362 (reported on 27.5% of returns)
Here:
+$41,362
State:
+$13,732
(% of AGI for various income ranges: 12.4% for AGIs below $25k, 7.1% for AGIs $25k-50k, 1.7% for AGIs $50k-75k, 2.5% for AGIs $75k-100k, 3.8% for AGIs $100k-200k, 23.6% for AGIs over 200k)
Taxable individual retirement arrangement distribution: $11,818 (reported on 12.0% of returns)
76252:
$11,818
Texas:
$19,511
(% of AGI for various income ranges: 6.1% for AGIs below $25k, 2.2% for AGIs $25k-50k, 5.6% for AGIs $50k-75k, 2.8% for AGIs $100k-200k)
Self-employment retirement plans: $34,750 (reported on 1.4% of returns)
76252:
$34,750
Texas:
$23,938
(% of AGI for various income ranges: 5.4% for AGIs $75k-100k)
Total itemized deductions: $22,521 (12% of AGI, reported on 29.6% of returns)
Here:
$22,521
State:
$24,724
Here:
12.3% of AGI
State:
15.9% of AGI
(% of AGI for various income ranges: 9.0% for AGIs below $25k, 9.1% for AGIs $25k-50k, 9.6% for AGIs $50k-75k, 9.0% for AGIs $75k-100k, 10.1% for AGIs $100k-200k, 5.3% for AGIs over 200k)
Charity contributions: $8,000 (reported on 25.4% of returns)
Here:
$8,000
State:
$6,808
(% of AGI for various income ranges: 1.3% for AGIs below $25k, 1.3% for AGIs $25k-50k, 1.6% for AGIs $50k-75k, 1.9% for AGIs $75k-100k, 2.0% for AGIs $100k-200k, 3.0% for AGIs over 200k)
Taxes paid: $5,631 (reported on 29.6% of returns)
76252:
$5,631
State:
$6,921
(% of AGI for various income ranges: 1.4% for AGIs below $25k, 1.8% for AGIs $25k-50k, 1.9% for AGIs $50k-75k, 2.5% for AGIs $75k-100k, 3.0% for AGIs $100k-200k, 1.3% for AGIs over 200k)
Earned income credit: $1,908 (reported on 8.5% of returns)
Here:
$1,908
State:
$2,570
(% of AGI for various income ranges: 3.1% for AGIs below $25k, 0.6% for AGIs $25k-50k)
Percentage of individuals using paid preparers for their 2012 taxes: 72.5%
Here:
73%
State:
51%
(% for various income ranges: 59.2% for AGIs below $25k, 71.4% for AGIs $25k-50k, 81.0% for AGIs $50k-75k, 73.3% for AGIs $75k-100k, 85.0% for AGIs $100k-200k, 100.0% for AGIs over 200k)
Averages for the 2004 tax year for zip code 76252, filed in 2005:
Average Adjusted Gross Income (AGI) in 2004: $49,946 (Individual Income Tax Returns)
Here:
$49,946
State:
$47,881
Salary/wage: $38,703 (reported on 82.5% of returns)
Here:
$38,703
State:
$41,947
(% of AGI for various income ranges: 127.7% for AGIs below $10k, 73.0% for AGIs $10k-25k, 81.0% for AGIs $25k-50k, 83.2% for AGIs $50k-75k, 76.3% for AGIs $75k-100k, 37.3% for AGIs over 100k)
Taxable interest for individuals: $2,298 (reported on 58.4% of returns)
This zip code:
$2,298
Texas:
$2,255
(% of AGI for various income ranges: 14.7% for AGIs below $10k, 4.4% for AGIs $10k-25k, 2.0% for AGIs $25k-50k, 1.0% for AGIs $50k-75k, 2.9% for AGIs $75k-100k, 3.0% for AGIs over 100k)
Taxable dividends: $3,974 (reported on 30.7% of returns)
Here:
$3,974
State:
$4,261
(% of AGI for various income ranges: 11.5% for AGIs below $10k, 2.7% for AGIs $10k-25k, 2.3% for AGIs $25k-50k, 1.5% for AGIs $50k-75k, 1.7% for AGIs $75k-100k, 2.9% for AGIs over 100k)
Net capital gain/loss: +$18,315 (reported on 29.0% of returns)
Here:
+$18,315
State:
+$16,110
(% of AGI for various income ranges: -2.2% for AGIs below $10k, 1.3% for AGIs $10k-25k, 2.5% for AGIs $25k-50k, 2.5% for AGIs $50k-75k, 4.1% for AGIs $75k-100k, 23.4% for AGIs over 100k)
Profit/loss from business: +$12,911 (reported on 30.3% of returns)
Here:
+$12,911
State:
+$11,013
(% of AGI for various income ranges: 3.3% for AGIs below $10k, 8.9% for AGIs $10k-25k, 4.8% for AGIs $25k-50k, 3.3% for AGIs $50k-75k, 4.4% for AGIs $75k-100k, 13.0% for AGIs over 100k)
IRA payment deduction: $3,567 (reported on 4.8% of returns)
76252:
$3,567
Texas:
$3,120
(% of AGI for various income ranges: 0.7% for AGIs $25k-50k, 0.5% for AGIs $50k-75k, 0.5% for AGIs $75k-100k, 0.1% for AGIs over 100k)
Self-employed pension: $20,231 (reported on 1.0% of returns)
Here:
$20,231
Texas:
$16,401
Total itemized deductions: $17,110 (22% of AGI, reported on 23.8% of returns)
Here:
$17,110
State:
$19,631
Here:
21.7% of AGI
State:
18.9% of AGI
(% of AGI for various income ranges: 37.8% for AGIs below $10k, 7.8% for AGIs $10k-25k, 7.7% for AGIs $25k-50k, 11.1% for AGIs $50k-75k, 10.0% for AGIs $75k-100k, 5.1% for AGIs over 100k)
Charity contributions deductions: $3,981 (5% of AGI, reported on 20.7% of returns)
Here:
$3,981
State:
$4,753
Here:
4.7% of AGI
State:
4.2% of AGI
(% of AGI for various income ranges: 2.1% for AGIs below $10k, 1.2% for AGIs $10k-25k, 1.3% for AGIs $25k-50k, 1.9% for AGIs $50k-75k, 2.4% for AGIs $75k-100k, 1.5% for AGIs over 100k)
Total tax: $8,123 (reported on 76.5% of returns)
76252:
$8,123
State:
$9,058
(% of AGI for various income ranges: 4.4% for AGIs below $10k, 5.3% for AGIs $10k-25k, 6.8% for AGIs $25k-50k, 7.2% for AGIs $50k-75k, 9.7% for AGIs $75k-100k, 20.4% for AGIs over 100k)
Earned income credit: $1,610 (reported on 9.4% of returns)
Here:
$1,610
State:
$2,024
Percentage of individuals using paid preparers for their 2004 taxes: 72.8%
Here:
73%
State:
57%
(% for various income ranges: 62.9% for AGIs below $10k, 69.8% for AGIs $10k-25k, 70.6% for AGIs $25k-50k, 79.6% for AGIs $50k-75k, 84.4% for AGIs $75k-100k, 87.5% for AGIs over 100k)
Likely homosexual households (counted as self-reported same-sex unmarried-partner households)
Lesbian couples: 0.3% of all households
Gay men: 0.0% of all households
Household received Food Stamps/SNAP in the past 12 months: 15 Household did not receive Food Stamps/SNAP in the past 12 months: 1,065
Women who had a birth in the past 12 months: 75 (49 now married, 25 unmarried) Women who did not have a birth in the past 12 months: 543 (304 now married, 237 unmarried)
Housing units in zip code 76252 with a mortgage: 294 (6 second mortgage, 3 home equity loan, 3 both second mortgage and home equity loan) Houses without a mortgage: 3
Median monthly owner costs for units with a mortgage: $2,186 Median monthly owner costs for units without a mortgage: $726
Residents with income below the poverty level in 2022:
This zip code:
5.1%
Whole state:
14.0%
Residents with income below 50% of the poverty level in 2022:
This zip code:
2.3%
Whole state:
7.4%
Median number of rooms in houses and condos:
Here:
6.3
State:
6.3
Median number of rooms in apartments:
Here:
5.8
State:
4.0
Notable locations in this zip code not listed on our city pages
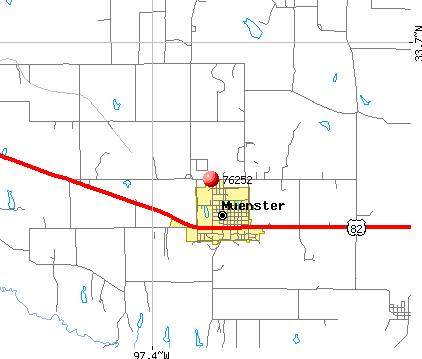
Notable locations in zip code 76252: Cleburne Municipal Library (A), Joshua Public Library (B), Muenster Volunteer Fire Department (C). Display/hide their locations on the map
Cemeteries: Brushy Mound Cemetery (1), Barlow Cemetery (2), Scanland Cemetery (3), Coker Cemetery (4), Hayes Cemetery (5), Roberts Cemetery (6), Able Cemetery (7). Display/hide their locations on the map
Reservoirs: Soil Conservation Service Site 7g Reservoir (A), Soil Conservation Service Site 7f Reservoir (B), Soil Conservation Service Site 6h Reservoir (C), Soil Conservation Service Site 7c Reservoir (D), Soil Conservation Service Site 7b Reservoir (E), Soil Conservation Service Site 7a Reservoir (F), Soil Conservation Service Site 4 Reservoir (G), Soil Conservation Service Site 6a1 Reservoir (H). Display/hide their locations on the map
Streams, rivers, and creeks: Waller Creek (A), Wilburn Branch (B), Squirrel Creek (C), Wildcat Creek (D), Camp Creek (E), Long Branch (F), Gibbons Branch (G). Display/hide their locations on the map
Parks in zip code 76252 include: Sacred Heart High School Football Field (1), Muenster High School Football Stadium (2). Display/hide their locations on the map
442 married couples with children.
8 single-parent households (4 men, 4 women).
97.1% of residents of 76252 zip code speak English at home.
1.5% of residents speak Spanish at home (46% very well, 39% well, 15% not at all).
0.3% of residents speak other Indo-European language at home (78% very well, 22% not well).
1.2% of residents speak Asian or Pacific Island language at home (100% very well).
Foreign born population: 58 (2.1%) (64.3% of them are naturalized citizens)
This zip code:
2.1%
Whole state:
17.2%
34%Malaysia
23%Honduras
20%El Salvador
11%Costa Rica
7%West Indies
2%Bhutan
2%Brazil
63%German
10%American
6%English
3%Irish
2%Italian
2%Scottish
1%French
Year of entry for the foreign-born population
82010 or later
282000 to 2009
171990 to 1999
6Before 1990
Facilities with environmental interests located in this zip code:
ASSOCIATED MILK PRODUCERS INCORPORATED (115 NORTH ELM in MUENSTER, TX)
ENFORCEMENT/COMPLIANCE ACTIVITY (Integrated Compliance Information System) - ICIS-06-2001-0140, FORMAL ENFORCEMENT ACTION (Integrated Compliance Information System) - ICIS-06-2001-0140, FORMAL ENFORCEMENT ACTION TRI REPORTER (Tracking of toxic chemicals releasing facilities) Business SIC classification: NATURAL, PROCESSED, AND IMITATION CHEESE; DRY, CONDENSED, AND EVAPORATED DAIRY PRODUCTS Alternative names: ASSOOCIATED MILK PRODUCERS INC., DAIRY FARMERS OF AMERICA INC. C/O RANDALL DOUGHERTY
ARCO PIPE LINE CO (COUNTY RD 3.5M NW OF in MUENSTER, TX)
(Resource Conservation and Recovery Act (tracking hazardous waste)) Organizations: ARCO PIPE LINE COMPANY (CONTACT/OPERATOR)
Alternative names: ARCO PIPELINE CO MUENSTER STATION
Housing units lacking complete plumbing facilities: 1.0% Housing units lacking complete kitchen facilities: 1.4%
46.7%Electricity
28.9%Utility gas
18.2%Bottled, tank, or LP gas
3.9%Wood
1.2%Other fuel
1.1%No fuel used
Population in 1990: 3,042.
Place of birth for U.S.-born residents:
This state: 2,356
Northeast: 67
Midwest: 83
South: 139
West: 66
64% of the 76252 zip code residents lived in the same house 5 years ago. Out of people who lived in different houses, 71% lived in this county. Out of people who lived in different counties, 50% lived in Texas.
93% of the 76252 zip code residents lived in the same house 1 year ago. Out of people who lived in different houses, 42% moved from this county. Out of people who lived in different houses, 41% moved from different county within same state. Out of people who lived in different houses, 19% moved from different state.
Private vs. public school enrollment:
Students in private schools in grades 1 to 8 (elementary and middle school): 20
Here:
10.2%
Texas:
8.8%
Students in private schools in grades 9 to 12 (high school): 5
Here:
1.7%
Texas:
8.0%
Students in private undergraduate colleges:
Here:
0.0%
Texas:
16.2%
Occupation by median earnings in the past 12 months ($)
89,324Management occupations
75,416Health diagnosing and treating practitioners and other technical occupations
60,542Business and financial operations occupations
56,624Installation, maintenance, and repair occupations
53,655Education, training, and library occupations
52,337Sales and related occupations
Companies with federal contracts located in this zip code:
RUMBER MATERIALS, INC (621 W DIVISION in MUENSTER, TX; small business)
$12,443 with Army for Rubber Fabricated Materials. Signed on 2002-09-26. Completion date: 2002-10-18.
Top industries in this zip code by the number of employees in 2005:
Health Care and Social Assistance: General Medical and Surgical Hospitals (50-99: 1)
Mining: Drilling Oil and Gas Wells (20-49: 1, 10-19: 2)
Other Services (except Public Administration): Religious Organizations (20-49: 1, 10-19: 1, 1-4: 1)
Health Care and Social Assistance: All Other Outpatient Care Centers (20-49: 1)
People in group quarters in 2010:
30 people in nursing facilities/skilled-nursing facilities
People in group quarters in 2000:
43 people in nursing homes
4 people in religious group quarters
Fatal accident statistics in 2014:
Fatal accident count: 2
Vehicles involved in fatal accidents: 4
Fatal accidents caused by drunken drivers: 0
Fatalities: 3
Persons involved in fatal accidents: 5
Pedestrians involved in fatal accidents: 0
Fatal accident statistics in 2011:
Fatal accident count: 1
Vehicles involved in fatal accidents: 3
Fatal accidents caused by drunken drivers: 1
Fatalities: 1
Persons involved in fatal accidents: 1
Pedestrians involved in fatal accidents: 3
2002 - 2018 National Fire Incident Reporting System (NFIRS) incidents
According to the data from the years 2002 - 2018 the average number of fires per year is 8. The highest number of reported fire incidents - 30 took place in 2011, and the least - 0 in 2003. The data has an increasing trend.
When looking into fire subcategories, the most reports belonged to: Outside Fires (76.7%), and Structure Fires (18.6%).
Fire incident types reported to NFIRS in Zip Code 76252


 Nearest zip codes: 76253, 76250, 76265, 76238, 76240, 73430.


 According to the data from the years 2002 - 2018 the average number of fires per year is 8. The highest number of reported fire incidents - 30 took place in 2011, and the least - 0 in 2003. The data has an increasing trend.
 When looking into fire subcategories, the most reports belonged to: Outside Fires (76.7%), and Structure Fires (18.6%).