Estimated zip code population in 2022: 19,044
Zip code population in 2010: 13,495
Zip code population in 2000: 10,353
Houses and condos: 7,353
Renter-occupied apartments: 1,287
% of renters here:
18%State:
38%
March 2022 cost of living index in zip code 76266: 86.0
(less than average, U.S. average is 100)
Land area: 120.2
sq. mi.
Water area: 10.7
sq. mi.
Population density: 158 people per square mile (very low).
OSM Map
General Map
Google Map
MSN Map
OSM Map
General Map
Google Map
MSN Map
OSM Map
General Map
Google Map
MSN Map
OSM Map
General Map
Google Map
MSN Map
Please wait while loading the map...
Real estate property taxes paid for housing units in 2022:
This zip code:
1.2% ($3,884)Texas:
1.5% ($4,050)
Median real estate property taxes paid for housing units with mortgages in 2022: $4,280 (1.3%)
Median real estate property taxes paid for housing units with no mortgage in 2022: $3,215 (0.9%)
Profiles of local businesses
Business Search - 14 Million verified businesses
Males: 9,651 Females: 9,392
For population 25 years and over in 76266:
High school or higher: 89.5%Bachelor's degree or higher: 29.2%Graduate or professional degree: 11.2%Unemployed: 1.7%Mean travel time to work (commute): 31.5 minutes
For population 15 years and over in 76266:
Never married: 26.5%Now married: 57.8%Separated: 1.2%Widowed: 4.8%Divorced: 9.6%
Zip code 76266 compared to state average:
Unemployed percentage below state average. Black race population percentage significantly below state average. Hispanic race population percentage below state average. Median age above state average. Foreign-born population percentage below state average. Renting percentage below state average. Length of stay since moving in above state average. House age below state average. 13,949 73.3% White 3,626 19.0% Hispanic or Latino 753 4.0% Black 402 2.1% Two or more races 260 1.4% Asian 31 0.2% American Indian 19 0.10% Some other race
Data:
Median household income ($)
Median household income (% change since 2000)
Household income diversity
Ratio of average income to average house value (%)
Ratio of average income to average rent
Median household income ($) - White
Median household income ($) - Black or African American
Median household income ($) - Asian
Median household income ($) - Hispanic or Latino
Median household income ($) - American Indian and Alaska Native
Median household income ($) - Multirace
Median household income ($) - Other Race
Median household income for houses/condos with a mortgage ($)
Median household income for apartments without a mortgage ($)
Races - White alone (%)
Races - White alone (% change since 2000)
Races - Black alone (%)
Races - Black alone (% change since 2000)
Races - American Indian alone (%)
Races - American Indian alone (% change since 2000)
Races - Asian alone (%)
Races - Asian alone (% change since 2000)
Races - Hispanic (%)
Races - Hispanic (% change since 2000)
Races - Native Hawaiian and Other Pacific Islander alone (%)
Races - Native Hawaiian and Other Pacific Islander alone (% change since 2000)
Races - Two or more races (%)
Races - Two or more races (% change since 2000)
Races - Other race alone (%)
Races - Other race alone (% change since 2000)
Racial diversity
Unemployment (%)
Unemployment (% change since 2000)
Unemployment (%) - White
Unemployment (%) - Black or African American
Unemployment (%) - Asian
Unemployment (%) - Hispanic or Latino
Unemployment (%) - American Indian and Alaska Native
Unemployment (%) - Multirace
Unemployment (%) - Other Race
Population density (people per square mile)
Population - Males (%)
Population - Females (%)
Population - Males (%) - White
Population - Males (%) - Black or African American
Population - Males (%) - Asian
Population - Males (%) - Hispanic or Latino
Population - Males (%) - American Indian and Alaska Native
Population - Males (%) - Multirace
Population - Males (%) - Other Race
Population - Females (%) - White
Population - Females (%) - Black or African American
Population - Females (%) - Asian
Population - Females (%) - Hispanic or Latino
Population - Females (%) - American Indian and Alaska Native
Population - Females (%) - Multirace
Population - Females (%) - Other Race
Coronavirus confirmed cases (May 20, 2024)
Deaths caused by coronavirus (May 20, 2024)
Coronavirus confirmed cases (per 100k population) (May 20, 2024)
Deaths caused by coronavirus (per 100k population) (May 20, 2024)
Daily increase in number of cases (May 20, 2024)
Weekly increase in number of cases (May 20, 2024)
Cases doubled (in days) (May 20, 2024)
Hospitalized patients (Apr 18, 2022)
Negative test results (Apr 18, 2022)
Total test results (Apr 18, 2022)
COVID Vaccine doses distributed (per 100k population) (Sep 19, 2023)
COVID Vaccine doses administered (per 100k population) (Sep 19, 2023)
COVID Vaccine doses distributed (Sep 19, 2023)
COVID Vaccine doses administered (Sep 19, 2023)
Likely homosexual households (%)
Likely homosexual households (% change since 2000)
Likely homosexual households - Lesbian couples (%)
Likely homosexual households - Lesbian couples (% change since 2000)
Likely homosexual households - Gay men (%)
Likely homosexual households - Gay men (% change since 2000)
Cost of living index
Median gross rent ($)
Median contract rent ($)
Median monthly housing costs ($)
Median house or condo value ($)
Median house or condo value ($ change since 2000)
Mean house or condo value by units in structure - 1, detached ($)
Mean house or condo value by units in structure - 1, attached ($)
Mean house or condo value by units in structure - 2 ($)
Mean house or condo value by units in structure by units in structure - 3 or 4 ($)
Mean house or condo value by units in structure - 5 or more ($)
Mean house or condo value by units in structure - Boat, RV, van, etc. ($)
Mean house or condo value by units in structure - Mobile home ($)
Median house or condo value ($) - White
Median house or condo value ($) - Black or African American
Median house or condo value ($) - Asian
Median house or condo value ($) - Hispanic or Latino
Median house or condo value ($) - American Indian and Alaska Native
Median house or condo value ($) - Multirace
Median house or condo value ($) - Other Race
Median resident age
Resident age diversity
Median resident age - Males
Median resident age - Females
Median resident age - White
Median resident age - Black or African American
Median resident age - Asian
Median resident age - Hispanic or Latino
Median resident age - American Indian and Alaska Native
Median resident age - Multirace
Median resident age - Other Race
Median resident age - Males - White
Median resident age - Males - Black or African American
Median resident age - Males - Asian
Median resident age - Males - Hispanic or Latino
Median resident age - Males - American Indian and Alaska Native
Median resident age - Males - Multirace
Median resident age - Males - Other Race
Median resident age - Females - White
Median resident age - Females - Black or African American
Median resident age - Females - Asian
Median resident age - Females - Hispanic or Latino
Median resident age - Females - American Indian and Alaska Native
Median resident age - Females - Multirace
Median resident age - Females - Other Race
Commute - mean travel time to work (minutes)
Travel time to work - Less than 5 minutes (%)
Travel time to work - Less than 5 minutes (% change since 2000)
Travel time to work - 5 to 9 minutes (%)
Travel time to work - 5 to 9 minutes (% change since 2000)
Travel time to work - 10 to 19 minutes (%)
Travel time to work - 10 to 19 minutes (% change since 2000)
Travel time to work - 20 to 29 minutes (%)
Travel time to work - 20 to 29 minutes (% change since 2000)
Travel time to work - 30 to 39 minutes (%)
Travel time to work - 30 to 39 minutes (% change since 2000)
Travel time to work - 40 to 59 minutes (%)
Travel time to work - 40 to 59 minutes (% change since 2000)
Travel time to work - 60 to 89 minutes (%)
Travel time to work - 60 to 89 minutes (% change since 2000)
Travel time to work - 90 or more minutes (%)
Travel time to work - 90 or more minutes (% change since 2000)
Marital status - Never married (%)
Marital status - Now married (%)
Marital status - Separated (%)
Marital status - Widowed (%)
Marital status - Divorced (%)
Median family income ($)
Median family income (% change since 2000)
Median non-family income ($)
Median non-family income (% change since 2000)
Median per capita income ($)
Median per capita income (% change since 2000)
Median family income ($) - White
Median family income ($) - Black or African American
Median family income ($) - Asian
Median family income ($) - Hispanic or Latino
Median family income ($) - American Indian and Alaska Native
Median family income ($) - Multirace
Median family income ($) - Other Race
Median year house/condo built
Median year apartment built
Year house built - Built 2005 or later (%)
Year house built - Built 2000 to 2004 (%)
Year house built - Built 1990 to 1999 (%)
Year house built - Built 1980 to 1989 (%)
Year house built - Built 1970 to 1979 (%)
Year house built - Built 1960 to 1969 (%)
Year house built - Built 1950 to 1959 (%)
Year house built - Built 1940 to 1949 (%)
Year house built - Built 1939 or earlier (%)
Average household size
Household density (households per square mile)
Average household size - White
Average household size - Black or African American
Average household size - Asian
Average household size - Hispanic or Latino
Average household size - American Indian and Alaska Native
Average household size - Multirace
Average household size - Other Race
Occupied housing units (%)
Vacant housing units (%)
Owner occupied housing units (%)
Renter occupied housing units (%)
Vacancy status - For rent (%)
Vacancy status - For sale only (%)
Vacancy status - Rented or sold, not occupied (%)
Vacancy status - For seasonal, recreational, or occasional use (%)
Vacancy status - For migrant workers (%)
Vacancy status - Other vacant (%)
Residents with income below the poverty level (%)
Residents with income below 50% of the poverty level (%)
Children below poverty level (%)
Poor families by family type - Married-couple family (%)
Poor families by family type - Male, no wife present (%)
Poor families by family type - Female, no husband present (%)
Poverty status for native-born residents (%)
Poverty status for foreign-born residents (%)
Poverty among high school graduates not in families (%)
Poverty among people who did not graduate high school not in families (%)
Residents with income below the poverty level (%) - White
Residents with income below the poverty level (%) - Black or African American
Residents with income below the poverty level (%) - Asian
Residents with income below the poverty level (%) - Hispanic or Latino
Residents with income below the poverty level (%) - American Indian and Alaska Native
Residents with income below the poverty level (%) - Multirace
Residents with income below the poverty level (%) - Other Race
Air pollution - Air Quality Index (AQI)
Air pollution - CO
Air pollution - NO2
Air pollution - SO2
Air pollution - Ozone
Air pollution - PM10
Air pollution - PM25
Air pollution - Pb
Crime - Murders per 100,000 population
Crime - Rapes per 100,000 population
Crime - Robberies per 100,000 population
Crime - Assaults per 100,000 population
Crime - Burglaries per 100,000 population
Crime - Thefts per 100,000 population
Crime - Auto thefts per 100,000 population
Crime - Arson per 100,000 population
Crime - City-data.com crime index
Crime - Violent crime index
Crime - Property crime index
Crime - Murders per 100,000 population (5 year average)
Crime - Rapes per 100,000 population (5 year average)
Crime - Robberies per 100,000 population (5 year average)
Crime - Assaults per 100,000 population (5 year average)
Crime - Burglaries per 100,000 population (5 year average)
Crime - Thefts per 100,000 population (5 year average)
Crime - Auto thefts per 100,000 population (5 year average)
Crime - Arson per 100,000 population (5 year average)
Crime - City-data.com crime index (5 year average)
Crime - Violent crime index (5 year average)
Crime - Property crime index (5 year average)
1996 Presidential Elections Results (%) - Democratic Party (Clinton)
1996 Presidential Elections Results (%) - Republican Party (Dole)
1996 Presidential Elections Results (%) - Other
2000 Presidential Elections Results (%) - Democratic Party (Gore)
2000 Presidential Elections Results (%) - Republican Party (Bush)
2000 Presidential Elections Results (%) - Other
2004 Presidential Elections Results (%) - Democratic Party (Kerry)
2004 Presidential Elections Results (%) - Republican Party (Bush)
2004 Presidential Elections Results (%) - Other
2008 Presidential Elections Results (%) - Democratic Party (Obama)
2008 Presidential Elections Results (%) - Republican Party (McCain)
2008 Presidential Elections Results (%) - Other
2012 Presidential Elections Results (%) - Democratic Party (Obama)
2012 Presidential Elections Results (%) - Republican Party (Romney)
2012 Presidential Elections Results (%) - Other
2016 Presidential Elections Results (%) - Democratic Party (Clinton)
2016 Presidential Elections Results (%) - Republican Party (Trump)
2016 Presidential Elections Results (%) - Other
2020 Presidential Elections Results (%) - Democratic Party (Biden)
2020 Presidential Elections Results (%) - Republican Party (Trump)
2020 Presidential Elections Results (%) - Other
Ancestries Reported - Arab (%)
Ancestries Reported - Czech (%)
Ancestries Reported - Danish (%)
Ancestries Reported - Dutch (%)
Ancestries Reported - English (%)
Ancestries Reported - French (%)
Ancestries Reported - French Canadian (%)
Ancestries Reported - German (%)
Ancestries Reported - Greek (%)
Ancestries Reported - Hungarian (%)
Ancestries Reported - Irish (%)
Ancestries Reported - Italian (%)
Ancestries Reported - Lithuanian (%)
Ancestries Reported - Norwegian (%)
Ancestries Reported - Polish (%)
Ancestries Reported - Portuguese (%)
Ancestries Reported - Russian (%)
Ancestries Reported - Scotch-Irish (%)
Ancestries Reported - Scottish (%)
Ancestries Reported - Slovak (%)
Ancestries Reported - Subsaharan African (%)
Ancestries Reported - Swedish (%)
Ancestries Reported - Swiss (%)
Ancestries Reported - Ukrainian (%)
Ancestries Reported - United States (%)
Ancestries Reported - Welsh (%)
Ancestries Reported - West Indian (%)
Ancestries Reported - Other (%)
Educational Attainment - No schooling completed (%)
Educational Attainment - Less than high school (%)
Educational Attainment - High school or equivalent (%)
Educational Attainment - Less than 1 year of college (%)
Educational Attainment - 1 or more years of college (%)
Educational Attainment - Associate degree (%)
Educational Attainment - Bachelor's degree (%)
Educational Attainment - Master's degree (%)
Educational Attainment - Professional school degree (%)
Educational Attainment - Doctorate degree (%)
School Enrollment - Nursery, preschool (%)
School Enrollment - Kindergarten (%)
School Enrollment - Grade 1 to 4 (%)
School Enrollment - Grade 5 to 8 (%)
School Enrollment - Grade 9 to 12 (%)
School Enrollment - College undergrad (%)
School Enrollment - Graduate or professional (%)
School Enrollment - Not enrolled in school (%)
School enrollment - Public schools (%)
School enrollment - Private schools (%)
School enrollment - Not enrolled (%)
Median number of rooms in houses and condos
Median number of rooms in apartments
Housing units lacking complete plumbing facilities (%)
Housing units lacking complete kitchen facilities (%)
Density of houses
Urban houses (%)
Rural houses (%)
Households with people 60 years and over (%)
Households with people 65 years and over (%)
Households with people 75 years and over (%)
Households with one or more nonrelatives (%)
Households with no nonrelatives (%)
Population in households (%)
Family households (%)
Nonfamily households (%)
Population in families (%)
Family households with own children (%)
Median number of bedrooms in owner occupied houses
Mean number of bedrooms in owner occupied houses
Median number of bedrooms in renter occupied houses
Mean number of bedrooms in renter occupied houses
Median number of vehichles in owner occupied houses
Mean number of vehichles in owner occupied houses
Median number of vehichles in renter occupied houses
Mean number of vehichles in renter occupied houses
Mortgage status - with mortgage (%)
Mortgage status - with second mortgage (%)
Mortgage status - with home equity loan (%)
Mortgage status - with both second mortgage and home equity loan (%)
Mortgage status - without a mortgage (%)
Average family size
Average family size - White
Average family size - Black or African American
Average family size - Asian
Average family size - Hispanic or Latino
Average family size - American Indian and Alaska Native
Average family size - Multirace
Average family size - Other Race
Geographical mobility - Same house 1 year ago (%)
Geographical mobility - Moved within same county (%)
Geographical mobility - Moved from different county within same state (%)
Geographical mobility - Moved from different state (%)
Geographical mobility - Moved from abroad (%)
Place of birth - Born in state of residence (%)
Place of birth - Born in other state (%)
Place of birth - Native, outside of US (%)
Place of birth - Foreign born (%)
Housing units in structures - 1, detached (%)
Housing units in structures - 1, attached (%)
Housing units in structures - 2 (%)
Housing units in structures - 3 or 4 (%)
Housing units in structures - 5 to 9 (%)
Housing units in structures - 10 to 19 (%)
Housing units in structures - 20 to 49 (%)
Housing units in structures - 50 or more (%)
Housing units in structures - Mobile home (%)
Housing units in structures - Boat, RV, van, etc. (%)
House/condo owner moved in on average (years ago)
Renter moved in on average (years ago)
Year householder moved into unit - Moved in 1999 to March 2000 (%)
Year householder moved into unit - Moved in 1995 to 1998 (%)
Year householder moved into unit - Moved in 1990 to 1994 (%)
Year householder moved into unit - Moved in 1980 to 1989 (%)
Year householder moved into unit - Moved in 1970 to 1979 (%)
Year householder moved into unit - Moved in 1969 or earlier (%)
Means of transportation to work - Drove car alone (%)
Means of transportation to work - Carpooled (%)
Means of transportation to work - Public transportation (%)
Means of transportation to work - Bus or trolley bus (%)
Means of transportation to work - Streetcar or trolley car (%)
Means of transportation to work - Subway or elevated (%)
Means of transportation to work - Railroad (%)
Means of transportation to work - Ferryboat (%)
Means of transportation to work - Taxicab (%)
Means of transportation to work - Motorcycle (%)
Means of transportation to work - Bicycle (%)
Means of transportation to work - Walked (%)
Means of transportation to work - Other means (%)
Working at home (%)
Industry diversity
Most Common Industries - Agriculture, forestry, fishing and hunting, and mining (%)
Most Common Industries - Agriculture, forestry, fishing and hunting (%)
Most Common Industries - Mining, quarrying, and oil and gas extraction (%)
Most Common Industries - Construction (%)
Most Common Industries - Manufacturing (%)
Most Common Industries - Wholesale trade (%)
Most Common Industries - Retail trade (%)
Most Common Industries - Transportation and warehousing, and utilities (%)
Most Common Industries - Transportation and warehousing (%)
Most Common Industries - Utilities (%)
Most Common Industries - Information (%)
Most Common Industries - Finance and insurance, and real estate and rental and leasing (%)
Most Common Industries - Finance and insurance (%)
Most Common Industries - Real estate and rental and leasing (%)
Most Common Industries - Professional, scientific, and management, and administrative and waste management services (%)
Most Common Industries - Professional, scientific, and technical services (%)
Most Common Industries - Management of companies and enterprises (%)
Most Common Industries - Administrative and support and waste management services (%)
Most Common Industries - Educational services, and health care and social assistance (%)
Most Common Industries - Educational services (%)
Most Common Industries - Health care and social assistance (%)
Most Common Industries - Arts, entertainment, and recreation, and accommodation and food services (%)
Most Common Industries - Arts, entertainment, and recreation (%)
Most Common Industries - Accommodation and food services (%)
Most Common Industries - Other services, except public administration (%)
Most Common Industries - Public administration (%)
Occupation diversity
Most Common Occupations - Management, business, science, and arts occupations (%)
Most Common Occupations - Management, business, and financial occupations (%)
Most Common Occupations - Management occupations (%)
Most Common Occupations - Business and financial operations occupations (%)
Most Common Occupations - Computer, engineering, and science occupations (%)
Most Common Occupations - Computer and mathematical occupations (%)
Most Common Occupations - Architecture and engineering occupations (%)
Most Common Occupations - Life, physical, and social science occupations (%)
Most Common Occupations - Education, legal, community service, arts, and media occupations (%)
Most Common Occupations - Community and social service occupations (%)
Most Common Occupations - Legal occupations (%)
Most Common Occupations - Education, training, and library occupations (%)
Most Common Occupations - Arts, design, entertainment, sports, and media occupations (%)
Most Common Occupations - Healthcare practitioners and technical occupations (%)
Most Common Occupations - Health diagnosing and treating practitioners and other technical occupations (%)
Most Common Occupations - Health technologists and technicians (%)
Most Common Occupations - Service occupations (%)
Most Common Occupations - Healthcare support occupations (%)
Most Common Occupations - Protective service occupations (%)
Most Common Occupations - Fire fighting and prevention, and other protective service workers including supervisors (%)
Most Common Occupations - Law enforcement workers including supervisors (%)
Most Common Occupations - Food preparation and serving related occupations (%)
Most Common Occupations - Building and grounds cleaning and maintenance occupations (%)
Most Common Occupations - Personal care and service occupations (%)
Most Common Occupations - Sales and office occupations (%)
Most Common Occupations - Sales and related occupations (%)
Most Common Occupations - Office and administrative support occupations (%)
Most Common Occupations - Natural resources, construction, and maintenance occupations (%)
Most Common Occupations - Farming, fishing, and forestry occupations (%)
Most Common Occupations - Construction and extraction occupations (%)
Most Common Occupations - Installation, maintenance, and repair occupations (%)
Most Common Occupations - Production, transportation, and material moving occupations (%)
Most Common Occupations - Production occupations (%)
Most Common Occupations - Transportation occupations (%)
Most Common Occupations - Material moving occupations (%)
People in Group quarters - Institutionalized population (%)
People in Group quarters - Correctional institutions (%)
People in Group quarters - Federal prisons and detention centers (%)
People in Group quarters - Halfway houses (%)
People in Group quarters - Local jails and other confinement facilities (including police lockups) (%)
People in Group quarters - Military disciplinary barracks (%)
People in Group quarters - State prisons (%)
People in Group quarters - Other types of correctional institutions (%)
People in Group quarters - Nursing homes (%)
People in Group quarters - Hospitals/wards, hospices, and schools for the handicapped (%)
People in Group quarters - Hospitals/wards and hospices for chronically ill (%)
People in Group quarters - Hospices or homes for chronically ill (%)
People in Group quarters - Military hospitals or wards for chronically ill (%)
People in Group quarters - Other hospitals or wards for chronically ill (%)
People in Group quarters - Hospitals or wards for drug/alcohol abuse (%)
People in Group quarters - Mental (Psychiatric) hospitals or wards (%)
People in Group quarters - Schools, hospitals, or wards for the mentally retarded (%)
People in Group quarters - Schools, hospitals, or wards for the physically handicapped (%)
People in Group quarters - Institutions for the deaf (%)
People in Group quarters - Institutions for the blind (%)
People in Group quarters - Orthopedic wards and institutions for the physically handicapped (%)
People in Group quarters - Wards in general hospitals for patients who have no usual home elsewhere (%)
People in Group quarters - Wards in military hospitals for patients who have no usual home elsewhere (%)
People in Group quarters - Juvenile institutions (%)
People in Group quarters - Long-term care (%)
People in Group quarters - Homes for abused, dependent, and neglected children (%)
People in Group quarters - Residential treatment centers for emotionally disturbed children (%)
People in Group quarters - Training schools for juvenile delinquents (%)
People in Group quarters - Short-term care, detention or diagnostic centers for delinquent children (%)
People in Group quarters - Type of juvenile institution unknown (%)
People in Group quarters - Noninstitutionalized population (%)
People in Group quarters - College dormitories (includes college quarters off campus) (%)
People in Group quarters - Military quarters (%)
People in Group quarters - On base (%)
People in Group quarters - Barracks, unaccompanied personnel housing (UPH), (Enlisted/Officer), ;and similar group living quarters for military personnel (%)
People in Group quarters - Transient quarters for temporary residents (%)
People in Group quarters - Military ships (%)
People in Group quarters - Group homes (%)
People in Group quarters - Homes or halfway houses for drug/alcohol abuse (%)
People in Group quarters - Homes for the mentally ill (%)
People in Group quarters - Homes for the mentally retarded (%)
People in Group quarters - Homes for the physically handicapped (%)
People in Group quarters - Other group homes (%)
People in Group quarters - Religious group quarters (%)
People in Group quarters - Dormitories (%)
People in Group quarters - Agriculture workers' dormitories on farms (%)
People in Group quarters - Job Corps and vocational training facilities (%)
People in Group quarters - Other workers' dormitories (%)
People in Group quarters - Crews of maritime vessels (%)
People in Group quarters - Other nonhousehold living situations (%)
People in Group quarters - Other noninstitutional group quarters (%)
Residents speaking English at home (%)
Residents speaking English at home - Born in the United States (%)
Residents speaking English at home - Native, born elsewhere (%)
Residents speaking English at home - Foreign born (%)
Residents speaking Spanish at home (%)
Residents speaking Spanish at home - Born in the United States (%)
Residents speaking Spanish at home - Native, born elsewhere (%)
Residents speaking Spanish at home - Foreign born (%)
Residents speaking other language at home (%)
Residents speaking other language at home - Born in the United States (%)
Residents speaking other language at home - Native, born elsewhere (%)
Residents speaking other language at home - Foreign born (%)
Class of Workers - Employee of private company (%)
Class of Workers - Self-employed in own incorporated business (%)
Class of Workers - Private not-for-profit wage and salary workers (%)
Class of Workers - Local government workers (%)
Class of Workers - State government workers (%)
Class of Workers - Federal government workers (%)
Class of Workers - Self-employed workers in own not incorporated business and Unpaid family workers (%)
House heating fuel used in houses and condos - Utility gas (%)
House heating fuel used in houses and condos - Bottled, tank, or LP gas (%)
House heating fuel used in houses and condos - Electricity (%)
House heating fuel used in houses and condos - Fuel oil, kerosene, etc. (%)
House heating fuel used in houses and condos - Coal or coke (%)
House heating fuel used in houses and condos - Wood (%)
House heating fuel used in houses and condos - Solar energy (%)
House heating fuel used in houses and condos - Other fuel (%)
House heating fuel used in houses and condos - No fuel used (%)
House heating fuel used in apartments - Utility gas (%)
House heating fuel used in apartments - Bottled, tank, or LP gas (%)
House heating fuel used in apartments - Electricity (%)
House heating fuel used in apartments - Fuel oil, kerosene, etc. (%)
House heating fuel used in apartments - Coal or coke (%)
House heating fuel used in apartments - Wood (%)
House heating fuel used in apartments - Solar energy (%)
House heating fuel used in apartments - Other fuel (%)
House heating fuel used in apartments - No fuel used (%)
Armed forces status - In Armed Forces (%)
Armed forces status - Civilian (%)
Armed forces status - Civilian - Veteran (%)
Armed forces status - Civilian - Nonveteran (%)
Fatal accidents locations in years 2005-2021
Fatal accidents locations in 2005
Fatal accidents locations in 2006
Fatal accidents locations in 2007
Fatal accidents locations in 2008
Fatal accidents locations in 2009
Fatal accidents locations in 2010
Fatal accidents locations in 2011
Fatal accidents locations in 2012
Fatal accidents locations in 2013
Fatal accidents locations in 2014
Fatal accidents locations in 2015
Fatal accidents locations in 2016
Fatal accidents locations in 2017
Fatal accidents locations in 2018
Fatal accidents locations in 2019
Fatal accidents locations in 2020
Fatal accidents locations in 2021
Alcohol use - People drinking some alcohol every month (%)
Alcohol use - People not drinking at all (%)
Alcohol use - Average days/month drinking alcohol
Alcohol use - Average drinks/week
Alcohol use - Average days/year people drink much
Audiometry - Average condition of hearing (%)
Audiometry - People that can hear a whisper from across a quiet room (%)
Audiometry - People that can hear normal voice from across a quiet room (%)
Audiometry - Ears ringing, roaring, buzzing (%)
Audiometry - Had a job exposure to loud noise (%)
Audiometry - Had off-work exposure to loud noise (%)
Blood Pressure & Cholesterol - Has high blood pressure (%)
Blood Pressure & Cholesterol - Checking blood pressure at home (%)
Blood Pressure & Cholesterol - Frequently checking blood cholesterol (%)
Blood Pressure & Cholesterol - Has high cholesterol level (%)
Consumer Behavior - Money monthly spent on food at supermarket/grocery store
Consumer Behavior - Money monthly spent on food at other stores
Consumer Behavior - Money monthly spent on eating out
Consumer Behavior - Money monthly spent on carryout/delivered foods
Consumer Behavior - Income spent on food at supermarket/grocery store (%)
Consumer Behavior - Income spent on food at other stores (%)
Consumer Behavior - Income spent on eating out (%)
Consumer Behavior - Income spent on carryout/delivered foods (%)
Current Health Status - General health condition (%)
Current Health Status - Blood donors (%)
Current Health Status - Has blood ever tested for HIV virus (%)
Current Health Status - Left-handed people (%)
Dermatology - People using sunscreen (%)
Diabetes - Diabetics (%)
Diabetes - Had a blood test for high blood sugar (%)
Diabetes - People taking insulin (%)
Diet Behavior & Nutrition - Diet health (%)
Diet Behavior & Nutrition - Milk product consumption (# of products/month)
Diet Behavior & Nutrition - Meals not home prepared (#/week)
Diet Behavior & Nutrition - Meals from fast food or pizza place (#/week)
Diet Behavior & Nutrition - Ready-to-eat foods (#/month)
Diet Behavior & Nutrition - Frozen meals/pizza (#/month)
Drug Use - People that ever used marijuana or hashish (%)
Drug Use - Ever used hard drugs (%)
Drug Use - Ever used any form of cocaine (%)
Drug Use - Ever used heroin (%)
Drug Use - Ever used methamphetamine (%)
Health Insurance - People covered by health insurance (%)
Kidney Conditions-Urology - Avg. # of times urinating at night
Medical Conditions - People with asthma (%)
Medical Conditions - People with anemia (%)
Medical Conditions - People with psoriasis (%)
Medical Conditions - People with overweight (%)
Medical Conditions - Elderly people having difficulties in thinking or remembering (%)
Medical Conditions - People who ever received blood transfusion (%)
Medical Conditions - People having trouble seeing even with glass/contacts (%)
Medical Conditions - People with arthritis (%)
Medical Conditions - People with gout (%)
Medical Conditions - People with congestive heart failure (%)
Medical Conditions - People with coronary heart disease (%)
Medical Conditions - People with angina pectoris (%)
Medical Conditions - People who ever had heart attack (%)
Medical Conditions - People who ever had stroke (%)
Medical Conditions - People with emphysema (%)
Medical Conditions - People with thyroid problem (%)
Medical Conditions - People with chronic bronchitis (%)
Medical Conditions - People with any liver condition (%)
Medical Conditions - People who ever had cancer or malignancy (%)
Mental Health - People who have little interest in doing things (%)
Mental Health - People feeling down, depressed, or hopeless (%)
Mental Health - People who have trouble sleeping or sleeping too much (%)
Mental Health - People feeling tired or having little energy (%)
Mental Health - People with poor appetite or overeating (%)
Mental Health - People feeling bad about themself (%)
Mental Health - People who have trouble concentrating on things (%)
Mental Health - People moving or speaking slowly or too fast (%)
Mental Health - People having thoughts they would be better off dead (%)
Oral Health - Average years since last visit a dentist
Oral Health - People embarrassed because of mouth (%)
Oral Health - People with gum disease (%)
Oral Health - General health of teeth and gums (%)
Oral Health - Average days a week using dental floss/device
Oral Health - Average days a week using mouthwash for dental problem
Oral Health - Average number of teeth
Pesticide Use - Households using pesticides to control insects (%)
Pesticide Use - Households using pesticides to kill weeds (%)
Physical Activity - People doing vigorous-intensity work activities (%)
Physical Activity - People doing moderate-intensity work activities (%)
Physical Activity - People walking or bicycling (%)
Physical Activity - People doing vigorous-intensity recreational activities (%)
Physical Activity - People doing moderate-intensity recreational activities (%)
Physical Activity - Average hours a day doing sedentary activities
Physical Activity - Average hours a day watching TV or videos
Physical Activity - Average hours a day using computer
Physical Functioning - People having limitations keeping them from working (%)
Physical Functioning - People limited in amount of work they can do (%)
Physical Functioning - People that need special equipment to walk (%)
Physical Functioning - People experiencing confusion/memory problems (%)
Physical Functioning - People requiring special healthcare equipment (%)
Prescription Medications - Average number of prescription medicines taking
Preventive Aspirin Use - Adults 40+ taking low-dose aspirin (%)
Reproductive Health - Vaginal deliveries (%)
Reproductive Health - Cesarean deliveries (%)
Reproductive Health - Deliveries resulted in a live birth (%)
Reproductive Health - Pregnancies resulted in a delivery (%)
Reproductive Health - Women breastfeeding newborns (%)
Reproductive Health - Women that had a hysterectomy (%)
Reproductive Health - Women that had both ovaries removed (%)
Reproductive Health - Women that have ever taken birth control pills (%)
Reproductive Health - Women taking birth control pills (%)
Reproductive Health - Women that have ever used Depo-Provera or injectables (%)
Reproductive Health - Women that have ever used female hormones (%)
Sexual Behavior - People 18+ that ever had sex (vaginal, anal, or oral) (%)
Sexual Behavior - Males 18+ that ever had vaginal sex with a woman (%)
Sexual Behavior - Males 18+ that ever performed oral sex on a woman (%)
Sexual Behavior - Males 18+ that ever had anal sex with a woman (%)
Sexual Behavior - Males 18+ that ever had any sex with a man (%)
Sexual Behavior - Females 18+ that ever had vaginal sex with a man (%)
Sexual Behavior - Females 18+ that ever performed oral sex on a man (%)
Sexual Behavior - Females 18+ that ever had anal sex with a man (%)
Sexual Behavior - Females 18+ that ever had any kind of sex with a woman (%)
Sexual Behavior - Average age people first had sex
Sexual Behavior - Average number of female sex partners in lifetime (males 18+)
Sexual Behavior - Average number of female vaginal sex partners in lifetime (males 18+)
Sexual Behavior - Average age people first performed oral sex on a woman (18+)
Sexual Behavior - Average number of woman performed oral sex on in lifetime (18+)
Sexual Behavior - Average number of male sex partners in lifetime (males 18+)
Sexual Behavior - Average number of male anal sex partners in lifetime (males 18+)
Sexual Behavior - Average age people first performed oral sex on a man (18+)
Sexual Behavior - Average number of male oral sex partners in lifetime (18+)
Sexual Behavior - People using protection when performing oral sex (%)
Sexual Behavior - Average number of times people have vaginal or anal sex a year
Sexual Behavior - People having sex without condom (%)
Sexual Behavior - Average number of male sex partners in lifetime (females 18+)
Sexual Behavior - Average number of male vaginal sex partners in lifetime (females 18+)
Sexual Behavior - Average number of female sex partners in lifetime (females 18+)
Sexual Behavior - Circumcised males 18+ (%)
Sleep Disorders - Average hours sleeping at night
Sleep Disorders - People that has trouble sleeping (%)
Smoking-Cigarette Use - People smoking cigarettes (%)
Taste & Smell - People 40+ having problems with smell (%)
Taste & Smell - People 40+ having problems with taste (%)
Taste & Smell - People 40+ that ever had wisdom teeth removed (%)
Taste & Smell - People 40+ that ever had tonsils teeth removed (%)
Taste & Smell - People 40+ that ever had a loss of consciousness because of a head injury (%)
Taste & Smell - People 40+ that ever had a broken nose or other serious injury to face or skull (%)
Taste & Smell - People 40+ that ever had two or more sinus infections (%)
Weight - Average height (inches)
Weight - Average weight (pounds)
Weight - Average BMI
Weight - People that are obese (%)
Weight - People that ever were obese (%)
Weight - People trying to lose weight (%)
Urban population: 8,235
Rural population: 10,808
Estimated median house/condo value in 2022: $337,076
76266:
$337,076Texas:
$275,400
Median resident age: This zip code:
41.6 yearsTexas median age:
35.6 years
Average household size: This zip code:
2.6 peopleTexas:
2.6 people
Averages for the 2020 tax year for zip code 76266, filed in 2021:
Average Adjusted Gross Income (AGI) in 2020: $69,504 (Individual Income Tax Returns) Here:
$69,504State:
$77,054
Salary/wage: $61,989 (reported on 84.7% of returns )Here:
$61,989State:
$62,766
(% of AGI for various income ranges: 1296.8% for AGIs below $25k , 3660.4% for AGIs $25k-50k , 6612.2% for AGIs $50k-75k , 9843.7% for AGIs $75k-100k , 17014.2% for AGIs $100k-200k , 58198.2% for AGIs over 200k ) Taxable interest for individuals: $1,597 (reported on 24.8% of returns )This zip code:
$1,597Texas:
$2,665
(% of AGI for various income ranges: 14.8% for AGIs below $25k , 14.5% for AGIs $25k-50k , 25.7% for AGIs $50k-75k , 35.5% for AGIs $75k-100k , 77.4% for AGIs $100k-200k , 1440.0% for AGIs over 200k ) Ordinary dividends: $3,337 (reported on 13.1% of returns )(% of AGI for various income ranges: 16.2% for AGIs below $25k , 24.0% for AGIs $25k-50k , 28.9% for AGIs $50k-75k , 53.1% for AGIs $75k-100k , 107.6% for AGIs $100k-200k , 1192.7% for AGIs over 200k ) Net capital gain/loss in AGI: +$16,805 (reported on 12.3% of returns )Here:
+$16,805State:
+$39,590
(% of AGI for various income ranges: 9.3% for AGIs below $25k , 15.1% for AGIs $25k-50k , 31.1% for AGIs $50k-75k , 96.0% for AGIs $75k-100k , 366.6% for AGIs $100k-200k , 11310.9% for AGIs over 200k ) Profit/loss from business: +$8,740 (reported on 19.4% of returns )Here:
+$8,740State:
+$10,888
(% of AGI for various income ranges: 110.7% for AGIs below $25k , 156.9% for AGIs $25k-50k , 223.6% for AGIs $50k-75k , 368.4% for AGIs $75k-100k , 248.5% for AGIs $100k-200k , 2326.4% for AGIs over 200k ) Taxable individual retirement arrangement distribution: $22,941 (reported on 7.1% of returns )76266:
$22,941Texas:
$24,740
(% of AGI for various income ranges: 39.3% for AGIs below $25k , 72.4% for AGIs $25k-50k , 136.4% for AGIs $50k-75k , 239.3% for AGIs $75k-100k , 655.2% for AGIs $100k-200k , 2483.6% for AGIs over 200k ) Total itemized deductions: $32,455 (reported on 7.5% of returns )Here:
$32,455State:
$40,428
(% of AGI for various income ranges: 43.3% for AGIs below $25k , 107.2% for AGIs $25k-50k , 274.7% for AGIs $50k-75k , 343.6% for AGIs $75k-100k , 709.7% for AGIs $100k-200k , 5510.9% for AGIs over 200k ) Charity contributions: $9,932 (reported on 5.7% of returns )(% of AGI for various income ranges: 15.0% for AGIs $25k-50k , 43.1% for AGIs $50k-75k , 58.2% for AGIs $75k-100k , 177.9% for AGIs $100k-200k , 1791.8% for AGIs over 200k ) Taxes paid: $7,088 (reported on 7.1% of returns )(% of AGI for various income ranges: 5.6% for AGIs below $25k , 18.4% for AGIs $25k-50k , 64.5% for AGIs $50k-75k , 77.3% for AGIs $75k-100k , 153.2% for AGIs $100k-200k , 1100.0% for AGIs over 200k ) Earned income credit: $2,339 (reported on 13.8% of returns )(% of AGI for various income ranges: 96.3% for AGIs below $25k , 64.4% for AGIs $25k-50k , 1.6% for AGIs $50k-75k ) Percentage of individuals using paid preparers for their 2020 taxes: 93.3%(% for various income ranges: 92.0% for AGIs below $25k , 94.4% for AGIs $25k-50k , 93.4% for AGIs $50k-75k , 94.7% for AGIs $75k-100k , 93.7% for AGIs $100k-200k , 90.6% for AGIs over 200k )
Averages for the 2012 tax year for zip code 76266, filed in 2013:
Average Adjusted Gross Income (AGI) in 2012: $55,428 (Individual Income Tax Returns) Here:
$55,428State:
$65,384
Salary/wage: $50,663 (reported on 86.4% of returns )Here:
$50,663State:
$52,524
(% of AGI for various income ranges: 77.4% for AGIs below $25k , 85.6% for AGIs $25k-50k , 85.4% for AGIs $50k-75k , 84.2% for AGIs $75k-100k , 79.6% for AGIs $100k-200k , 56.5% for AGIs over 200k ) Taxable interest for individuals: $1,327 (reported on 27.2% of returns )This zip code:
$1,327Texas:
$2,372
(% of AGI for various income ranges: 0.7% for AGIs below $25k , 0.5% for AGIs $25k-50k , 0.5% for AGIs $50k-75k , 0.3% for AGIs $75k-100k , 0.6% for AGIs $100k-200k , 1.5% for AGIs over 200k ) Ordinary dividends: $2,708 (reported on 13.1% of returns )(% of AGI for various income ranges: 2.2% for AGIs below $25k , 0.3% for AGIs $25k-50k , 0.4% for AGIs $50k-75k , 0.4% for AGIs $75k-100k , 0.5% for AGIs $100k-200k , 1.0% for AGIs over 200k ) Net capital gain/loss in AGI: +$7,390 (reported on 10.9% of returns )Here:
+$7,390State:
+$35,319
(% of AGI for various income ranges: 0.3% for AGIs below $25k , 0.4% for AGIs $25k-50k , 0.1% for AGIs $50k-75k , 0.5% for AGIs $75k-100k , 1.7% for AGIs $100k-200k , 5.8% for AGIs over 200k ) Profit/loss from business: +$10,630 (reported on 18.1% of returns )Here:
+$10,630State:
+$13,732
(% of AGI for various income ranges: 8.0% for AGIs below $25k , 2.7% for AGIs $25k-50k , 2.5% for AGIs $50k-75k , 2.4% for AGIs $75k-100k , 1.9% for AGIs $100k-200k , 7.5% for AGIs over 200k ) Taxable individual retirement arrangement distribution: $17,553 (reported on 7.7% of returns )76266:
$17,553Texas:
$19,511
(% of AGI for various income ranges: 2.8% for AGIs below $25k , 1.6% for AGIs $25k-50k , 1.0% for AGIs $50k-75k , 2.7% for AGIs $75k-100k , 3.3% for AGIs $100k-200k , 2.8% for AGIs over 200k ) Self-employment retirement plans: $16,000 (reported on 0.3% of returns )76266:
$16,000Texas:
$23,938
Total itemized deductions: $20,638 (21% of AGI, reported on 26.6% of returns )Here:
$20,638State:
$24,724
Here:
20.5% of AGIState:
15.9% of AGI
(% of AGI for various income ranges: 8.4% for AGIs below $25k , 7.4% for AGIs $25k-50k , 9.6% for AGIs $50k-75k , 10.4% for AGIs $75k-100k , 11.6% for AGIs $100k-200k , 9.8% for AGIs over 200k ) Charity contributions: $4,318 (reported on 19.8% of returns )(% of AGI for various income ranges: 0.6% for AGIs below $25k , 0.9% for AGIs $25k-50k , 1.1% for AGIs $50k-75k , 1.5% for AGIs $75k-100k , 2.2% for AGIs $100k-200k , 2.2% for AGIs over 200k ) Taxes paid: $4,860 (reported on 25.9% of returns )(% of AGI for various income ranges: 1.3% for AGIs below $25k , 1.4% for AGIs $25k-50k , 2.0% for AGIs $50k-75k , 2.5% for AGIs $75k-100k , 3.0% for AGIs $100k-200k , 2.4% for AGIs over 200k ) Earned income credit: $2,227 (reported on 17.2% of returns )(% of AGI for various income ranges: 6.1% for AGIs below $25k , 1.3% for AGIs $25k-50k ) Percentage of individuals using paid preparers for their 2012 taxes: 53.8%(% for various income ranges: 51.4% for AGIs below $25k , 51.9% for AGIs $25k-50k , 53.5% for AGIs $50k-75k , 55.4% for AGIs $75k-100k , 58.2% for AGIs $100k-200k , 80.0% for AGIs over 200k )
Averages for the 2004 tax year for zip code 76266, filed in 2005:
Average Adjusted Gross Income (AGI) in 2004: $43,383 (Individual Income Tax Returns) Here:
$43,383State:
$47,881
Salary/wage: $41,388 (reported on 86.8% of returns )Here:
$41,388State:
$41,947
(% of AGI for various income ranges: 210.7% for AGIs below $10k , 80.0% for AGIs $10k-25k , 87.6% for AGIs $25k-50k , 86.8% for AGIs $50k-75k , 87.2% for AGIs $75k-100k , 69.2% for AGIs over 100k ) Taxable interest for individuals: $1,652 (reported on 35.2% of returns )This zip code:
$1,652Texas:
$2,255
(% of AGI for various income ranges: 7.5% for AGIs below $10k , 2.1% for AGIs $10k-25k , 1.0% for AGIs $25k-50k , 1.3% for AGIs $50k-75k , 1.0% for AGIs $75k-100k , 1.4% for AGIs over 100k ) Taxable dividends: $1,485 (reported on 16.3% of returns )(% of AGI for various income ranges: 2.8% for AGIs below $10k , 0.6% for AGIs $10k-25k , 0.2% for AGIs $25k-50k , 0.3% for AGIs $50k-75k , 0.5% for AGIs $75k-100k , 0.9% for AGIs over 100k ) Net capital gain/loss: +$11,848 (reported on 14.0% of returns )Here:
+$11,848State:
+$16,110
(% of AGI for various income ranges: 1.6% for AGIs below $10k , 0.5% for AGIs $10k-25k , 0.4% for AGIs $25k-50k , 1.1% for AGIs $50k-75k , 1.0% for AGIs $75k-100k , 11.3% for AGIs over 100k ) Profit/loss from business: +$7,548 (reported on 21.2% of returns )Here:
+$7,548State:
+$11,013
(% of AGI for various income ranges: -7.7% for AGIs below $10k , 7.8% for AGIs $10k-25k , 3.7% for AGIs $25k-50k , 3.0% for AGIs $50k-75k , 3.1% for AGIs $75k-100k , 3.8% for AGIs over 100k ) IRA payment deduction: $3,071 (reported on 2.0% of returns )(% of AGI for various income ranges: 0.2% for AGIs $25k-50k , 0.2% for AGIs $50k-75k , 0.2% for AGIs $75k-100k , 0.1% for AGIs over 100k ) Self-employed pension: $8,875 (reported on 0.5% of returns )Total itemized deductions: $16,570 (22% of AGI, reported on 29.5% of returns )Here:
$16,570State:
$19,631
Here:
21.6% of AGIState:
18.9% of AGI
(% of AGI for various income ranges: 21.4% for AGIs below $10k , 8.5% for AGIs $10k-25k , 9.6% for AGIs $25k-50k , 12.1% for AGIs $50k-75k , 13.1% for AGIs $75k-100k , 11.1% for AGIs over 100k ) Charity contributions deductions: $3,349 (4% of AGI, reported on 23.5% of returns )Here:
4.1% of AGIState:
4.2% of AGI
(% of AGI for various income ranges: 1.1% for AGIs below $10k , 0.8% for AGIs $10k-25k , 1.3% for AGIs $25k-50k , 1.8% for AGIs $50k-75k , 2.1% for AGIs $75k-100k , 2.4% for AGIs over 100k ) Total tax: $5,984 (reported on 75.0% of returns )(% of AGI for various income ranges: 5.6% for AGIs below $10k , 4.3% for AGIs $10k-25k , 6.4% for AGIs $25k-50k , 8.2% for AGIs $50k-75k , 10.3% for AGIs $75k-100k , 16.9% for AGIs over 100k ) Earned income credit: $1,777 (reported on 17.6% of returns )Percentage of individuals using paid preparers for their 2004 taxes: 59.8%(% for various income ranges: 50.3% for AGIs below $10k , 62.3% for AGIs $10k-25k , 60.0% for AGIs $25k-50k , 63.2% for AGIs $50k-75k , 60.9% for AGIs $75k-100k , 68.1% for AGIs over 100k )
Estimated median household income in 2022: This zip code:
$92,367Texas:
$72,284
Nearest zip codes: 76272 ,
76249 ,
76207 ,
76201 ,
76238 ,
76209 .
Denton Zip Code Map
Percentage of family households: This zip code:
52.4%Texas:
50.5%
Percentage of households with unmarried partners: This zip code:
4.6%Texas:
48.7%
Likely homosexual households (counted as self-reported same-sex unmarried-partner households)
Lesbian couples: 0.5% of all households Gay men: 0.0% of all households
Household received Food Stamps/SNAP in the past 12 months: 389Household did not receive Food Stamps/SNAP in the past 12 months: 6,775
Women who had a birth in the past 12 months: 144 (147 now married , 0 unmarried) Women who did not have a birth in the past 12 months: 4,137 (2,145 now married , 1,982 unmarried)
Housing units in zip code 76266 with a mortgage: 3,777 (103
second mortgage , 82
both second mortgage and home equity loan )
Houses without a mortgage: 30
Median monthly owner costs for units with a mortgage: $1,761
Median monthly owner costs for units without a mortgage: $687
Residents with income below the poverty level in 2022:
This zip code:
5.7%Whole state:
14.0%
Residents with income below 50% of the poverty level in 2022:
This zip code:
3.7%Whole state:
7.4%
Median number of rooms in houses and condos: Median number of rooms in apartments: Notable locations in this zip code not listed on our city pages
Click to draw/clear zip code borders Notable locations in zip code 76266: (A) , Sanger Volunteer Fire Department (B) . Display/hide their locations on the map
Churches in zip code 76266 include: (A) , Pilgrims Way Baptist Church (B) , Bolivar Church (C) , Gribble Springs Church (D) . Display/hide their locations on the map
Cemeteries: (1) , Duck Creek Cemetery (2) , Knox Cemetery (3) , Sanger Cemetery (4) , Gregory Cemetery (5) . Display/hide their locations on the map
Reservoirs: (A) , Soil Conservation Service Site 51 Reservoir (B) , Paddock Lake (C) , Lane Lake (D) , Soil Conservation Service Site 55b Reservoir (E) , Soil Conservation Service Site 50 Reservoir (F) , Soil Conservation Service Site 49 Reservoir (G) , Soil Conservation Service Site 40 Reservoir (H) . Display/hide their locations on the map
Streams, rivers, and creeks: (A) , Blocker Creek (B) , Willow Branch (C) , Isle du Bois Creek (D) , Cannon Creek (E) , Ranger Branch (F) , Moores Branch (G) , Mill Branch (H) , Grasshopper Creek (I) . Display/hide their locations on the map
Park in zip code 76266: (1) . Display/hide its location on the map
Year house built (houses)
88 2020 or later1,866 2010 to 20191,627 2000 to 20091,265 1990 to 19991,093 1980 to 1989816 1970 to 1979207 1960 to 1969231 1950 to 195930 1940 to 194953 1939 or earlier
Zip code 76266 household income distribution in 2022 112 Less than $10,00089 $10,000 to $14,999130 $15,000 to $19,99995 $20,000 to $24,99957 $25,000 to $29,999166 $30,000 to $34,999232 $35,000 to $39,999356 $40,000 to $44,999126 $45,000 to $49,999743 $50,000 to $59,999738 $60,000 to $74,9991,032 $75,000 to $99,999828 $100,000 to $124,999730 $125,000 to $149,999902 $150,000 to $199,999831 $200,000 or moreEstimate of home value of owner-occupied houses/condos in 2022 in zip code 76266 111 Less than $10,00016 $10,000 to $14,9999 $20,000 to $24,99958 $25,000 to $29,9998 $35,000 to $39,99913 $40,000 to $49,999191 $50,000 to $59,9999 $70,000 to $79,99918 $80,000 to $89,99932 $90,000 to $99,999117 $100,000 to $124,999194 $125,000 to $149,999138 $150,000 to $174,999231 $175,000 to $199,999613 $200,000 to $249,9991,002 $250,000 to $299,9991,558 $300,000 to $399,999855 $400,000 to $499,999452 $500,000 to $749,99980 $750,000 to $999,999124 $1,000,000 to $1,499,999281 $2,000,000 or moreRent paid by renters in 2022 in zip code 76266 47 $150 to $19919 $450 to $49911 $550 to $59972 $600 to $64931 $700 to $74920 $750 to $799128 $800 to $899114 $900 to $999258 $1,000 to $1,249149 $1,250 to $1,499183 $1,500 to $1,99930 $2,000 to $2,499200 No cash rent
Median gross rent in 2022: $1,276.
Estimated median house (or condo) value in 2022 for: White Non-Hispanic householders: $361,428Black or African American householders: $223,815American Indian or Alaska Native householders: $229,226Asian householders: $628,151Some other race householders: $266,336Two or more races householders: $326,252Hispanic or Latino householders: $267,882Estimated median house or condo value in 2022: $337,076
76266:
$337,076Texas:
$275,400
Lower value quartile - upper value quartile: $237,306 - $452,965
Mean price in 2022: Detached houses: $183,622Here:
$183,622State:
$369,058
Mobile homes: $52,694Here:
$52,694State:
$124,413
Housing units in structures:
One, detached: 5,632One, attached: 222Two: 1233 or 4: 675 to 9: 13010 to 19: 18020 to 49: 1250 or more: 56Mobile homes: 861Unemployment : 1.7%
Means of transportation to work in zip code 76266 79.3% 8,570 Drove a car alone5.6% 607 Carpooled0.2% 17 Streetcar or trolley car0.2% 24 Subway or elevated0.8% 84 Walked0.7% 81 Other means11.7% 1,263 Worked at homeTravel time to work (commute) in zip code 76266 133 Less than 5 minutes422 5 to 9 minutes793 10 to 14 minutes1,360 15 to 19 minutes1,529 20 to 24 minutes629 25 to 29 minutes1,702 30 to 34 minutes140 35 to 39 minutes307 40 to 44 minutes1,123 45 to 59 minutes1,087 60 to 89 minutes230 90 or more minutes
Percentage of zip code residents living and working in this county: 77.6%
Household type by relationship:
Households: 19,044
Male householders: 3,947 (766 living alone ), Female householders: 3,236 (639 living alone )4,148 spouses (4,090 opposite-sex spouses ), 598 unmarried partners , (563 opposite-sex unmarried partners ), 5,256 children (4,746 natural , 187 adopted , 324 stepchildren ), 495 grandchildren , 102 brothers or sisters , 363 parents , 0 foster children , 169 other relatives , 729 non-relatives In group quarters: 22 (-1 institutionalized population )
Size of family households: 2,057 2-persons , 1,382 3-persons , 978 4-persons , 423 5-persons , 235 6-persons , 51 7-or-more-persons
Size of nonfamily households: 1,405 1-person , 464 2-persons , 178 3-persons
3,061 married couples with children. single-parent households (247 men , 322 women ).
85.0% of residents of 76266 zip code speak English at home. of residents speak Spanish at home (63% very well, 19% well, 9% not well, 9% not at all ).of residents speak other Indo-European language at home (87% very well, 13% well ).of residents speak Asian or Pacific Island language at home (70% very well, 30% well ).of residents speak other language at home (100% very well ).
Foreign born population: 1,550 (8.1%)
(33.2%
of them are naturalized citizens )
This zip code:
8.1%Whole state:
17.2%
41% Honduras 27% Nicaragua 10% Bhutan 4% Sweden 4% United Kingdom, excluding England and Scotland 3% Taiwan 2% Uganda 14% American 13% English 9% Irish 9% German 3% European 3% African 1% Czech
Year of entry for the foreign-born population
122 2010 or later 733 2000 to 2009 593 1990 to 1999 202 Before 1990
Facilities with environmental interests located in this zip code:
AMPCO SOUTHWEST (201 RAILROAD AVE in SANGER, TX)
(Resource Conservation and Recovery Act (tracking hazardous waste)) Business NAICS classification: METAL STAMPING.Alternative names: TANSEY CO THE#
Housing units lacking complete plumbing facilities: 0.8%
Housing units lacking complete kitchen facilities: 1.5%
73.3% Electricity 15.4% Utility gas 8.8% Bottled, tank, or LP gas 1.2% No fuel used 1.1% Wood
Population in 1990: 7,440. Population change in the 1990s: +2,913 (+39.2%).
Place of birth for U.S.-born residents:
This state: 11,940Northeast: 618Midwest: 1,885South: 1,349West: 1,498
52% of the 76266 zip code residents lived in the same house 5 years ago.
Out of people who lived in different houses, 65% lived in this county.
Out of people who lived in different counties, 50% lived in Texas.
90% of the 76266 zip code residents lived in the same house 1 year ago.
Out of people who lived in different houses, 52% moved from this county.
Out of people who lived in different houses, 31% moved from different county within same state.
Out of people who lived in different houses, 17% moved from different state.
Private vs. public school enrollment:
Students in private schools in grades 1 to 8 (elementary and middle school): 151
Students in private schools in grades 9 to 12 (high school): 9
Students in private undergraduate colleges: 116
Occupation by median earnings in the past 12 months ($)
119,824 Computer and mathematical occupations 85,555 Architecture and engineering occupations 81,859 Management occupations 69,040 Life, physical, and social science occupations 63,597 Business and financial operations occupations 62,048 Installation, maintenance, and repair occupations
Companies with federal contracts located in this zip code (SANGER, TX):
S & S TELEMETRY (800 WILLOW ST; small business)
$35,915 with Army for Water Purification Equipment. Signed on 2006-03-31. Completion date: 2006-05-31.
EMILY A WILLIAMSON (12721 MALLARD RD; small business) in 11 contracts from 2004 to 2006
Contracts for Technical Assistance by ArmySigned by year: 2000: $0; 2001: $0; 2002: $0; 2003: $0; 2004: $10,488; 2005: $16,424; 2006: $6,560.
Biggest contracts: with Army for Technical Assistance. Taking place in MS. Signed on 2004-06-15. Completion date: 2004-09-30.
, same as above. Signed on 2005-12-22. Completion date: 2006-09-30.
, same as above. Signed on 2005-10-27. Completion date: 2006-09-30.
, same as above. Signed on 2006-06-30. Completion date: 2006-09-30.
DICK R. MORROW (12745 HENDERSON LANE; small business) in 2 contracts in 2000
$18,685 with U.S. Army Corps of Engineers - civil program financing only for Maintenance, Repair or Alteration of Real Property -- Miscellaneous Buildings. Signed on 2000-04-11. Completion date: 2000-01-31.
, same as above. Signed on 2000-05-04. Completion date: 2000-01-31.
KELLY COMPUTER RESOURCES (2920 UNION HILL RD; small business)
$12,150 with Navy for Aircraft Maintenance and Repair Shop Specialized Equipment. Signed on 2006-04-20. Completion date: 2006-07-19.
R&T ELECTRICAL CONTRACTORS (217 ELM ST; small business)
$4,500 with Army for Installation of Equipment -- Miscellaneous. Signed on 2006-02-03. Completion date: 2006-03-15.
JESSICA L LITTLE (9358 CLEAR DR; small business) in 6 contracts from 2001 to 2002
Contracts for Technical Assistance by U.S. Army Corps of Engineers - civil program financing onlySigned by year: 2000: $0; 2001: $962; 2002: $2,708; 2003: $0; 2004: $0; 2005: $0; 2006: $0.
Biggest contracts: with U.S. Army Corps of Engineers - civil program financing only for Technical Assistance. Signed on 2002-06-18. Completion date: 2002-09-30.
, same as above. Signed on 2002-04-04. Completion date: 2002-04-04.
with U.S. Army Corps of Engineers - civil program financing only for Technical Assistance. Taking place in MS. Signed on 2001-10-09. Completion date: 2002-09-30.
with U.S. Army Corps of Engineers - civil program financing only for Technical Assistance. Signed on 2002-01-28. Completion date: 2002-09-30.
GREEN SPRINGS WATER SUPPLY COR (116 S 7TH ST; small business)
$2,815 with Army for Water Services. Signed on 2006-03-31. Completion date: 2016-02-27.
Top industries in this zip code by the number of employees in 2005:
Accommodation and Food Services: Limited-Service Restaurants (20-49 employees: 4 establishments, 10-19 employees: 2 establishments, 5-9 employees: 1 establishment)Accommodation and Food Services: Full-Service Restaurants (20-49: 2, 10-19: 1, 1-4: 2)Health Care and Social Assistance: Nursing Care Facilities (50-99: 1)Wholesale Trade: Flower, Nursery Stock, and Florists' Supplies Merchant Wholesalers (50-99: 1)Finance and Insurance: Commercial Banking (20-49: 1, 10-19: 2)Health Care and Social Assistance: Child Day Care Services (10-19: 3)Other Services (except Public Administration): General Automotive Repair (20-49: 1, 1-4: 2)
People in group quarters in 2010:
6 people in group homes intended for adults
People in group quarters in 2000:
66 people in nursing homes
6 people in homes for the physically handicapped
Fatal accident statistics in 2014:
Fatal accident count: 5Vehicles involved in fatal accidents: 6Fatal accidents caused by drunken drivers: 3Fatalities: 7Persons involved in fatal accidents: 15Pedestrians involved in fatal accidents: 0
Fatal accident statistics in 2013:
Fatal accident count: 4Vehicles involved in fatal accidents: 5Fatal accidents caused by drunken drivers: 3Fatalities: 4Persons involved in fatal accidents: 8Pedestrians involved in fatal accidents: 0
Home Mortgage Disclosure Act Aggregated Statistics For Year 2009(Based on 12 partial tracts) A) FHA, FSA/RHS & VA B) Conventional C) Refinancings D) Home Improvement Loans E) Loans on Dwellings For 5+ Families F) Non-occupant Loans on G) Loans On Manufactured Number Average Value Number Average Value Number Average Value Number Average Value Number Average Value Number Average Value Number Average Value
LOANS ORIGINATED 150 $129,123 141 $140,253 323 $155,179 17 $33,687 1 $457,930 66 $105,458 16 $52,086 APPLICATIONS APPROVED, NOT ACCEPTED 4 $168,018 9 $114,686 47 $159,297 6 $24,290 0 $0 6 $74,432 4 $46,995 APPLICATIONS DENIED 22 $111,874 24 $91,082 152 $155,218 24 $36,438 1 $12,733,630 17 $111,236 15 $48,887 APPLICATIONS WITHDRAWN 10 $139,608 9 $132,727 89 $148,905 2 $51,365 0 $0 5 $100,394 1 $71,520 FILES CLOSED FOR INCOMPLETENESS 1 $153,090 5 $86,538 23 $113,155 4 $42,345 0 $0 1 $30,420 2 $59,870
Aggregated Statistics For Year 2008(Based on 12 partial tracts) A) FHA, FSA/RHS & VA B) Conventional C) Refinancings D) Home Improvement Loans E) Loans on Dwellings For 5+ Families F) Non-occupant Loans on G) Loans On Manufactured Number Average Value Number Average Value Number Average Value Number Average Value Number Average Value Number Average Value Number Average Value
LOANS ORIGINATED 181 $132,429 236 $135,085 185 $145,663 35 $46,440 1 $7,100,340 92 $106,000 24 $64,660 APPLICATIONS APPROVED, NOT ACCEPTED 14 $122,179 28 $140,362 28 $119,546 8 $65,934 0 $0 5 $123,950 9 $74,022 APPLICATIONS DENIED 28 $139,750 39 $129,806 137 $125,972 50 $46,444 0 $0 11 $97,870 26 $61,773 APPLICATIONS WITHDRAWN 19 $142,027 26 $106,375 97 $139,255 10 $41,970 0 $0 14 $106,982 3 $72,867 FILES CLOSED FOR INCOMPLETENESS 5 $133,370 3 $163,773 16 $123,049 5 $41,724 0 $0 1 $54,870 2 $86,780
Aggregated Statistics For Year 2007(Based on 12 partial tracts) A) FHA, FSA/RHS & VA B) Conventional C) Refinancings D) Home Improvement Loans E) Loans on Dwellings For 5+ Families F) Non-occupant Loans on G) Loans On Manufactured Number Average Value Number Average Value Number Average Value Number Average Value Number Average Value Number Average Value Number Average Value
LOANS ORIGINATED 127 $132,252 483 $118,782 242 $138,995 50 $43,328 1 $4,478,620 115 $92,208 24 $66,045 APPLICATIONS APPROVED, NOT ACCEPTED 9 $116,509 62 $131,389 49 $147,541 11 $44,509 0 $0 8 $119,445 11 $63,801 APPLICATIONS DENIED 25 $128,199 153 $129,788 266 $123,985 68 $46,702 0 $0 43 $108,333 39 $68,190 APPLICATIONS WITHDRAWN 18 $118,189 45 $122,075 122 $135,332 7 $77,981 1 $1,319,000 10 $89,719 5 $104,266 FILES CLOSED FOR INCOMPLETENESS 5 $184,118 25 $131,042 38 $135,301 4 $63,832 0 $0 1 $61,520 1 $80,370
Aggregated Statistics For Year 2006(Based on 12 partial tracts) A) FHA, FSA/RHS & VA B) Conventional C) Refinancings D) Home Improvement Loans E) Loans on Dwellings For 5+ Families F) Non-occupant Loans on G) Loans On Manufactured Number Average Value Number Average Value Number Average Value Number Average Value Number Average Value Number Average Value Number Average Value
LOANS ORIGINATED 126 $120,294 870 $95,882 236 $139,394 73 $35,522 2 $869,195 213 $86,845 24 $73,065 APPLICATIONS APPROVED, NOT ACCEPTED 4 $122,955 89 $98,970 48 $120,622 10 $34,369 0 $0 17 $92,676 9 $49,249 APPLICATIONS DENIED 23 $129,092 201 $95,895 246 $115,518 68 $40,791 0 $0 62 $77,475 28 $57,911 APPLICATIONS WITHDRAWN 23 $121,434 109 $118,089 169 $130,998 7 $65,119 0 $0 40 $67,647 3 $60,170 FILES CLOSED FOR INCOMPLETENESS 1 $50,650 27 $142,560 77 $145,058 2 $60,405 0 $0 4 $143,252 0 $0
Aggregated Statistics For Year 2005(Based on 12 partial tracts) A) FHA, FSA/RHS & VA B) Conventional C) Refinancings D) Home Improvement Loans E) Loans on Dwellings For 5+ Families F) Non-occupant Loans on G) Loans On Manufactured Number Average Value Number Average Value Number Average Value Number Average Value Number Average Value Number Average Value Number Average Value
LOANS ORIGINATED 122 $117,712 746 $90,737 324 $126,186 57 $46,866 1 $304,380 169 $82,656 46 $67,788 APPLICATIONS APPROVED, NOT ACCEPTED 4 $82,718 72 $87,420 44 $132,614 11 $50,166 0 $0 5 $77,500 15 $55,535 APPLICATIONS DENIED 27 $115,271 159 $79,403 318 $111,052 61 $44,615 0 $0 41 $73,550 37 $58,835 APPLICATIONS WITHDRAWN 13 $121,230 92 $110,024 161 $132,098 24 $214,265 0 $0 13 $126,185 9 $75,239 FILES CLOSED FOR INCOMPLETENESS 1 $146,710 17 $105,326 104 $146,311 2 $26,735 1 $939,660 4 $83,510 1 $62,430
Aggregated Statistics For Year 2004(Based on 12 partial tracts) A) FHA, FSA/RHS & VA B) Conventional C) Refinancings D) Home Improvement Loans E) Loans on Dwellings For 5+ Families F) Non-occupant Loans on G) Loans On Manufactured Number Average Value Number Average Value Number Average Value Number Average Value Number Average Value Number Average Value Number Average Value
LOANS ORIGINATED 189 $110,249 518 $100,447 459 $117,525 61 $35,510 1 $33,860 145 $76,832 34 $66,489 APPLICATIONS APPROVED, NOT ACCEPTED 7 $101,797 55 $111,152 60 $109,745 7 $38,903 0 $0 11 $91,144 8 $56,502 APPLICATIONS DENIED 35 $114,039 125 $75,616 307 $103,819 59 $36,438 0 $0 22 $99,015 60 $59,343 APPLICATIONS WITHDRAWN 33 $116,901 45 $100,400 158 $122,941 7 $60,817 0 $0 19 $86,529 9 $59,450 FILES CLOSED FOR INCOMPLETENESS 2 $83,155 18 $106,757 126 $128,198 5 $51,336 0 $0 4 $107,032 0 $0
Aggregated Statistics For Year 2003(Based on 12 partial tracts) A) FHA, FSA/RHS & VA B) Conventional C) Refinancings D) Home Improvement Loans E) Loans on Dwellings For 5+ Families F) Non-occupant Loans on Number Average Value Number Average Value Number Average Value Number Average Value Number Average Value Number Average Value
LOANS ORIGINATED 153 $114,683 383 $97,778 858 $116,505 79 $28,702 1 $307,590 117 $79,270 APPLICATIONS APPROVED, NOT ACCEPTED 1 $111,370 48 $86,402 91 $104,227 16 $44,083 0 $0 11 $77,745 APPLICATIONS DENIED 16 $105,641 112 $81,057 384 $111,304 52 $26,142 0 $0 31 $80,049 APPLICATIONS WITHDRAWN 15 $122,777 36 $104,356 187 $117,474 7 $38,413 1 $202,770 11 $100,205 FILES CLOSED FOR INCOMPLETENESS 1 $84,910 12 $93,218 26 $124,246 1 $52,200 0 $0 5 $62,028
Aggregated Statistics For Year 2002(Based on 6 partial tracts) A) FHA, FSA/RHS & VA B) Conventional C) Refinancings D) Home Improvement Loans E) Loans on Dwellings For 5+ Families F) Non-occupant Loans on Number Average Value Number Average Value Number Average Value Number Average Value Number Average Value Number Average Value
LOANS ORIGINATED 53 $108,984 98 $93,706 128 $97,279 10 $17,332 1 $2,763,500 29 $90,864 APPLICATIONS APPROVED, NOT ACCEPTED 2 $68,095 18 $68,551 11 $75,068 2 $28,130 0 $0 4 $54,972 APPLICATIONS DENIED 3 $115,940 32 $79,768 46 $101,560 9 $22,504 0 $0 3 $108,817 APPLICATIONS WITHDRAWN 7 $106,831 12 $100,085 29 $95,927 3 $14,037 0 $0 1 $172,170 FILES CLOSED FOR INCOMPLETENESS 1 $66,210 4 $66,412 11 $137,855 0 $0 0 $0 0 $0
Aggregated Statistics For Year 2001(Based on 6 partial tracts) A) FHA, FSA/RHS & VA B) Conventional C) Refinancings D) Home Improvement Loans F) Non-occupant Loans on Number Average Value Number Average Value Number Average Value Number Average Value Number Average Value
LOANS ORIGINATED 46 $102,199 74 $84,871 82 $91,239 12 $21,156 14 $85,627 APPLICATIONS APPROVED, NOT ACCEPTED 1 $93,280 19 $60,056 12 $68,449 3 $21,900 0 $0 APPLICATIONS DENIED 4 $101,360 45 $48,481 27 $102,803 8 $10,482 2 $110,740 APPLICATIONS WITHDRAWN 5 $92,720 5 $77,764 22 $89,214 3 $45,537 2 $130,820 FILES CLOSED FOR INCOMPLETENESS 0 $0 1 $90,020 7 $94,266 0 $0 1 $42,050
Aggregated Statistics For Year 2000(Based on 6 partial tracts) A) FHA, FSA/RHS & VA B) Conventional C) Refinancings D) Home Improvement Loans F) Non-occupant Loans on Number Average Value Number Average Value Number Average Value Number Average Value Number Average Value
LOANS ORIGINATED 50 $81,973 72 $75,996 20 $74,598 11 $24,903 12 $72,757 APPLICATIONS APPROVED, NOT ACCEPTED 4 $44,185 21 $51,613 4 $75,890 2 $19,305 3 $63,043 APPLICATIONS DENIED 7 $85,116 88 $41,945 12 $113,296 7 $13,381 6 $41,402 APPLICATIONS WITHDRAWN 3 $113,010 7 $98,231 5 $107,972 0 $0 3 $78,520 FILES CLOSED FOR INCOMPLETENESS 0 $0 2 $76,345 5 $74,602 0 $0 1 $35,820
Aggregated Statistics For Year 1999(Based on 5 partial tracts) A) FHA, FSA/RHS & VA B) Conventional C) Refinancings D) Home Improvement Loans F) Non-occupant Loans on Number Average Value Number Average Value Number Average Value Number Average Value Number Average Value
LOANS ORIGINATED 53 $83,493 179 $83,725 109 $90,161 32 $21,952 26 $61,180 APPLICATIONS APPROVED, NOT ACCEPTED 1 $136,620 60 $65,046 29 $71,197 8 $19,931 3 $65,033 APPLICATIONS DENIED 9 $80,837 137 $52,239 49 $83,605 26 $15,873 9 $71,066 APPLICATIONS WITHDRAWN 5 $78,608 24 $88,218 37 $84,970 4 $18,450 1 $105,750 FILES CLOSED FOR INCOMPLETENESS 2 $64,385 5 $116,262 15 $97,132 1 $24,250 0 $0
Private Mortgage Insurance Companies Aggregated Statistics For Year 2009(Based on 12 partial tracts) A) Conventional B) Refinancings D) Loans On Manufactured Number Average Value Number Average Value Number Average Value
LOANS ORIGINATED 25 $175,908 16 $193,289 1 $44,510 APPLICATIONS APPROVED, NOT ACCEPTED 4 $130,202 5 $147,590 0 $0 APPLICATIONS DENIED 2 $146,995 6 $269,890 0 $0 APPLICATIONS WITHDRAWN 3 $183,433 3 $154,003 0 $0 FILES CLOSED FOR INCOMPLETENESS 1 $77,870 0 $0 0 $0
Aggregated Statistics For Year 2008(Based on 12 partial tracts) A) Conventional B) Refinancings C) Non-occupant Loans on Number Average Value Number Average Value Number Average Value
LOANS ORIGINATED 90 $154,010 16 $180,282 18 $104,743 APPLICATIONS APPROVED, NOT ACCEPTED 45 $192,022 10 $192,908 4 $78,968 APPLICATIONS DENIED 5 $170,044 0 $0 3 $89,317 APPLICATIONS WITHDRAWN 9 $188,266 1 $80,720 1 $340,010 FILES CLOSED FOR INCOMPLETENESS 2 $168,685 0 $0 1 $206,480
Aggregated Statistics For Year 2007(Based on 12 partial tracts) A) Conventional B) Refinancings C) Non-occupant Loans on D) Loans On Manufactured Number Average Value Number Average Value Number Average Value Number Average Value
LOANS ORIGINATED 146 $130,283 18 $158,249 15 $99,887 2 $64,455 APPLICATIONS APPROVED, NOT ACCEPTED 26 $138,610 6 $149,542 1 $61,350 1 $30,150 APPLICATIONS DENIED 6 $166,342 0 $0 0 $0 0 $0 APPLICATIONS WITHDRAWN 9 $121,544 2 $277,920 2 $66,520 0 $0 FILES CLOSED FOR INCOMPLETENESS 1 $90,580 1 $92,860 0 $0 0 $0
Aggregated Statistics For Year 2006(Based on 12 partial tracts) A) Conventional B) Refinancings C) Non-occupant Loans on D) Loans On Manufactured Number Average Value Number Average Value Number Average Value Number Average Value
LOANS ORIGINATED 70 $121,059 10 $135,143 15 $88,077 3 $51,677 APPLICATIONS APPROVED, NOT ACCEPTED 14 $138,032 1 $305,790 1 $110,580 1 $61,820 APPLICATIONS DENIED 0 $0 0 $0 0 $0 0 $0 APPLICATIONS WITHDRAWN 4 $124,132 3 $193,313 1 $101,810 0 $0 FILES CLOSED FOR INCOMPLETENESS 0 $0 0 $0 0 $0 0 $0
Aggregated Statistics For Year 2005(Based on 12 partial tracts) A) Conventional B) Refinancings C) Non-occupant Loans on D) Loans On Manufactured Number Average Value Number Average Value Number Average Value Number Average Value
LOANS ORIGINATED 69 $124,507 13 $141,995 13 $85,711 2 $48,755 APPLICATIONS APPROVED, NOT ACCEPTED 15 $142,156 4 $157,835 7 $84,773 0 $0 APPLICATIONS DENIED 1 $54,060 0 $0 0 $0 0 $0 APPLICATIONS WITHDRAWN 3 $118,067 2 $145,940 0 $0 0 $0 FILES CLOSED FOR INCOMPLETENESS 2 $74,845 0 $0 0 $0 0 $0
Aggregated Statistics For Year 2004(Based on 12 partial tracts) A) Conventional B) Refinancings C) Non-occupant Loans on D) Loans On Manufactured Number Average Value Number Average Value Number Average Value Number Average Value
LOANS ORIGINATED 80 $123,963 35 $137,334 19 $95,390 1 $21,310 APPLICATIONS APPROVED, NOT ACCEPTED 7 $150,886 18 $130,622 5 $103,114 1 $38,650 APPLICATIONS DENIED 1 $128,440 0 $0 0 $0 1 $58,740 APPLICATIONS WITHDRAWN 6 $112,958 2 $76,120 4 $100,118 0 $0 FILES CLOSED FOR INCOMPLETENESS 1 $112,650 2 $140,625 0 $0 0 $0
Aggregated Statistics For Year 2003(Based on 12 partial tracts) A) Conventional B) Refinancings C) Non-occupant Loans on Number Average Value Number Average Value Number Average Value
LOANS ORIGINATED 91 $117,780 68 $141,938 24 $92,475 APPLICATIONS APPROVED, NOT ACCEPTED 14 $100,341 21 $138,007 7 $83,150 APPLICATIONS DENIED 3 $80,387 1 $112,280 3 $78,763 APPLICATIONS WITHDRAWN 3 $73,937 4 $148,008 3 $66,023 FILES CLOSED FOR INCOMPLETENESS 0 $0 0 $0 0 $0
Aggregated Statistics For Year 2002(Based on 6 partial tracts) A) Conventional B) Refinancings C) Non-occupant Loans on Number Average Value Number Average Value Number Average Value
LOANS ORIGINATED 26 $116,863 9 $104,931 3 $112,180 APPLICATIONS APPROVED, NOT ACCEPTED 3 $116,713 2 $136,370 0 $0 APPLICATIONS DENIED 1 $162,210 0 $0 0 $0 APPLICATIONS WITHDRAWN 0 $0 2 $66,480 0 $0 FILES CLOSED FOR INCOMPLETENESS 0 $0 1 $69,190 1 $67,530
Aggregated Statistics For Year 2001(Based on 6 partial tracts) A) Conventional B) Refinancings C) Non-occupant Loans on Number Average Value Number Average Value Number Average Value
LOANS ORIGINATED 18 $96,472 4 $108,455 2 $89,440 APPLICATIONS APPROVED, NOT ACCEPTED 2 $73,160 1 $76,770 1 $59,420 APPLICATIONS DENIED 0 $0 1 $51,870 0 $0 APPLICATIONS WITHDRAWN 0 $0 0 $0 0 $0 FILES CLOSED FOR INCOMPLETENESS 1 $78,250 0 $0 0 $0
Aggregated Statistics For Year 2000(Based on 6 partial tracts) A) Conventional B) Refinancings C) Non-occupant Loans on Number Average Value Number Average Value Number Average Value
LOANS ORIGINATED 18 $91,455 4 $106,435 1 $88,090 APPLICATIONS APPROVED, NOT ACCEPTED 3 $97,727 0 $0 1 $40,630 APPLICATIONS DENIED 2 $80,355 0 $0 0 $0 APPLICATIONS WITHDRAWN 1 $52,550 0 $0 0 $0 FILES CLOSED FOR INCOMPLETENESS 1 $73,940 0 $0 0 $0
Aggregated Statistics For Year 1999(Based on 5 partial tracts) A) Conventional B) Refinancings C) Non-occupant Loans on Number Average Value Number Average Value Number Average Value
LOANS ORIGINATED 32 $100,378 11 $137,930 2 $70,645 APPLICATIONS APPROVED, NOT ACCEPTED 2 $135,815 2 $91,270 0 $0 APPLICATIONS DENIED 1 $108,050 2 $125,225 0 $0 APPLICATIONS WITHDRAWN 2 $129,405 0 $0 0 $0 FILES CLOSED FOR INCOMPLETENESS 1 $73,760 0 $0 0 $0
2002 - 2018 National Fire Incident Reporting System (NFIRS) incidents See full 2006 National Fire Incident Reporting System statistics for zip code 76266, Texas
Most common first names in zip code 76266 among deceased individuals Name Count Lived (average)
James 49 73.8 years William 36 73.9 years Mary 30 81.8 years John 28 74.4 years Robert 26 70.6 years Charles 21 69.6 years Ruby 17 82.5 years George 15 73.2 years Thomas 14 70.8 years Willie 14 82.3 years
Most common last names in zip code 76266 among deceased individuals Last name Count Lived (average)
Smith 22 73.5 years Jones 18 74.9 years Wilson 15 81.4 years Howard 14 65.7 years Lynch 13 71.0 years Johnson 13 77.0 years Davis 13 71.7 years Moore 12 74.0 years Cole 11 83.1 years Gentle 10 78.6 years
Businesses in zip code 76266
Name Count Name Count
Chevrolet 1 Pizza Hut 1 Circle K 1 RadioShack 1 FedEx 2 SONIC Drive-In 1 H&R Block 1 Subway 1 Jack In The Box 1 U-Haul 1 McDonald's 1 UPS 1

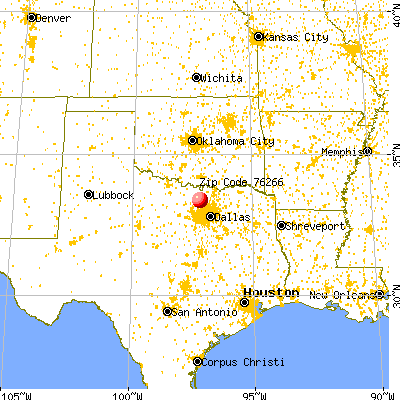


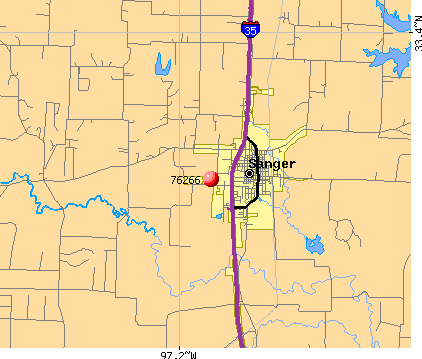 Nearest zip codes: 76272, 76249, 76207, 76201, 76238, 76209.
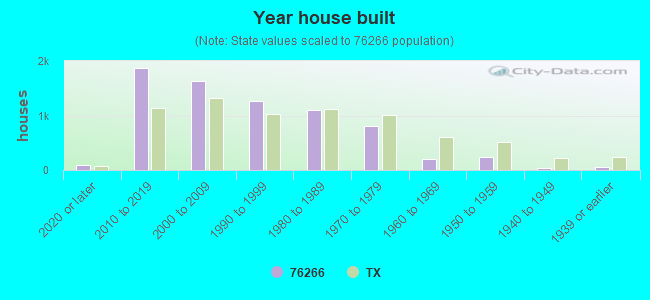

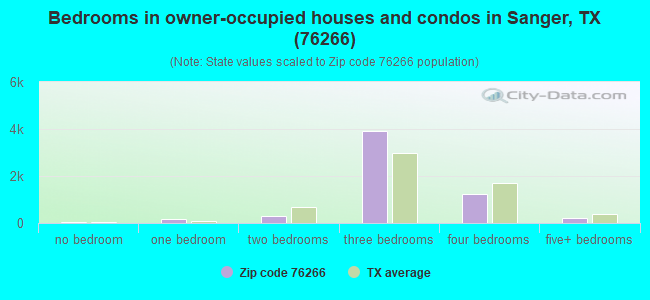
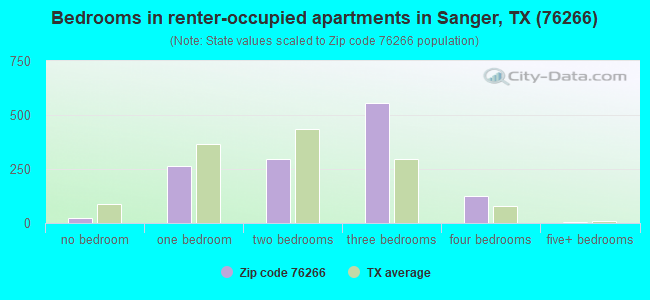
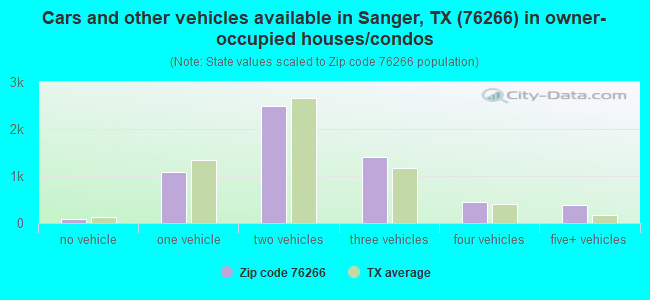
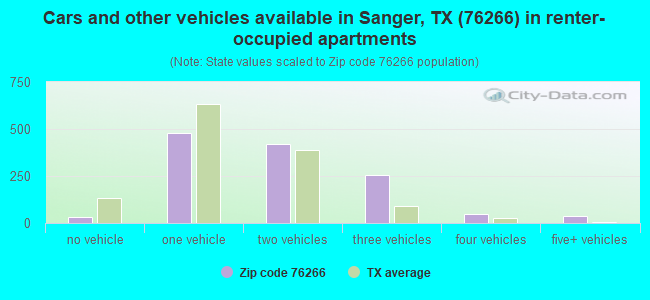


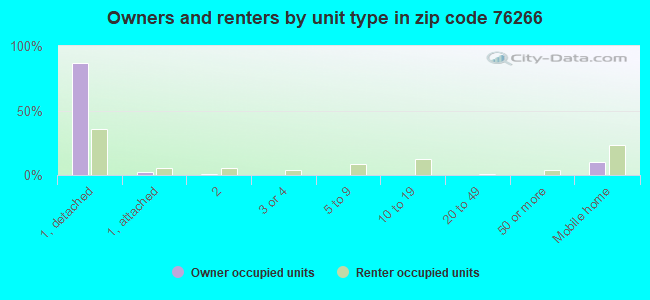
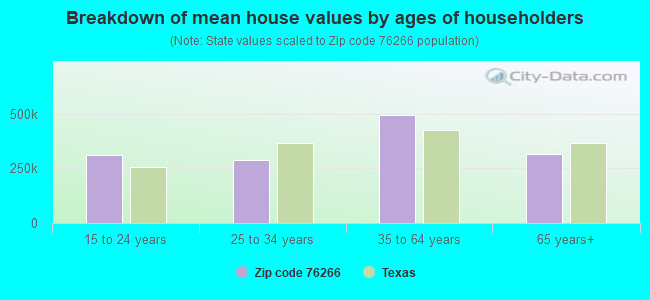


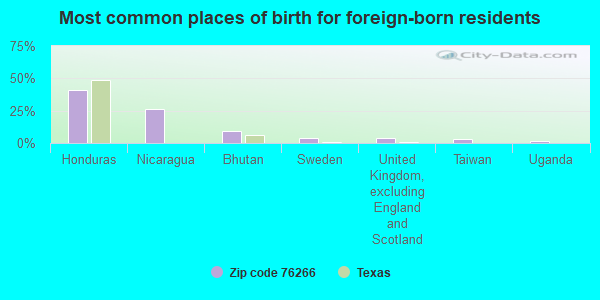
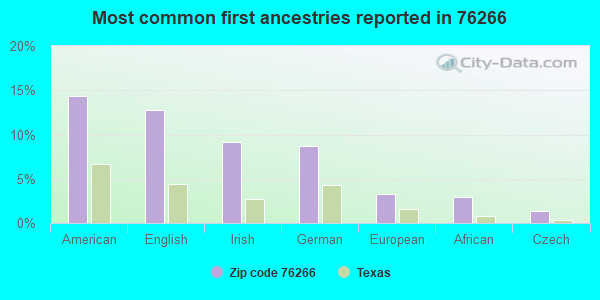
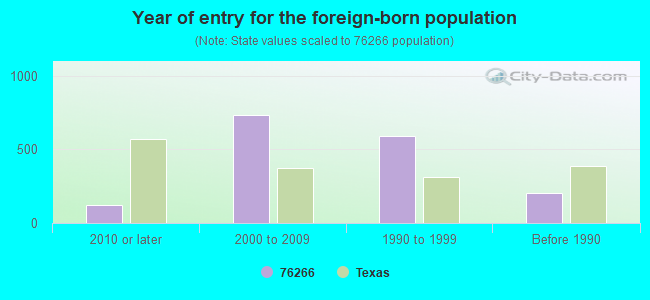


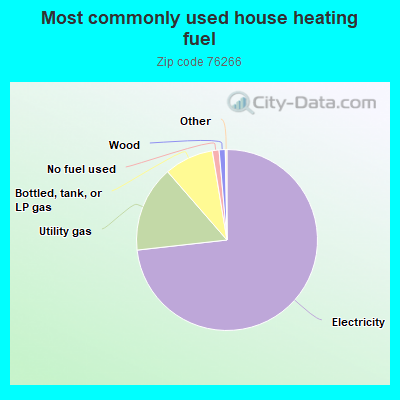
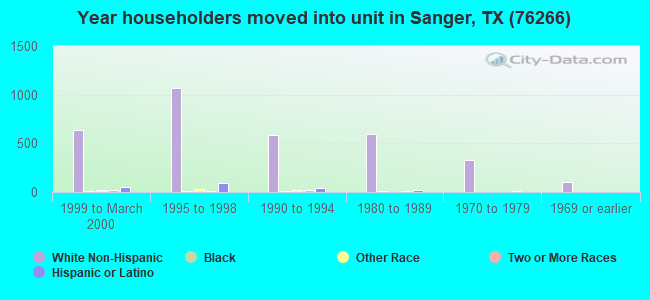
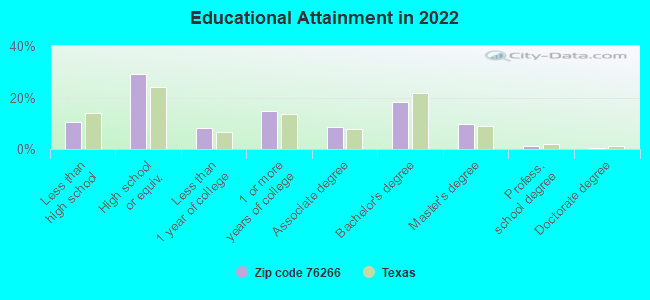
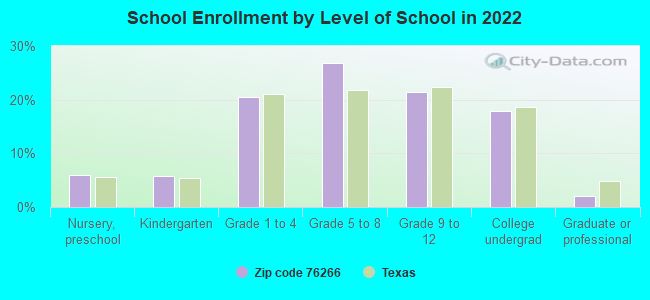
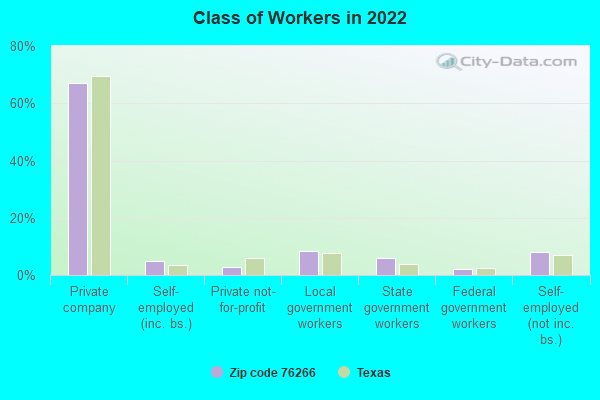
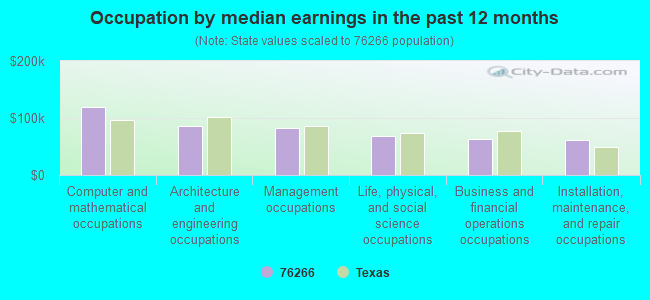
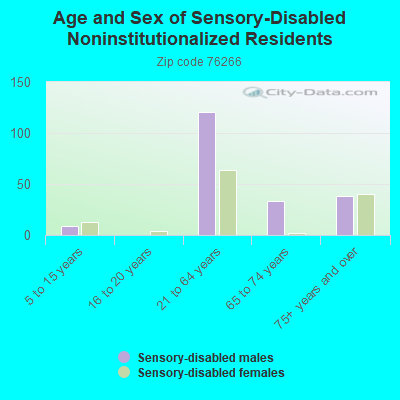
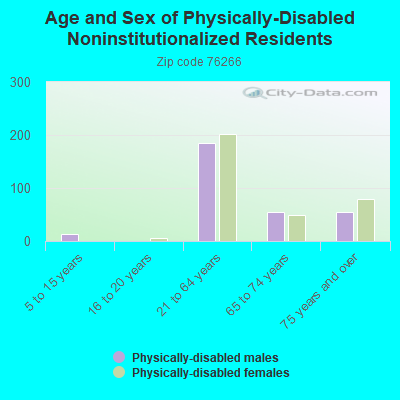
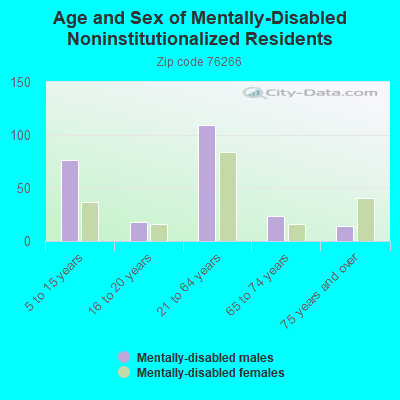
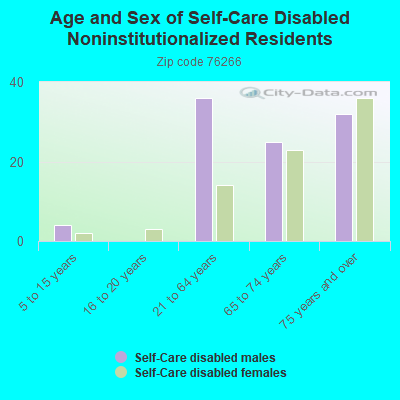

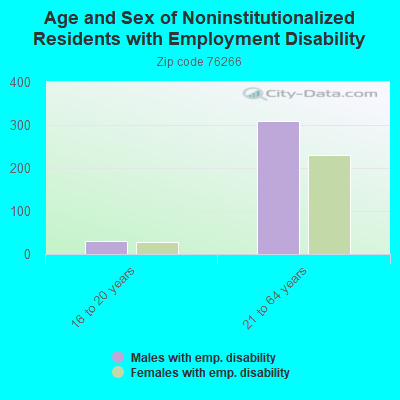
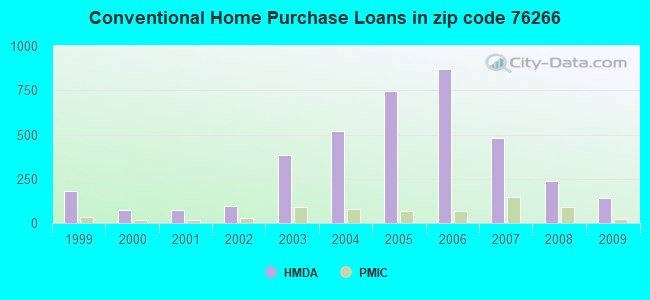
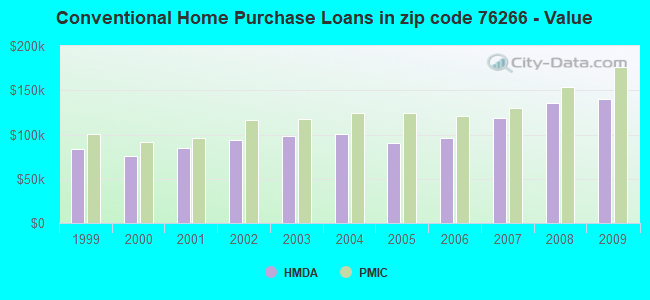
 According to the data from the years 2002 - 2018 the average number of fires per year is 117. The highest number of reported fire incidents - 176 took place in 2008, and the least - 53 in 2018. The data has a decreasing trend.
 When looking into fire subcategories, the most reports belonged to: Outside Fires (66.6%), and Structure Fires (20.7%).