Estimated zip code population in 2022: 2,013 Zip code population in 2010: 1,352 Zip code population in 2000: 1,102
Houses and condos: 776 Renter-occupied apartments: 148
% of renters here:
20%
State:
38%
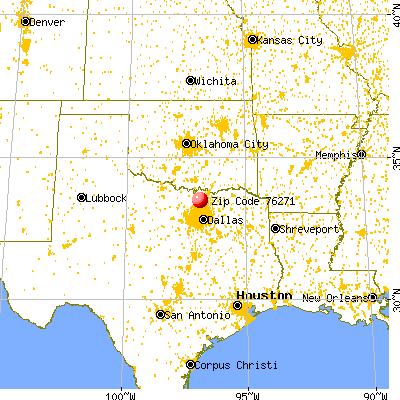
March 2022 cost of living index in zip code 76271: 83.2 (low, U.S. average is 100)
Land area: 39.5 sq. mi. Water area: 13.0 sq. mi.
Population density: 51 people per square mile
(very low).
OSM Map
General Map
Google Map
MSN Map
OSM Map
General Map
Google Map
MSN Map
OSM Map
General Map
Google Map
MSN Map
OSM Map
General Map
Google Map
MSN Map
Please wait while loading the map...
Real estate property taxes paid for housing units in 2022:
This zip code:
1.1% ($3,828)
Texas:
1.5% ($4,050)
Median real estate property taxes paid for housing units with mortgages in 2022: $4,260 (1.2%) Median real estate property taxes paid for housing units with no mortgage in 2022: $2,958 (0.8%)
Business Search- 14 Million verified businesses
Males: 1,057
(52.5%)
Females: 955
(47.5%)
For population 25 years and over in 76271:
High school or higher: 92.8%
Bachelor's degree or higher: 31.1%
Graduate or professional degree: 7.4%
Unemployed: 1.8%
Mean travel time to work (commute): 28.3 minutes
For population 15 years and over in 76271:
Never married: 26.5%
Now married: 57.7%
Separated: 0.5%
Widowed: 5.9%
Divorced: 9.4%
Zip code 76271 compared to state average:
Unemployed percentage below state average.
Black race population percentage significantly below state average.
Hispanic race population percentage significantly below state average.
Median age significantly above state average.
Foreign-born population percentage significantly below state average.
Renting percentage below state average.
Length of stay since moving in above state average.
Estimated median house/condo value in 2022: $356,400
76271:
$356,400
Texas:
$275,400
According to our research of Texas and other state lists, there was 1 registered sex offender living in 76271 zip code as of May 30, 2024. The ratio of all residents to sex offenders in zip code 76271 is 1,694 to 1. The ratio of registered sex offenders to all residents in this zip code is much lower than the state average.
Median resident age:
This zip code:
44.7 years
Texas median age:
35.6 years
Average household size:
This zip code:
2.7 people
Texas:
2.6 people
Averages for the 2020 tax year for zip code 76271, filed in 2021:
Average Adjusted Gross Income (AGI) in 2020: $78,210 (Individual Income Tax Returns)
Here:
$78,210
State:
$77,054
Salary/wage: $65,324 (reported on 79.8% of returns)
Here:
$65,324
State:
$62,766
(% of AGI for various income ranges: 1281.2% for AGIs below $25k, 3770.7% for AGIs $25k-50k, 6319.0% for AGIs $50k-75k, 8934.3% for AGIs $75k-100k, 16975.0% for AGIs $100k-200k)
Taxable interest for individuals: $1,012 (reported on 28.1% of returns)
This zip code:
$1,012
Texas:
$2,665
(% of AGI for various income ranges: 18.8% for AGIs below $25k, 6.0% for AGIs $25k-50k, 9.0% for AGIs $50k-75k, 25.7% for AGIs $75k-100k, 114.0% for AGIs $100k-200k)
Ordinary dividends: $3,883 (reported on 13.5% of returns)
Here:
$3,883
State:
$10,044
(% of AGI for various income ranges: 8.2% for AGIs below $25k, 28.0% for AGIs $50k-75k, 424.0% for AGIs $100k-200k)
Net capital gain/loss in AGI: +$23,614 (reported on 15.7% of returns)
Here:
+$23,614
State:
+$39,590
(% of AGI for various income ranges: 38.7% for AGIs $25k-50k, 431.4% for AGIs $75k-100k, 2946.0% for AGIs $100k-200k)
Profit/loss from business: +$8,200 (reported on 25.8% of returns)
Here:
+$8,200
State:
+$10,888
(% of AGI for various income ranges: 190.0% for AGIs below $25k, 284.7% for AGIs $25k-50k, 263.0% for AGIs $50k-75k, 621.4% for AGIs $75k-100k, 438.0% for AGIs $100k-200k)
Taxable individual retirement arrangement distribution: $14,438 (reported on 9.0% of returns)
76271:
$14,438
Texas:
$24,740
(% of AGI for various income ranges: 168.8% for AGIs below $25k, 278.0% for AGIs $50k-75k, 590.0% for AGIs $100k-200k)
Total itemized deductions: $31,289 (reported on 10.1% of returns)
Here:
$31,289
State:
$40,428
(% of AGI for various income ranges: 1001.0% for AGIs $50k-75k, 908.0% for AGIs $100k-200k)
Charity contributions: $6,025 (reported on 9.0% of returns)
Here:
$6,025
State:
$18,201
(% of AGI for various income ranges: 53.3% for AGIs $25k-50k, 402.0% for AGIs $100k-200k)
Taxes paid: $7,611 (reported on 10.1% of returns)
76271:
$7,611
State:
$7,821
(% of AGI for various income ranges: 269.0% for AGIs $50k-75k, 232.0% for AGIs $100k-200k)
Earned income credit: $2,375 (reported on 13.5% of returns)
Here:
$2,375
State:
$2,584
(% of AGI for various income ranges: 110.0% for AGIs below $25k, 65.3% for AGIs $25k-50k)
Percentage of individuals using paid preparers for their 2020 taxes: 92.1%
Here:
92%
State:
92%
(% for various income ranges: 88.9% for AGIs below $25k, 94.7% for AGIs $25k-50k, 92.3% for AGIs $50k-75k, 90.0% for AGIs $75k-100k, 93.8% for AGIs $100k-200k, 100.0% for AGIs over 200k)
Averages for the 2012 tax year for zip code 76271, filed in 2013:
Average Adjusted Gross Income (AGI) in 2012: $53,802 (Individual Income Tax Returns)
Here:
$53,802
State:
$65,384
Salary/wage: $50,000 (reported on 79.7% of returns)
Here:
$50,000
State:
$52,524
(% of AGI for various income ranges: 69.1% for AGIs below $25k, 86.6% for AGIs $25k-50k, 82.2% for AGIs $50k-75k, 75.3% for AGIs $75k-100k, 114.1% for AGIs $100k-200k)
Taxable interest for individuals: $1,061 (reported on 28.1% of returns)
This zip code:
$1,061
Texas:
$2,372
(% of AGI for various income ranges: 0.4% for AGIs below $25k, 0.6% for AGIs $25k-50k, 0.4% for AGIs $50k-75k, 0.3% for AGIs $75k-100k, 1.2% for AGIs $100k-200k)
Ordinary dividends: $2,162 (reported on 12.5% of returns)
Here:
$2,162
State:
$9,721
(% of AGI for various income ranges: 0.2% for AGIs below $25k, 1.5% for AGIs $50k-75k, 1.0% for AGIs $100k-200k)
Net capital gain/loss in AGI: +$4,100 (reported on 9.4% of returns)
Here:
+$4,100
State:
+$35,319
(% of AGI for various income ranges: 0.1% for AGIs below $25k, 3.1% for AGIs $100k-200k)
Profit/loss from business: +$5,353 (reported on 29.7% of returns)
Here:
+$5,353
State:
+$13,732
(% of AGI for various income ranges: 17.3% for AGIs below $25k, 3.4% for AGIs $25k-50k, 8.7% for AGIs $50k-75k)
Taxable individual retirement arrangement distribution: $14,825 (reported on 6.2% of returns)
76271:
$14,825
Texas:
$19,511
Total itemized deductions: $21,886 (24% of AGI, reported on 32.8% of returns)
Here:
$21,886
State:
$24,724
Here:
24.3% of AGI
State:
15.9% of AGI
(% of AGI for various income ranges: 10.9% for AGIs below $25k, 11.9% for AGIs $25k-50k, 10.6% for AGIs $50k-75k, 9.5% for AGIs $75k-100k, 29.3% for AGIs $100k-200k)
Charity contributions: $3,993 (reported on 21.9% of returns)
Here:
$3,993
State:
$6,808
(% of AGI for various income ranges: 2.0% for AGIs $25k-50k, 1.0% for AGIs $50k-75k, 1.1% for AGIs $75k-100k, 3.9% for AGIs $100k-200k)
Taxes paid: $4,800 (reported on 32.8% of returns)
76271:
$4,800
State:
$6,921
(% of AGI for various income ranges: 1.9% for AGIs below $25k, 2.4% for AGIs $25k-50k, 2.9% for AGIs $50k-75k, 2.5% for AGIs $75k-100k, 6.2% for AGIs $100k-200k)
Earned income credit: $2,015 (reported on 20.3% of returns)
Here:
$2,015
State:
$2,570
(% of AGI for various income ranges: 6.5% for AGIs below $25k, 1.1% for AGIs $25k-50k)
Percentage of individuals using paid preparers for their 2012 taxes: 57.8%
Here:
58%
State:
51%
(% for various income ranges: 58.3% for AGIs below $25k, 52.9% for AGIs $25k-50k, 55.6% for AGIs $50k-75k, 66.7% for AGIs $75k-100k, 83.3% for AGIs $100k-200k)
Averages for the 2004 tax year for zip code 76271, filed in 2005:
Average Adjusted Gross Income (AGI) in 2004: $50,272 (Individual Income Tax Returns)
Here:
$50,272
State:
$47,881
Salary/wage: $44,078 (reported on 83.1% of returns)
Here:
$44,078
State:
$41,947
(% of AGI for various income ranges: 84.1% for AGIs below $10k, 74.1% for AGIs $10k-25k, 86.7% for AGIs $25k-50k, 87.7% for AGIs $50k-75k, 85.8% for AGIs $75k-100k, 54.9% for AGIs over 100k)
Taxable interest for individuals: $2,995 (reported on 35.7% of returns)
This zip code:
$2,995
Texas:
$2,255
(% of AGI for various income ranges: 6.7% for AGIs below $10k, 2.2% for AGIs $10k-25k, 1.9% for AGIs $25k-50k, 0.8% for AGIs $50k-75k, 1.5% for AGIs $75k-100k, 2.8% for AGIs over 100k)
Taxable dividends: $950 (reported on 14.4% of returns)
Here:
$950
State:
$4,261
(% of AGI for various income ranges: 0.6% for AGIs $10k-25k, 0.3% for AGIs $25k-50k, 0.2% for AGIs $75k-100k, 0.3% for AGIs over 100k)
Net capital gain/loss: +$12,077 (reported on 14.1% of returns)
Here:
+$12,077
State:
+$16,110
(% of AGI for various income ranges: 9.3% for AGIs below $10k, 0.3% for AGIs $25k-50k, 0.7% for AGIs $50k-75k, 7.6% for AGIs over 100k)
Profit/loss from business: +$5,205 (reported on 22.0% of returns)
Here:
+$5,205
State:
+$11,013
(% of AGI for various income ranges: -5.7% for AGIs below $10k, 9.2% for AGIs $10k-25k, 0.9% for AGIs $25k-50k, 1.5% for AGIs $75k-100k, 2.9% for AGIs over 100k)
Total itemized deductions: $20,445 (24% of AGI, reported on 29.5% of returns)
Here:
$20,445
State:
$19,631
Here:
23.9% of AGI
State:
18.9% of AGI
(% of AGI for various income ranges: 15.7% for AGIs $10k-25k, 16.6% for AGIs $25k-50k, 9.8% for AGIs $50k-75k, 14.8% for AGIs $75k-100k, 9.5% for AGIs over 100k)
Charity contributions deductions: $4,041 (4% of AGI, reported on 22.0% of returns)
Here:
$4,041
State:
$4,753
Here:
4.3% of AGI
State:
4.2% of AGI
(% of AGI for various income ranges: 0.9% for AGIs $10k-25k, 1.3% for AGIs $25k-50k, 1.0% for AGIs $50k-75k, 2.5% for AGIs $75k-100k, 2.3% for AGIs over 100k)
Total tax: $7,962 (reported on 76.8% of returns)
76271:
$7,962
State:
$9,058
(% of AGI for various income ranges: 5.9% for AGIs below $10k, 4.4% for AGIs $10k-25k, 7.1% for AGIs $25k-50k, 9.2% for AGIs $50k-75k, 9.7% for AGIs $75k-100k, 18.5% for AGIs over 100k)
Earned income credit: $1,458 (reported on 17.3% of returns)
Here:
$1,458
State:
$2,024
Percentage of individuals using paid preparers for their 2004 taxes: 56.0%
Here:
56%
State:
57%
(% for various income ranges: 55.7% for AGIs below $10k, 52.1% for AGIs $10k-25k, 52.8% for AGIs $25k-50k, 59.7% for AGIs $50k-75k, 63.0% for AGIs $75k-100k, 66.7% for AGIs over 100k)
Likely homosexual households (counted as self-reported same-sex unmarried-partner households)
Lesbian couples: 1.0% of all households
Gay men: 0.0% of all households
Household received Food Stamps/SNAP in the past 12 months: 49 Household did not receive Food Stamps/SNAP in the past 12 months: 691
Women who had a birth in the past 12 months: 23 (24 now married, 0 unmarried) Women who did not have a birth in the past 12 months: 344 (157 now married, 186 unmarried)
Housing units in zip code 76271 with a mortgage: 366 (10 second mortgage) Median monthly owner costs for units with a mortgage: $1,848 Median monthly owner costs for units without a mortgage: $706
Residents with income below the poverty level in 2022:
This zip code:
8.5%
Whole state:
14.0%
Residents with income below 50% of the poverty level in 2022:
This zip code:
5.2%
Whole state:
7.4%
Median number of rooms in houses and condos:
Here:
5.8
State:
6.3
Median number of rooms in apartments:
Here:
5.6
State:
4.0
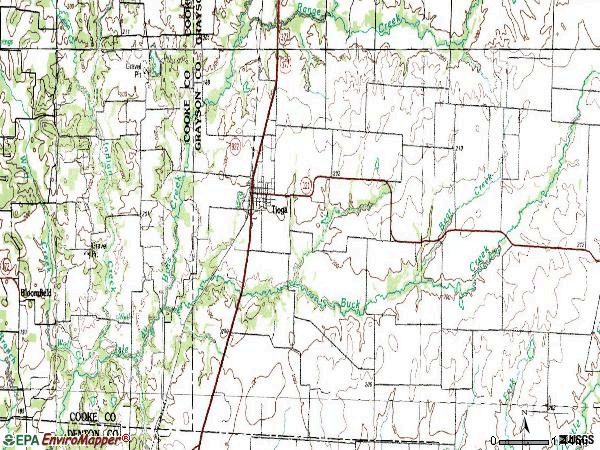
Notable locations in this zip code not listed on our city pages
Streams, rivers, and creeks: Wolf Creek (A), Indian Creek (B), Pierce Spring Branch (C), Lick Creek (D), Buck Creek (E). Display/hide their locations on the map
Size of family households: 252 2-persons, 101 3-persons, 129 4-persons, 59 5-persons, 11 6-persons
Size of nonfamily households: 139 1-person, 48 2-persons
319 married couples with children.
55 single-parent households (14 men, 41 women).
94.3% of residents of 76271 zip code speak English at home.
4.8% of residents speak Spanish at home (65% very well, 23% well, 7% not well, 5% not at all).
0.3% of residents speak other Indo-European language at home (100% very well).
0.5% of residents speak Asian or Pacific Island language at home (44% very well, 56% well).
Foreign born population: 117 (5.8%) (63.7% of them are naturalized citizens)
This zip code:
5.8%
Whole state:
17.2%
38%Taiwan
35%Honduras
10%Malaysia
7%Uruguay
5%Thailand
3%United Kingdom, excluding England and Scotland
2%Sweden
30%Irish
21%American
11%English
3%German
2%European
1%Dutch
1%Lebanese
Year of entry for the foreign-born population
62010 or later
262000 to 2009
141990 to 1999
59Before 1990
Housing units lacking complete plumbing facilities: 6.6% Housing units lacking complete kitchen facilities: 2.7%
65.9%Electricity
21.8%Utility gas
10.6%Bottled, tank, or LP gas
1.1%Solar energy
Population in 1990: 857. Population change in the 1990s: +245 (+28.6%).
Place of birth for U.S.-born residents:
This state: 1,293
Northeast: 42
Midwest: 106
South: 235
West: 222
49% of the 76271 zip code residents lived in the same house 5 years ago. Out of people who lived in different houses, 29% lived in this county. Out of people who lived in different counties, 50% lived in Texas.
85% of the 76271 zip code residents lived in the same house 1 year ago. Out of people who lived in different houses, 20% moved from this county. Out of people who lived in different houses, 63% moved from different county within same state. Out of people who lived in different houses, 17% moved from different state. Out of people who lived in different houses, 2% moved from abroad.
Private vs. public school enrollment:
Students in private schools in grades 1 to 8 (elementary and middle school): 16
Here:
8.8%
Texas:
8.8%
Students in private schools in grades 9 to 12 (high school):
Here:
0.0%
Texas:
8.0%
Students in private undergraduate colleges: 8
Here:
8.4%
Texas:
16.2%
Occupation by median earnings in the past 12 months ($)
95,918Business and financial operations occupations
81,281Health diagnosing and treating practitioners and other technical occupations
66,723Fire fighting and prevention, and other protective service workers including supervisors
58,335Transportation occupations
56,852Office and administrative support occupations
51,949Production occupations
Companies with federal contracts located in this zip code:
GUEST JANITORIAL (305 N PORCH ST in TIOGA, TX) : $28,360 in 9 contractsfrom 2003 to 2005
Contracts for Custodial Janitorial Services by U.S. Army Corps of Engineers - civil program financing only, Army Signed by year:2000: $0; 2001: $0; 2002: $0; 2003: $2,030; 2004: $8,850; 2005: $17,480; 2006: $0.
Biggest contracts:
$8,740 with U.S. Army Corps of Engineers - civil program financing only for Custodial Janitorial Services. Signed on 2005-02-17. Completion date: 2003-09-30.
$8,740 with Army for Custodial Janitorial Services. Signed on 2005-02-17. Completion date: 2003-09-30.
$4,830, same as above.Signed on 2004-01-21. Completion date: 2003-09-30.
$2,030, same as above.Signed on 2003-12-02. Completion date: 2003-09-30.
Top industries in this zip code by the number of employees in 2005:
Accommodation and Food Services: Cafeterias (20-49 employees: 1 establishment)
Accommodation and Food Services: Hotels (except Casino Hotels) and Motels (20-49: 1)
Accommodation and Food Services: Full-Service Restaurants (20-49: 1)
Wholesale Trade: Other Miscellaneous Nondurable Goods Merchant Wholesalers (1-4: 3)
Other Services (except Public Administration): Religious Organizations (1-4: 2)
Finance and Insurance: Insurance Agencies and Brokerages (1-4: 2)
Wholesale Trade: Metal Service Centers and Other Metal Merchant Wholesalers (1-4: 1)
Real Estate and Rental and Leasing: Lessors of Nonresidential Buildings (except Miniwarehouses) (1-4: 1)
Home Mortgage Disclosure Act Aggregated Statistics For Year 2009 (Based on 2 partial tracts)
A) FHA, FSA/RHS & VA Home Purchase Loans
B) Conventional Home Purchase Loans
C) Refinancings
D) Home Improvement Loans
F) Non-occupant Loans on < 5 Family Dwellings (A B C & D)
G) Loans On Manufactured Home Dwelling (A B C & D)
Number
Average Value
Number
Average Value
Number
Average Value
Number
Average Value
Number
Average Value
Number
Average Value
LOANS ORIGINATED
17
$135,800
10
$145,236
31
$154,390
3
$30,263
4
$96,050
3
$89,127
APPLICATIONS APPROVED, NOT ACCEPTED
1
$77,200
1
$112,290
3
$136,520
1
$37,130
0
$0
0
$0
APPLICATIONS DENIED
2
$91,920
2
$138,785
13
$161,981
2
$63,390
0
$0
1
$43,700
APPLICATIONS WITHDRAWN
2
$127,235
2
$204,780
9
$155,437
0
$0
0
$0
0
$0
FILES CLOSED FOR INCOMPLETENESS
0
$0
0
$0
2
$159,045
0
$0
0
$0
0
$0
Aggregated Statistics For Year 2008 (Based on 2 partial tracts)
A) FHA, FSA/RHS & VA Home Purchase Loans
B) Conventional Home Purchase Loans
C) Refinancings
D) Home Improvement Loans
F) Non-occupant Loans on < 5 Family Dwellings (A B C & D)
G) Loans On Manufactured Home Dwelling (A B C & D)
Number
Average Value
Number
Average Value
Number
Average Value
Number
Average Value
Number
Average Value
Number
Average Value
LOANS ORIGINATED
14
$130,811
21
$123,582
25
$164,303
5
$32,420
7
$75,456
2
$74,710
APPLICATIONS APPROVED, NOT ACCEPTED
2
$103,240
2
$74,940
3
$138,707
1
$21,060
0
$0
0
$0
APPLICATIONS DENIED
2
$121,125
6
$118,672
17
$140,142
5
$37,130
2
$75,280
1
$60,900
APPLICATIONS WITHDRAWN
1
$87,390
3
$88,673
10
$108,468
0
$0
1
$85,580
1
$59,540
FILES CLOSED FOR INCOMPLETENESS
0
$0
1
$88,750
2
$141,615
0
$0
0
$0
0
$0
Aggregated Statistics For Year 2007 (Based on 2 partial tracts)
A) FHA, FSA/RHS & VA Home Purchase Loans
B) Conventional Home Purchase Loans
C) Refinancings
D) Home Improvement Loans
F) Non-occupant Loans on < 5 Family Dwellings (A B C & D)
G) Loans On Manufactured Home Dwelling (A B C & D)
Number
Average Value
Number
Average Value
Number
Average Value
Number
Average Value
Number
Average Value
Number
Average Value
LOANS ORIGINATED
10
$114,785
41
$111,825
25
$161,849
5
$53,792
11
$109,515
4
$76,638
APPLICATIONS APPROVED, NOT ACCEPTED
1
$127,460
5
$99,842
6
$193,647
1
$62,490
1
$247,000
1
$91,470
APPLICATIONS DENIED
2
$137,425
7
$89,040
23
$172,379
4
$45,280
2
$116,370
3
$54,713
APPLICATIONS WITHDRAWN
1
$135,610
6
$116,597
12
$171,102
0
$0
1
$238,850
0
$0
FILES CLOSED FOR INCOMPLETENESS
0
$0
1
$111,620
2
$302,355
0
$0
0
$0
0
$0
Aggregated Statistics For Year 2006 (Based on 2 partial tracts)
A) FHA, FSA/RHS & VA Home Purchase Loans
B) Conventional Home Purchase Loans
C) Refinancings
D) Home Improvement Loans
F) Non-occupant Loans on < 5 Family Dwellings (A B C & D)
G) Loans On Manufactured Home Dwelling (A B C & D)
Number
Average Value
Number
Average Value
Number
Average Value
Number
Average Value
Number
Average Value
Number
Average Value
LOANS ORIGINATED
9
$100,748
52
$105,711
29
$136,683
6
$41,847
11
$83,233
3
$70,260
APPLICATIONS APPROVED, NOT ACCEPTED
0
$0
8
$93,900
5
$130,362
3
$34,413
2
$84,675
1
$22,190
APPLICATIONS DENIED
1
$106,410
10
$79,897
24
$120,171
7
$46,056
3
$79,543
3
$42,337
APPLICATIONS WITHDRAWN
1
$99,840
7
$86,194
17
$136,799
1
$77,430
3
$94,030
0
$0
FILES CLOSED FOR INCOMPLETENESS
0
$0
1
$158,030
8
$158,140
0
$0
1
$76,300
0
$0
Aggregated Statistics For Year 2005 (Based on 2 partial tracts)
A) FHA, FSA/RHS & VA Home Purchase Loans
B) Conventional Home Purchase Loans
C) Refinancings
D) Home Improvement Loans
F) Non-occupant Loans on < 5 Family Dwellings (A B C & D)
G) Loans On Manufactured Home Dwelling (A B C & D)
Number
Average Value
Number
Average Value
Number
Average Value
Number
Average Value
Number
Average Value
Number
Average Value
LOANS ORIGINATED
10
$94,635
56
$99,208
39
$161,702
5
$76,930
15
$84,538
6
$75,920
APPLICATIONS APPROVED, NOT ACCEPTED
2
$73,580
5
$99,842
6
$134,407
1
$32,150
1
$117,950
2
$51,055
APPLICATIONS DENIED
1
$100,300
10
$90,968
28
$129,218
8
$51,732
2
$150,895
3
$68,827
APPLICATIONS WITHDRAWN
1
$90,790
7
$115,820
19
$131,336
3
$155,537
3
$109,277
1
$52,980
FILES CLOSED FOR INCOMPLETENESS
0
$0
1
$124,070
9
$124,042
0
$0
0
$0
0
$0
Aggregated Statistics For Year 2004 (Based on 2 partial tracts)
A) FHA, FSA/RHS & VA Home Purchase Loans
B) Conventional Home Purchase Loans
C) Refinancings
D) Home Improvement Loans
F) Non-occupant Loans on < 5 Family Dwellings (A B C & D)
G) Loans On Manufactured Home Dwelling (A B C & D)
Number
Average Value
Number
Average Value
Number
Average Value
Number
Average Value
Number
Average Value
Number
Average Value
LOANS ORIGINATED
7
$114,170
45
$103,072
48
$128,062
5
$35,590
10
$95,043
5
$58,728
APPLICATIONS APPROVED, NOT ACCEPTED
0
$0
6
$89,390
4
$157,178
2
$21,055
1
$81,280
1
$91,010
APPLICATIONS DENIED
2
$59,430
11
$81,834
29
$116,182
7
$54,239
3
$72,070
3
$48,223
APPLICATIONS WITHDRAWN
1
$154,400
5
$129,592
16
$123,133
2
$86,600
1
$65,880
0
$0
FILES CLOSED FOR INCOMPLETENESS
0
$0
1
$33,730
9
$135,010
0
$0
1
$46,190
0
$0
Aggregated Statistics For Year 2003 (Based on 2 partial tracts)
A) FHA, FSA/RHS & VA Home Purchase Loans
B) Conventional Home Purchase Loans
C) Refinancings
D) Home Improvement Loans
F) Non-occupant Loans on < 5 Family Dwellings (A B C & D)
Number
Average Value
Number
Average Value
Number
Average Value
Number
Average Value
Number
Average Value
LOANS ORIGINATED
7
$104,823
38
$99,789
73
$134,919
6
$34,563
10
$69,573
APPLICATIONS APPROVED, NOT ACCEPTED
1
$62,710
5
$94,590
10
$123,411
1
$14,940
1
$65,880
APPLICATIONS DENIED
1
$91,010
9
$106,786
29
$133,756
4
$28,582
2
$128,480
APPLICATIONS WITHDRAWN
1
$89,650
2
$182,365
18
$141,324
0
$0
2
$107,880
FILES CLOSED FOR INCOMPLETENESS
0
$0
0
$0
4
$149,708
0
$0
1
$72,220
Aggregated Statistics For Year 2002 (Based on 2 partial tracts)
A) FHA, FSA/RHS & VA Home Purchase Loans
B) Conventional Home Purchase Loans
C) Refinancings
D) Home Improvement Loans
F) Non-occupant Loans on < 5 Family Dwellings (A B C & D)
Number
Average Value
Number
Average Value
Number
Average Value
Number
Average Value
Number
Average Value
LOANS ORIGINATED
10
$93,005
31
$112,353
55
$132,045
8
$36,564
9
$77,831
APPLICATIONS APPROVED, NOT ACCEPTED
0
$0
5
$87,254
8
$119,171
2
$48,565
0
$0
APPLICATIONS DENIED
1
$78,560
10
$80,961
17
$107,566
4
$34,640
3
$100,143
APPLICATIONS WITHDRAWN
0
$0
3
$69,580
9
$146,129
0
$0
1
$36,680
FILES CLOSED FOR INCOMPLETENESS
0
$0
1
$220,740
3
$123,463
0
$0
0
$0
Aggregated Statistics For Year 2001 (Based on 2 partial tracts)
A) FHA, FSA/RHS & VA Home Purchase Loans
B) Conventional Home Purchase Loans
C) Refinancings
D) Home Improvement Loans
F) Non-occupant Loans on < 5 Family Dwellings (A B C & D)
Number
Average Value
Number
Average Value
Number
Average Value
Number
Average Value
Number
Average Value
LOANS ORIGINATED
6
$83,202
37
$107,173
38
$121,583
7
$22,090
8
$84,475
APPLICATIONS APPROVED, NOT ACCEPTED
0
$0
8
$79,976
6
$116,068
2
$16,300
1
$111,390
APPLICATIONS DENIED
0
$0
14
$66,368
13
$107,087
5
$27,756
3
$107,013
APPLICATIONS WITHDRAWN
1
$125,880
3
$206,553
8
$102,446
2
$19,355
0
$0
FILES CLOSED FOR INCOMPLETENESS
0
$0
0
$0
2
$131,650
0
$0
0
$0
Aggregated Statistics For Year 2000 (Based on 2 partial tracts)
A) FHA, FSA/RHS & VA Home Purchase Loans
B) Conventional Home Purchase Loans
C) Refinancings
D) Home Improvement Loans
F) Non-occupant Loans on < 5 Family Dwellings (A B C & D)
Number
Average Value
Number
Average Value
Number
Average Value
Number
Average Value
Number
Average Value
LOANS ORIGINATED
6
$75,580
35
$72,157
17
$101,148
5
$30,654
8
$57,874
APPLICATIONS APPROVED, NOT ACCEPTED
0
$0
6
$66,108
4
$77,315
3
$22,037
0
$0
APPLICATIONS DENIED
0
$0
18
$63,593
8
$104,625
4
$16,415
1
$20,600
APPLICATIONS WITHDRAWN
0
$0
4
$127,860
5
$74,758
1
$33,050
0
$0
FILES CLOSED FOR INCOMPLETENESS
0
$0
0
$0
2
$71,770
0
$0
1
$45,510
Aggregated Statistics For Year 1999 (Based on 1 partial tract)
A) FHA, FSA/RHS & VA Home Purchase Loans
B) Conventional Home Purchase Loans
C) Refinancings
D) Home Improvement Loans
F) Non-occupant Loans on < 5 Family Dwellings (A B C & D)


 Nearest zip codes: 76233, 76258, 75058, 75009, 76268, 76227.


 : $28,360 in 9 contracts from 2003 to 2005


