Estimated zip code population in 2022: 1,732 Zip code population in 2010: 2,035 Zip code population in 2000: 2,099
Houses and condos: 865 Renter-occupied apartments: 194
% of renters here:
27%
State:
38%
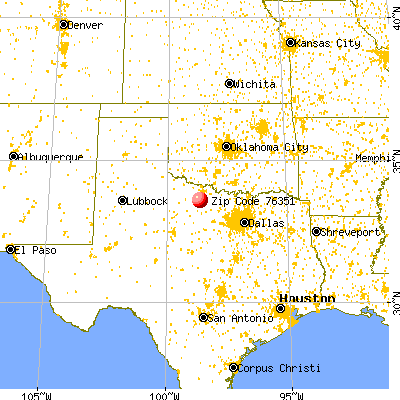
March 2022 cost of living index in zip code 76351: 77.3 (low, U.S. average is 100)
Land area: 191.8 sq. mi. Water area: 1.7 sq. mi.
Population density: 9 people per square mile
(very low).
OSM Map
General Map
Google Map
MSN Map
OSM Map
General Map
Google Map
MSN Map
OSM Map
General Map
Google Map
MSN Map
OSM Map
General Map
Google Map
MSN Map
Please wait while loading the map...
Real estate property taxes paid for housing units in 2022:
This zip code:
1.6% ($1,868)
Texas:
1.5% ($4,050)
Median real estate property taxes paid for housing units with mortgages in 2022: $1,455 (1.4%) Median real estate property taxes paid for housing units with no mortgage in 2022: $2,069 (1.6%)
Business Search- 14 Million verified businesses
Males: 824
(47.6%)
Females: 907
(52.4%)
For population 25 years and over in 76351:
High school or higher: 87.9%
Bachelor's degree or higher: 24.6%
Graduate or professional degree: 7.6%
Mean travel time to work (commute): 17.8 minutes
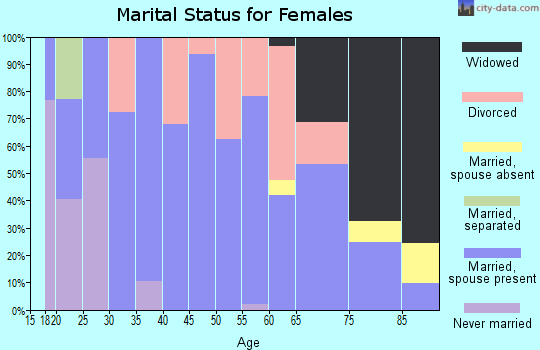
For population 15 years and over in 76351:
Never married: 29.5%
Now married: 47.9%
Separated: 1.2%
Widowed: 9.9%
Divorced: 11.4%
Zip code 76351 compared to state average:
Median house value significantly below state average.
Unemployed percentage significantly below state average.
Black race population percentage significantly below state average.
Hispanic race population percentage significantly below state average.
Median age above state average.
Foreign-born population percentage significantly below state average.
Length of stay since moving in significantly above state average.
Estimated median house/condo value in 2022: $113,516
76351:
$113,516
Texas:
$275,400
According to our research of Texas and other state lists, there were 4 registered sex offenders living in 76351 zip code as of May 28, 2024. The ratio of all residents to sex offenders in zip code 76351 is 437 to 1. The ratio of registered sex offenders to all residents in this zip code is near the state average.
Median resident age:
This zip code:
43.3 years
Texas median age:
35.6 years
Average household size:
This zip code:
2.3 people
Texas:
2.6 people
Averages for the 2020 tax year for zip code 76351, filed in 2021:
Average Adjusted Gross Income (AGI) in 2020: $62,996 (Individual Income Tax Returns)
Here:
$62,996
State:
$77,054
Salary/wage: $47,144 (reported on 81.9% of returns)
Here:
$47,144
State:
$62,766
(% of AGI for various income ranges: 1171.9% for AGIs below $25k, 3550.0% for AGIs $25k-50k, 7466.7% for AGIs $50k-75k, 10320.0% for AGIs $75k-100k, 19470.0% for AGIs $100k-200k)
Taxable interest for individuals: $711 (reported on 21.7% of returns)
This zip code:
$711
Texas:
$2,665
(% of AGI for various income ranges: 5.7% for AGIs below $25k, 20.6% for AGIs $25k-50k, 33.3% for AGIs $50k-75k, 10.0% for AGIs $75k-100k, 76.7% for AGIs $100k-200k)
Ordinary dividends: $2,600 (reported on 13.3% of returns)
Here:
$2,600
State:
$10,044
(% of AGI for various income ranges: 39.4% for AGIs $25k-50k, 37.8% for AGIs $50k-75k, 308.3% for AGIs $100k-200k)
Net capital gain/loss in AGI: +$10,992 (reported on 14.5% of returns)
Here:
+$10,992
State:
+$39,590
(% of AGI for various income ranges: 34.7% for AGIs $25k-50k, 132.2% for AGIs $50k-75k, 1901.7% for AGIs $100k-200k)
Profit/loss from business: +$12,976 (reported on 20.5% of returns)
Here:
+$12,976
State:
+$10,888
(% of AGI for various income ranges: 75.7% for AGIs below $25k, 207.6% for AGIs $25k-50k, 645.6% for AGIs $50k-75k, 232.0% for AGIs $75k-100k, 1661.7% for AGIs $100k-200k)
Taxable individual retirement arrangement distribution: $15,667 (reported on 7.2% of returns)
76351:
$15,667
Texas:
$24,740
(% of AGI for various income ranges: 157.1% for AGIs below $25k, 1220.0% for AGIs $75k-100k)
Total itemized deductions: $46,867 (reported on 3.6% of returns)
Here:
$46,867
State:
$40,428
(% of AGI for various income ranges: 2812.0% for AGIs $75k-100k)
Charity contributions: $11,850 (reported on 2.4% of returns)
Here:
$11,850
State:
$18,201
(% of AGI for various income ranges: 263.3% for AGIs $50k-75k)
Taxes paid: $5,967 (reported on 3.6% of returns)
76351:
$5,967
State:
$7,821
(% of AGI for various income ranges: 358.0% for AGIs $75k-100k)
Earned income credit: $2,571 (reported on 16.9% of returns)
Here:
$2,571
State:
$2,584
(% of AGI for various income ranges: 97.1% for AGIs below $25k, 91.8% for AGIs $25k-50k)
Percentage of individuals using paid preparers for their 2020 taxes: 91.6%
Here:
92%
State:
92%
(% for various income ranges: 92.6% for AGIs below $25k, 90.9% for AGIs $25k-50k, 92.9% for AGIs $50k-75k, 87.5% for AGIs $75k-100k, 91.7% for AGIs $100k-200k)
Averages for the 2012 tax year for zip code 76351, filed in 2013:
Average Adjusted Gross Income (AGI) in 2012: $52,939 (Individual Income Tax Returns)
Here:
$52,939
State:
$65,384
Salary/wage: $42,135 (reported on 85.7% of returns)
Here:
$42,135
State:
$52,524
(% of AGI for various income ranges: 78.5% for AGIs below $25k, 81.5% for AGIs $25k-50k, 76.7% for AGIs $50k-75k, 78.3% for AGIs $75k-100k, 50.5% for AGIs $100k-200k)
Taxable interest for individuals: $800 (reported on 31.0% of returns)
This zip code:
$800
Texas:
$2,372
(% of AGI for various income ranges: 0.7% for AGIs below $25k, 0.6% for AGIs $25k-50k, 0.9% for AGIs $50k-75k, 0.1% for AGIs $75k-100k, 0.3% for AGIs $100k-200k)
Ordinary dividends: $2,370 (reported on 11.9% of returns)
Here:
$2,370
State:
$9,721
(% of AGI for various income ranges: 1.2% for AGIs below $25k, 0.5% for AGIs $50k-75k, 0.9% for AGIs $100k-200k)
Net capital gain/loss in AGI: +$16,337 (reported on 9.5% of returns)
Here:
+$16,337
State:
+$35,319
(% of AGI for various income ranges: 0.5% for AGIs below $25k, 0.7% for AGIs $50k-75k, 7.4% for AGIs $100k-200k)
Profit/loss from business: +$14,674 (reported on 22.6% of returns)
Here:
+$14,674
State:
+$13,732
(% of AGI for various income ranges: 7.7% for AGIs below $25k, 7.5% for AGIs $25k-50k, 5.1% for AGIs $50k-75k, 3.9% for AGIs $75k-100k, 7.1% for AGIs $100k-200k)
Taxable individual retirement arrangement distribution: $10,883 (reported on 7.1% of returns)
76351:
$10,883
Texas:
$19,511
(% of AGI for various income ranges: 2.6% for AGIs below $25k, 2.1% for AGIs $50k-75k, 4.6% for AGIs $75k-100k)
Total itemized deductions: $27,180 (25% of AGI, reported on 17.9% of returns)
Here:
$27,180
State:
$24,724
Here:
25.4% of AGI
State:
15.9% of AGI
(% of AGI for various income ranges: 8.1% for AGIs $25k-50k, 7.0% for AGIs $50k-75k, 7.0% for AGIs $75k-100k, 14.0% for AGIs $100k-200k)
Charity contributions: $6,850 (reported on 11.9% of returns)
Here:
$6,850
State:
$6,808
(% of AGI for various income ranges: 2.0% for AGIs $25k-50k, 1.0% for AGIs $75k-100k, 2.8% for AGIs $100k-200k)
Taxes paid: $3,387 (reported on 17.9% of returns)
76351:
$3,387
State:
$6,921
(% of AGI for various income ranges: 1.2% for AGIs $25k-50k, 0.9% for AGIs $50k-75k, 1.2% for AGIs $75k-100k, 1.5% for AGIs $100k-200k)
Earned income credit: $2,100 (reported on 19.0% of returns)
Here:
$2,100
State:
$2,570
(% of AGI for various income ranges: 6.1% for AGIs below $25k, 1.3% for AGIs $25k-50k)
Percentage of individuals using paid preparers for their 2012 taxes: 52.4%
Here:
52%
State:
51%
(% for various income ranges: 38.7% for AGIs below $25k, 47.6% for AGIs $25k-50k, 64.3% for AGIs $50k-75k, 66.7% for AGIs $75k-100k, 77.8% for AGIs $100k-200k)
Averages for the 2004 tax year for zip code 76351, filed in 2005:
Average Adjusted Gross Income (AGI) in 2004: $35,079 (Individual Income Tax Returns)
Here:
$35,079
State:
$47,881
Salary/wage: $31,314 (reported on 82.3% of returns)
Here:
$31,314
State:
$41,947
(% of AGI for various income ranges: 216.0% for AGIs below $10k, 73.5% for AGIs $10k-25k, 84.0% for AGIs $25k-50k, 79.7% for AGIs $50k-75k, 77.4% for AGIs $75k-100k, 40.0% for AGIs over 100k)
Taxable interest for individuals: $1,597 (reported on 34.6% of returns)
This zip code:
$1,597
Texas:
$2,255
(% of AGI for various income ranges: 5.9% for AGIs below $10k, 3.5% for AGIs $10k-25k, 1.7% for AGIs $25k-50k, 0.8% for AGIs $50k-75k, 0.5% for AGIs $75k-100k, 1.5% for AGIs over 100k)
Taxable dividends: $794 (reported on 15.6% of returns)
Here:
$794
State:
$4,261
(% of AGI for various income ranges: 1.7% for AGIs below $10k, 0.7% for AGIs $10k-25k, 0.2% for AGIs $25k-50k, 0.2% for AGIs $50k-75k, 0.1% for AGIs $75k-100k, 0.6% for AGIs over 100k)
Net capital gain/loss: +$1,570 (reported on 12.8% of returns)
Here:
+$1,570
State:
+$16,110
(% of AGI for various income ranges: 9.2% for AGIs below $10k, -0.3% for AGIs $10k-25k, 0.2% for AGIs $25k-50k, 0.1% for AGIs $50k-75k, 2.1% for AGIs over 100k)
Profit/loss from business: +$10,687 (reported on 23.3% of returns)
Here:
+$10,687
State:
+$11,013
(% of AGI for various income ranges: 32.8% for AGIs below $10k, 7.2% for AGIs $10k-25k, 3.9% for AGIs $25k-50k, 7.9% for AGIs $50k-75k, 12.6% for AGIs over 100k)
IRA payment deduction: $2,769 (reported on 1.6% of returns)
76351:
$2,769
Texas:
$3,120
Total itemized deductions: $17,034 (20% of AGI, reported on 10.5% of returns)
Here:
$17,034
State:
$19,631
Here:
19.8% of AGI
State:
18.9% of AGI
(% of AGI for various income ranges: 4.7% for AGIs $25k-50k, 5.1% for AGIs $50k-75k, 7.3% for AGIs $75k-100k, 8.1% for AGIs over 100k)
Charity contributions deductions: $6,500 (7% of AGI, reported on 8.1% of returns)
Here:
$6,500
State:
$4,753
Here:
7.0% of AGI
State:
4.2% of AGI
(% of AGI for various income ranges: 0.6% for AGIs $25k-50k, 1.6% for AGIs $50k-75k, 1.6% for AGIs $75k-100k, 3.6% for AGIs over 100k)
Total tax: $5,051 (reported on 72.4% of returns)
76351:
$5,051
State:
$9,058
(% of AGI for various income ranges: 8.1% for AGIs below $10k, 4.3% for AGIs $10k-25k, 6.3% for AGIs $25k-50k, 9.4% for AGIs $50k-75k, 11.3% for AGIs $75k-100k, 21.2% for AGIs over 100k)
Earned income credit: $1,675 (reported on 18.7% of returns)
Here:
$1,675
State:
$2,024
Percentage of individuals using paid preparers for their 2004 taxes: 59.4%
Here:
59%
State:
57%
(% for various income ranges: 50.8% for AGIs below $10k, 55.4% for AGIs $10k-25k, 63.9% for AGIs $25k-50k, 66.9% for AGIs $50k-75k, 51.4% for AGIs $75k-100k, 84.8% for AGIs over 100k)
Household received Food Stamps/SNAP in the past 12 months: 104 Household did not receive Food Stamps/SNAP in the past 12 months: 622
Women who did not have a birth in the past 12 months: 355 (162 now married, 192 unmarried)
Housing units in zip code 76351 with a mortgage: 156 Median monthly owner costs for units with a mortgage: $1,042 Median monthly owner costs for units without a mortgage: $576
Residents with income below the poverty level in 2022:
This zip code:
22.9%
Whole state:
14.0%
Residents with income below 50% of the poverty level in 2022:
This zip code:
7.8%
Whole state:
7.4%
Median number of rooms in houses and condos:
Here:
5.5
State:
6.3
Median number of rooms in apartments:
Here:
4.1
State:
4.0
Notable locations in this zip code not listed on our city pages
Notable locations in zip code 76351: Mule Shoe Ranch (A), Archer City Fire Department (B), Archer City Ambulance Service (C). Display/hide their locations on the map
Reservoirs: Furr Lake (A), Schrieber Lake (B), Archer City Lake (C), Ikard Lake (D), McKinney Lake (E), Carver Lake (F). Display/hide their locations on the map
Streams, rivers, and creeks: Bluff Creek (A), South Fork Little Wichita River (B), North Fork Little Wichita River (C), Table Branch (D), Middle Fork Little Wichita River (E), Mesquite Creek (F), Little Onion Creek (G), Dogwood Creek (H). Display/hide their locations on the map
In group quarters: 45 (-1 institutionalized population)
Size of family households: 177 2-persons, 116 3-persons, 62 4-persons, 10 5-persons, 16 6-persons, 22 7-or-more-persons
Size of nonfamily households: 291 1-person, 15 2-persons, 17 3-persons
217 married couples with children.
181 single-parent households (52 men, 129 women).
95.2% of residents of 76351 zip code speak English at home.
4.7% of residents speak Spanish at home (45% very well, 36% well, 18% not well).
Foreign born population: 76 (4.4%) (0.0% of them are naturalized citizens)
:
4.4%
Whole state:
17.2%
96%Honduras
22%German
9%English
6%Italian
5%American
5%Irish
2%Norwegian
2%Scottish
Year of entry for the foreign-born population
742010 or later
02000 to 2009
01990 to 1999
15Before 1990
Facilities with environmental interests located in this zip code:
ARCHER CITY EL (600 S ASH in ARCHER CITY, TX)
(National Center for Education Statistics) - STATE ID-005901101 Organizations: ARCHER CITY ISD (SCHOOL DISTRICT)
ARCHER CITY H S (600 S ASH in ARCHER CITY, TX)
(National Center for Education Statistics) - STATE ID-005901001 Organizations: ARCHER CITY ISD (SCHOOL DISTRICT)
ARCHER CITY ISD (600 S ASH in ARCHER CITY, TX)
COMPLIANCE ACTIVITY (Tracking inspections of insecticide, fungicide, and rodenticide, and toxic substances)
Housing units lacking complete plumbing facilities: 7.6% Housing units lacking complete kitchen facilities: 5.2%
47.9%Electricity
42.5%Utility gas
9.9%Bottled, tank, or LP gas
Place of birth for U.S.-born residents:
This state: 1,229
Northeast: 32
Midwest: 116
South: 144
West: 124
54% of the 76351 zip code residents lived in the same house 5 years ago. Out of people who lived in different houses, 45% lived in this county. Out of people who lived in different counties, 50% lived in Texas.
96% of the 76351 zip code residents lived in the same house 1 year ago. Out of people who lived in different houses, 40% moved from this county. Out of people who lived in different houses, 64% moved from different county within same state.
Private vs. public school enrollment:
Students in private schools in grades 1 to 8 (elementary and middle school): 7
Here:
4.4%
Texas:
8.8%
Students in private schools in grades 9 to 12 (high school):
Here:
0.0%
Texas:
8.0%
Students in private undergraduate colleges: 17
Here:
27.2%
Texas:
16.2%
Occupation by median earnings in the past 12 months ($)
79,303Management occupations
68,334Farming, fishing, and forestry occupations
54,204Business and financial operations occupations
48,064Building and grounds cleaning and maintenance occupations
41,434Production occupations
38,392Office and administrative support occupations
Top industries in this zip code by the number of employees in 2005:
Health Care and Social Assistance: Child Day Care Services (10-19: 1)
Construction: Site Preparation Contractors (5-9: 1, 1-4: 1)
Accommodation and Food Services: Full-Service Restaurants (5-9: 1, 1-4: 1)
Finance and Insurance: Insurance Agencies and Brokerages (5-9: 1)
People in group quarters in 2010:
33 people in nursing facilities/skilled-nursing facilities
10 people in local jails and other municipal confinement facilities
People in group quarters in 2000:
33 people in nursing homes
8 people in local jails and other confinement facilities (including police lockups)
Fatal accident statistics in 2013:
Fatal accident count: 1
Vehicles involved in fatal accidents: 1
Fatal accidents caused by drunken drivers: 1
Fatalities: 1
Persons involved in fatal accidents: 1
Pedestrians involved in fatal accidents: 0
2003 - 2018 National Fire Incident Reporting System (NFIRS) incidents
Based on the data from the years 2003 - 2018 the average number of fire incidents per year is 42. The highest number of fire incidents - 78 took place in 2008, and the least - 24 in 2012. The data has an increasing trend.
When looking into fire subcategories, the most incidents belonged to: Outside Fires (81.6%), and Structure Fires (11.5%).
Fire incident types reported to NFIRS in Zip Code 76351


 Nearest zip codes: 76366, 76370, 76374, 76379, 76389, 76310.


 Based on the data from the years 2003 - 2018 the average number of fire incidents per year is 42. The highest number of fire incidents - 78 took place in 2008, and the least - 24 in 2012. The data has an increasing trend.
 When looking into fire subcategories, the most incidents belonged to: Outside Fires (81.6%), and Structure Fires (11.5%).