Estimated zip code population in 2022: 1,877 Zip code population in 2010: 1,897 Zip code population in 2000: 1,638
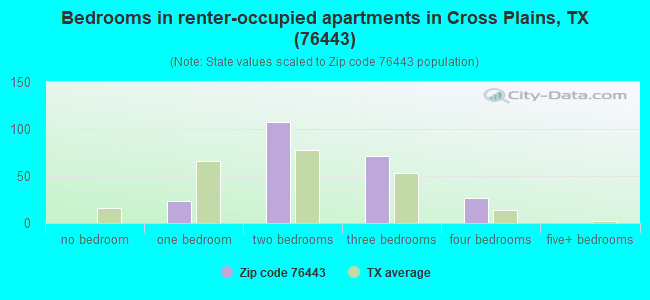
Houses and condos: 1,009 Renter-occupied apartments: 232
% of renters here:
28%
State:
38%
March 2022 cost of living index in zip code 76443: 78.5 (low, U.S. average is 100)
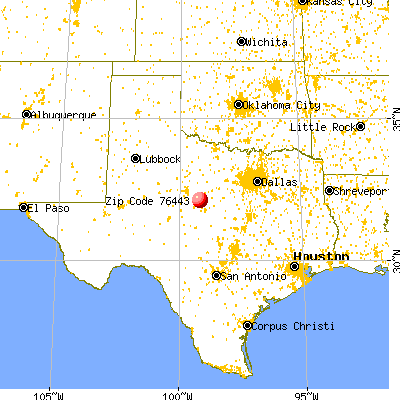
Land area: 141.5 sq. mi. Water area: 0.4 sq. mi.
Population density: 13 people per square mile
(very low).
OSM Map
General Map
Google Map
MSN Map
OSM Map
General Map
Google Map
MSN Map
OSM Map
General Map
Google Map
MSN Map
OSM Map
General Map
Google Map
MSN Map
Please wait while loading the map...
Real estate property taxes paid for housing units in 2022:
This zip code:
0.8% ($1,128)
Texas:
1.5% ($4,050)
Median real estate property taxes paid for housing units with mortgages in 2022: $1,278 (0.9%) Median real estate property taxes paid for housing units with no mortgage in 2022: $1,091 (0.8%)
Business Search- 14 Million verified businesses
Males: 1,008
(53.7%)
Females: 868
(46.3%)
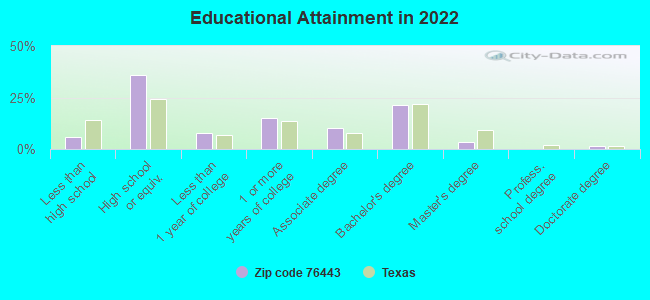
For population 25 years and over in 76443:
High school or higher: 93.7%
Bachelor's degree or higher: 25.7%
Graduate or professional degree: 4.5%
Unemployed: 4.4%
Mean travel time to work (commute): 28.3 minutes
For population 15 years and over in 76443:
Never married: 14.5%
Now married: 67.2%
Separated: 0.0%
Widowed: 7.7%
Divorced: 10.6%
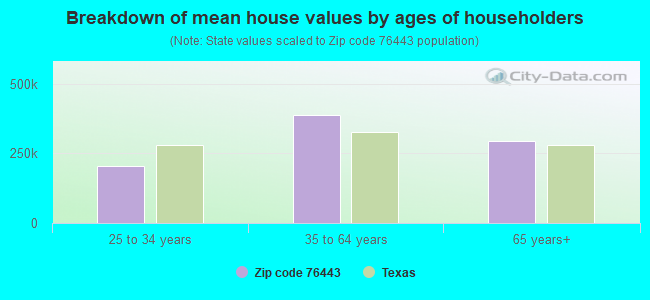
Zip code 76443 compared to state average:
Median house value below state average.
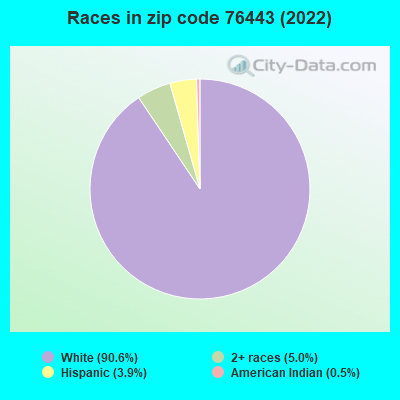
Black race population percentage significantly below state average.
Hispanic race population percentage significantly below state average.
Median age above state average.
Foreign-born population percentage significantly below state average.
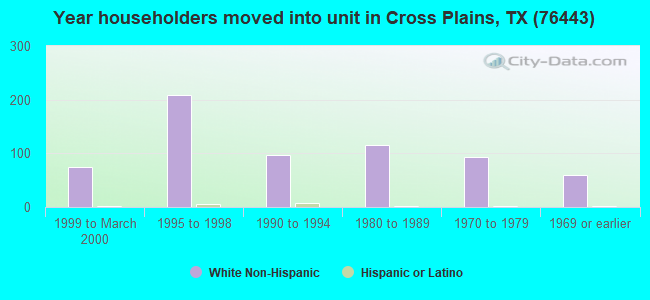
Length of stay since moving in significantly above state average.
Averages for the 2020 tax year for zip code 76443, filed in 2021:
Average Adjusted Gross Income (AGI) in 2020: $62,784 (Individual Income Tax Returns)
Here:
$62,784
State:
$77,054
Salary/wage: $44,302 (reported on 72.4% of returns)
Here:
$44,302
State:
$62,766
(% of AGI for various income ranges: 1216.2% for AGIs below $25k, 3303.6% for AGIs $25k-50k, 6152.9% for AGIs $50k-75k, 8280.0% for AGIs $75k-100k, 17480.0% for AGIs $100k-200k)
Taxable interest for individuals: $824 (reported on 38.2% of returns)
This zip code:
$824
Texas:
$2,665
(% of AGI for various income ranges: 9.5% for AGIs below $25k, 66.4% for AGIs $25k-50k, 55.7% for AGIs $50k-75k, 14.0% for AGIs $75k-100k, 160.0% for AGIs $100k-200k)
Ordinary dividends: $5,692 (reported on 17.1% of returns)
Here:
$5,692
State:
$10,044
(% of AGI for various income ranges: 29.5% for AGIs below $25k, 148.6% for AGIs $25k-50k, 96.0% for AGIs $75k-100k, 844.0% for AGIs $100k-200k)
Net capital gain/loss in AGI: +$15,475 (reported on 15.8% of returns)
Here:
+$15,475
State:
+$39,590
(% of AGI for various income ranges: 105.7% for AGIs $25k-50k, 360.0% for AGIs $75k-100k, 3060.0% for AGIs $100k-200k)
Profit/loss from business: +$7,139 (reported on 23.7% of returns)
Here:
+$7,139
State:
+$10,888
(% of AGI for various income ranges: 133.8% for AGIs below $25k, 244.3% for AGIs $25k-50k, 618.6% for AGIs $50k-75k, 458.0% for AGIs $100k-200k)
Taxable individual retirement arrangement distribution: $17,633 (reported on 11.8% of returns)
76443:
$17,633
Texas:
$24,740
(% of AGI for various income ranges: 81.0% for AGIs below $25k, 421.4% for AGIs $25k-50k, 1654.0% for AGIs $75k-100k)
Total itemized deductions: $35,333 (reported on 3.9% of returns)
Here:
$35,333
State:
$40,428
(% of AGI for various income ranges: 1514.3% for AGIs $50k-75k)
Charity contributions: $22,250 (reported on 2.6% of returns)
Here:
$22,250
State:
$18,201
(% of AGI for various income ranges: 635.7% for AGIs $50k-75k)
Taxes paid: $5,250 (reported on 2.6% of returns)
76443:
$5,250
State:
$7,821
(% of AGI for various income ranges: 150.0% for AGIs $50k-75k)
Earned income credit: $2,676 (reported on 22.4% of returns)
Here:
$2,676
State:
$2,584
(% of AGI for various income ranges: 150.0% for AGIs below $25k, 100.0% for AGIs $25k-50k)
Percentage of individuals using paid preparers for their 2020 taxes: 92.1%
Here:
92%
State:
92%
(% for various income ranges: 93.1% for AGIs below $25k, 89.5% for AGIs $25k-50k, 90.9% for AGIs $50k-75k, 100.0% for AGIs $75k-100k, 90.0% for AGIs $100k-200k)
Averages for the 2012 tax year for zip code 76443, filed in 2013:
Average Adjusted Gross Income (AGI) in 2012: $46,589 (Individual Income Tax Returns)
Here:
$46,589
State:
$65,384
Salary/wage: $41,213 (reported on 70.3% of returns)
Here:
$41,213
State:
$52,524
(% of AGI for various income ranges: 63.9% for AGIs below $25k, 69.8% for AGIs $25k-50k, 71.4% for AGIs $50k-75k, 71.9% for AGIs $75k-100k, 46.3% for AGIs $100k-200k)
Taxable interest for individuals: $920 (reported on 40.5% of returns)
This zip code:
$920
Texas:
$2,372
(% of AGI for various income ranges: 2.6% for AGIs below $25k, 1.2% for AGIs $25k-50k, 0.5% for AGIs $50k-75k, 0.3% for AGIs $75k-100k, 0.4% for AGIs $100k-200k)
Ordinary dividends: $4,910 (reported on 13.5% of returns)
Here:
$4,910
State:
$9,721
(% of AGI for various income ranges: 1.1% for AGIs below $25k, 0.8% for AGIs $25k-50k, 0.7% for AGIs $50k-75k, 3.0% for AGIs $100k-200k)
Net capital gain/loss in AGI: +$11,350 (reported on 13.5% of returns)
Here:
+$11,350
State:
+$35,319
(% of AGI for various income ranges: 1.2% for AGIs $25k-50k, 4.5% for AGIs $50k-75k, 6.5% for AGIs $100k-200k)
Profit/loss from business: +$13,542 (reported on 25.7% of returns)
Here:
+$13,542
State:
+$13,732
(% of AGI for various income ranges: 13.8% for AGIs below $25k, 9.9% for AGIs $25k-50k, 2.7% for AGIs $50k-75k, 10.2% for AGIs $100k-200k)
Taxable individual retirement arrangement distribution: $9,612 (reported on 10.8% of returns)
76443:
$9,612
Texas:
$19,511
(% of AGI for various income ranges: 4.1% for AGIs below $25k, 2.9% for AGIs $25k-50k, 5.8% for AGIs $50k-75k)
Total itemized deductions: $24,417 (25% of AGI, reported on 16.2% of returns)
Here:
$24,417
State:
$24,724
Here:
25.2% of AGI
State:
15.9% of AGI
(% of AGI for various income ranges: 10.6% for AGIs $25k-50k, 16.3% for AGIs $50k-75k, 8.8% for AGIs $100k-200k)
Charity contributions: $9,412 (reported on 10.8% of returns)
Here:
$9,412
State:
$6,808
(% of AGI for various income ranges: 2.0% for AGIs $25k-50k, 2.0% for AGIs $50k-75k, 4.1% for AGIs $100k-200k)
Taxes paid: $4,175 (reported on 16.2% of returns)
76443:
$4,175
State:
$6,921
(% of AGI for various income ranges: 1.5% for AGIs $25k-50k, 3.5% for AGIs $50k-75k, 1.3% for AGIs $100k-200k)
Earned income credit: $2,182 (reported on 23.0% of returns)
Here:
$2,182
State:
$2,570
(% of AGI for various income ranges: 7.7% for AGIs below $25k, 1.2% for AGIs $25k-50k)
Percentage of individuals using paid preparers for their 2012 taxes: 60.8%
Here:
61%
State:
51%
(% for various income ranges: 56.7% for AGIs below $25k, 57.1% for AGIs $25k-50k, 63.6% for AGIs $50k-75k, 66.7% for AGIs $75k-100k, 83.3% for AGIs $100k-200k)
Averages for the 2004 tax year for zip code 76443, filed in 2005:
Average Adjusted Gross Income (AGI) in 2004: $26,103 (Individual Income Tax Returns)
Here:
$26,103
State:
$47,881
Salary/wage: $27,684 (reported on 70.1% of returns)
Here:
$27,684
State:
$41,947
(% of AGI for various income ranges: 67.8% for AGIs $10k-25k, 67.4% for AGIs $25k-50k, 70.4% for AGIs $50k-75k, 77.8% for AGIs $75k-100k, 62.4% for AGIs over 100k)
Taxable interest for individuals: $1,765 (reported on 40.5% of returns)
This zip code:
$1,765
Texas:
$2,255
(% of AGI for various income ranges: 3.9% for AGIs $10k-25k, 3.0% for AGIs $25k-50k, 1.0% for AGIs $50k-75k, 0.9% for AGIs $75k-100k, 0.8% for AGIs over 100k)
Taxable dividends: $1,326 (reported on 17.1% of returns)
Here:
$1,326
State:
$4,261
(% of AGI for various income ranges: 1.1% for AGIs $10k-25k, 0.4% for AGIs $25k-50k, 1.6% for AGIs $50k-75k, 0.5% for AGIs $75k-100k)
Net capital gain/loss: +$2,979 (reported on 18.7% of returns)
Here:
+$2,979
State:
+$16,110
(% of AGI for various income ranges: -0.2% for AGIs $10k-25k, 0.8% for AGIs $25k-50k, 0.7% for AGIs $50k-75k, 12.8% for AGIs $75k-100k)
Profit/loss from business: +$7,145 (reported on 24.6% of returns)
Here:
+$7,145
State:
+$11,013
(% of AGI for various income ranges: 12.3% for AGIs $10k-25k, 8.3% for AGIs $25k-50k, 3.5% for AGIs $50k-75k)
Total itemized deductions: $15,857 (30% of AGI, reported on 13.0% of returns)
Here:
$15,857
State:
$19,631
Here:
30.0% of AGI
State:
18.9% of AGI
(% of AGI for various income ranges: 10.5% for AGIs $10k-25k, 6.4% for AGIs $25k-50k, 5.2% for AGIs $50k-75k, 20.3% for AGIs $75k-100k)
Charity contributions deductions: $4,960 (9% of AGI, reported on 9.9% of returns)
Here:
$4,960
State:
$4,753
Here:
9.4% of AGI
State:
4.2% of AGI
(% of AGI for various income ranges: 1.5% for AGIs $10k-25k, 2.0% for AGIs $25k-50k, 1.3% for AGIs $50k-75k, 4.8% for AGIs $75k-100k)
Total tax: $3,135 (reported on 66.6% of returns)
76443:
$3,135
State:
$9,058
(% of AGI for various income ranges: 4.3% for AGIs $10k-25k, 7.0% for AGIs $25k-50k, 9.1% for AGIs $50k-75k, 10.4% for AGIs $75k-100k, 10.2% for AGIs over 100k)
Earned income credit: $1,584 (reported on 22.0% of returns)
Here:
$1,584
State:
$2,024
Percentage of individuals using paid preparers for their 2004 taxes: 70.9%
Here:
71%
State:
57%
(% for various income ranges: 67.7% for AGIs below $10k, 66.7% for AGIs $10k-25k, 75.6% for AGIs $25k-50k, 72.5% for AGIs $50k-75k, 84.6% for AGIs $75k-100k, 83.3% for AGIs over 100k)
Household received Food Stamps/SNAP in the past 12 months: 123 Household did not receive Food Stamps/SNAP in the past 12 months: 695
Women who had a birth in the past 12 months: 59 (44 now married, 15 unmarried) Women who did not have a birth in the past 12 months: 217 (125 now married, 91 unmarried)
Housing units in zip code 76443 with a mortgage: 186 Median monthly owner costs for units with a mortgage: $1,182 Median monthly owner costs for units without a mortgage: $490
Residents with income below the poverty level in 2022:
This zip code:
11.2%
Whole state:
14.0%
Residents with income below 50% of the poverty level in 2022:
This zip code:
7.5%
Whole state:
7.4%
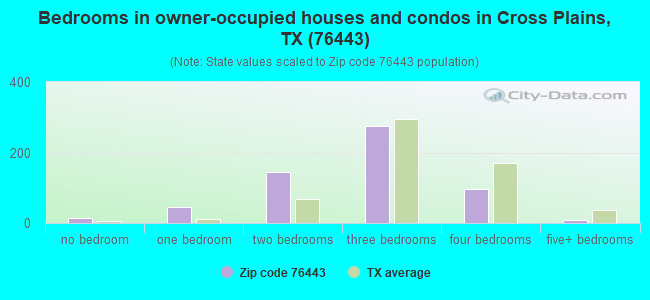
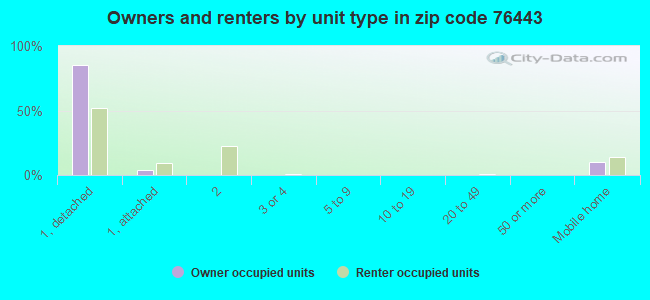
Median number of rooms in houses and condos:
Here:
5.8
State:
6.3
Median number of rooms in apartments:
Here:
4.8
State:
4.0
Notable locations in this zip code not listed on our city pages
Notable locations in zip code 76443: Bull Pasture Windmill (A), Four-Hundred Acre Windmill (B), Goble Windmill (C), Haynes Windmill (D), High Windmill (E), Richardson Windmill (F), Sneed Windmill (G), Trap Windmill (H), Cottonwood Volunteer Fire Department (I), Cross Plains Emergency Medical Services (J), Robert E Howard House (K). Display/hide their locations on the map
Cemeteries: Burnt Branch Cemetery (1), Caddo Peak Cemetery (2), Cross Cut Cemetery (3), Oglesby Cemetery (4), Dressy Cemetery (5). Display/hide their locations on the map
Reservoirs: Freeland Lake (A), Soil Conservation Service Site 34 Reservoir (B), Soil Conservation Service Site 12 Reservoir (C), Soil Conservation Service Site 11a Reservoir (D), Soil Conservation Service Site 26 Reservoir (E), Soil Conservation Service Site 10 Reservoir (F), Soil Conservation Service Site 22 Reservoir (G), McDonough Lake (H). Display/hide their locations on the map
Streams, rivers, and creeks: West Prong Burnt Branch (A), Live Oak Branch (B), Dooley Creek (C), Dinner Branch (D), Cottonwood Creek (E), Bee Branch (F). Display/hide their locations on the map
Size of family households: 367 2-persons, 73 3-persons, 61 4-persons, 62 5-persons, 7 6-persons
Size of nonfamily households: 239 1-person, 8 2-persons
356 married couples with children.
104 single-parent households (6 men, 98 women).
96.8% of residents of 76443 zip code speak English at home.
3.8% of residents speak Spanish at home (92% very well, 8% well).
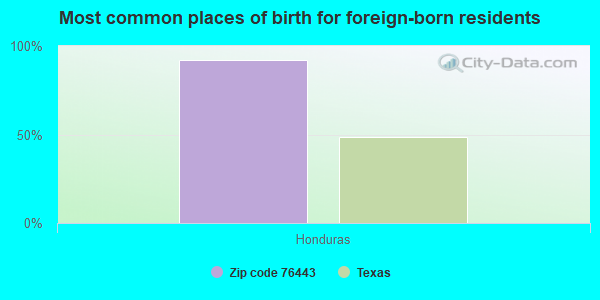
Foreign born population: 12 (0.7%) (0.0% of them are naturalized citizens)
:
0.7%
Whole state:
17.2%
92%Honduras
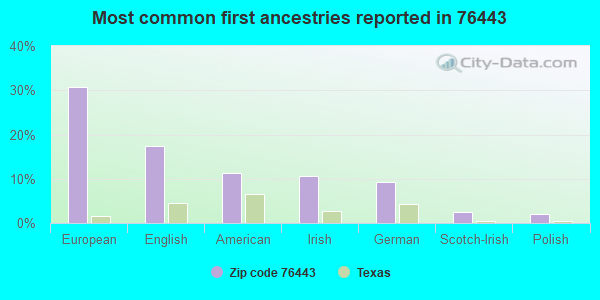
31%European
17%English
11%American
11%Irish
9%German
2%Scotch-Irish
2%Polish
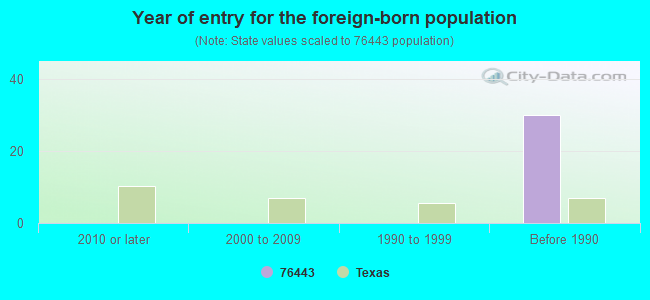
Year of entry for the foreign-born population
02010 or later
02000 to 2009
01990 to 1999
30Before 1990
Housing units lacking complete plumbing facilities: 6.1% Housing units lacking complete kitchen facilities: 8.4%
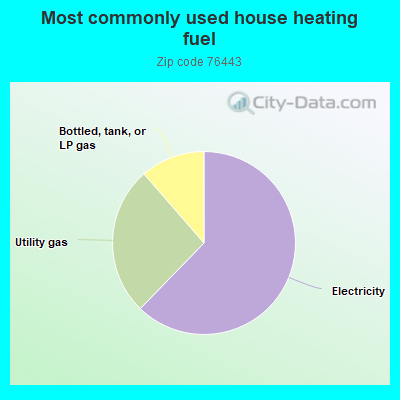
62.4%Electricity
26.4%Utility gas
11.4%Bottled, tank, or LP gas
Population in 1990: 1,928.
Place of birth for U.S.-born residents:
This state: 1,471
Northeast: 67
Midwest: 95
South: 102
West: 94
65% of the 76443 zip code residents lived in the same house 5 years ago. Out of people who lived in different houses, 34% lived in this county. Out of people who lived in different counties, 50% lived in Texas.
96% of the 76443 zip code residents lived in the same house 1 year ago. Out of people who lived in different houses, 48% moved from this county. Out of people who lived in different houses, 40% moved from different county within same state. Out of people who lived in different houses, 16% moved from different state.
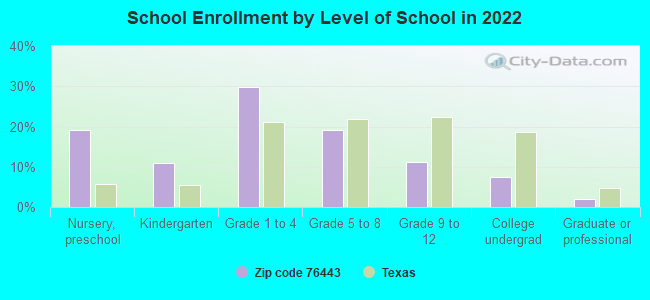
Private vs. public school enrollment:
Students in private schools in grades 1 to 8 (elementary and middle school):
Here:
0.0%
Texas:
8.8%
Students in private schools in grades 9 to 12 (high school):
Here:
0.0%
Texas:
8.0%
Students in private undergraduate colleges: 25
Here:
92.9%
Texas:
16.2%
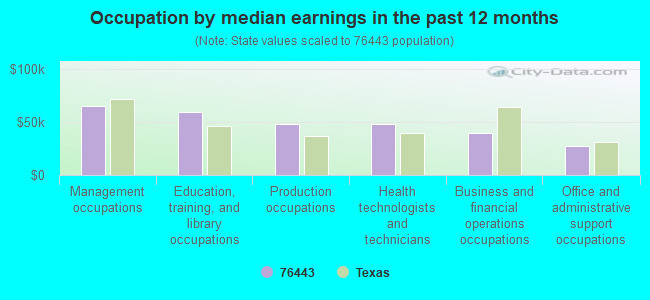
Occupation by median earnings in the past 12 months ($)
65,612Management occupations
60,087Education, training, and library occupations
48,681Production occupations
48,042Health technologists and technicians
40,008Business and financial operations occupations
27,632Office and administrative support occupations
Top industries in this zip code by the number of employees in 2005:
Finance and Insurance: Commercial Banking (20-49: 1)
Accommodation and Food Services: Full-Service Restaurants (5-9: 2, 1-4: 1)
Other Services (except Public Administration): Religious Organizations (5-9: 2, 1-4: 1)
Mining: Crude Petroleum and Natural Gas Extraction (5-9: 1, 1-4: 1)
Construction: Tile and Terrazzo Contractors (5-9: 1)
People in group quarters in 2000:
31 people in nursing homes
Fatal accident statistics in 2014:
Fatal accident count: 1
Vehicles involved in fatal accidents: 2
Fatal accidents caused by drunken drivers: 0
Fatalities: 1
Persons involved in fatal accidents: 2
Pedestrians involved in fatal accidents: 0
Fatal accident statistics in 2013:
Fatal accident count: 1
Vehicles involved in fatal accidents: 2
Fatal accidents caused by drunken drivers: 0
Fatalities: 3
Persons involved in fatal accidents: 4
Pedestrians involved in fatal accidents: 0
2005 - 2018 National Fire Incident Reporting System (NFIRS) incidents
Based on the data from the years 2005 - 2018 the average number of fire incidents per year is 17. The highest number of fires - 33 took place in 2009, and the least - 0 in 2007. The data has a rising trend.
When looking into fire subcategories, the most incidents belonged to: Outside Fires (77.4%), and Structure Fires (13.2%).
Fire incident types reported to NFIRS in Zip Code 76443


 Nearest zip codes: 76828, 76469, 76471, 79504, 76437, 79510.


 Based on the data from the years 2005 - 2018 the average number of fire incidents per year is 17. The highest number of fires - 33 took place in 2009, and the least - 0 in 2007. The data has a rising trend.
 When looking into fire subcategories, the most incidents belonged to: Outside Fires (77.4%), and Structure Fires (13.2%).