Estimated zip code population in 2022: 2,453 Zip code population in 2010: 2,434 Zip code population in 2000: 2,205
Houses and condos: 3,113 Renter-occupied apartments: 157
% of renters here:
13%
State:
38%
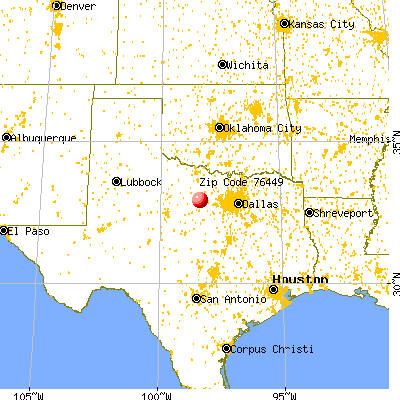
March 2022 cost of living index in zip code 76449: 79.5 (low, U.S. average is 100)
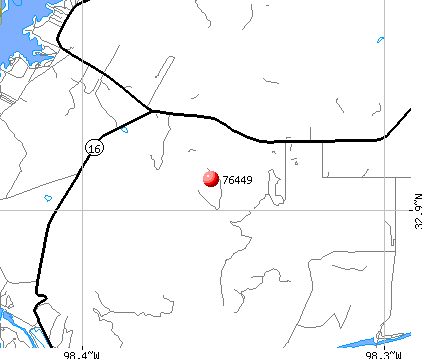
Land area: 207.1 sq. mi. Water area: 16.4 sq. mi.
Population density: 12 people per square mile
(very low).
OSM Map
General Map
Google Map
MSN Map
OSM Map
General Map
Google Map
MSN Map
OSM Map
General Map
Google Map
MSN Map
OSM Map
General Map
Google Map
MSN Map
Please wait while loading the map...
Real estate property taxes paid for housing units in 2022:
This zip code:
1.0% ($2,561)
Texas:
1.5% ($4,050)
Median real estate property taxes paid for housing units with mortgages in 2022: $4,509 (1.3%) Median real estate property taxes paid for housing units with no mortgage in 2022: $1,538 (0.8%)
Business Search- 14 Million verified businesses
Males: 1,175
(47.9%)
Females: 1,278
(52.1%)
For population 25 years and over in 76449:
High school or higher: 94.3%
Bachelor's degree or higher: 27.0%
Graduate or professional degree: 9.6%
Unemployed: 5.9%
Mean travel time to work (commute): 32.9 minutes
For population 15 years and over in 76449:
Never married: 15.3%
Now married: 58.0%
Separated: 1.5%
Widowed: 8.6%
Divorced: 16.5%
Zip code 76449 compared to state average:
Black race population percentage significantly below state average.
Hispanic race population percentage significantly below state average.
Median age significantly above state average.
Foreign-born population percentage significantly below state average.
Renting percentage significantly below state average.
Length of stay since moving in significantly above state average.
Averages for the 2020 tax year for zip code 76449, filed in 2021:
Average Adjusted Gross Income (AGI) in 2020: $88,414 (Individual Income Tax Returns)
Here:
$88,414
State:
$77,054
Salary/wage: $70,009 (reported on 71.3% of returns)
Here:
$70,009
State:
$62,766
(% of AGI for various income ranges: 1171.2% for AGIs below $25k, 3327.9% for AGIs $25k-50k, 6067.5% for AGIs $50k-75k, 8932.0% for AGIs $75k-100k, 15772.5% for AGIs $100k-200k, 113005.0% for AGIs over 200k)
Taxable interest for individuals: $1,984 (reported on 34.3% of returns)
This zip code:
$1,984
Texas:
$2,665
(% of AGI for various income ranges: 10.4% for AGIs below $25k, 28.4% for AGIs $25k-50k, 92.5% for AGIs $50k-75k, 38.0% for AGIs $75k-100k, 468.8% for AGIs $100k-200k, 925.0% for AGIs over 200k)
Ordinary dividends: $8,005 (reported on 18.5% of returns)
Here:
$8,005
State:
$10,044
(% of AGI for various income ranges: 9.2% for AGIs below $25k, 48.4% for AGIs $25k-50k, 287.5% for AGIs $50k-75k, 328.0% for AGIs $75k-100k, 677.5% for AGIs $100k-200k, 2745.0% for AGIs over 200k)
Net capital gain/loss in AGI: +$28,582 (reported on 20.4% of returns)
Here:
+$28,582
State:
+$39,590
(% of AGI for various income ranges: 93.2% for AGIs $25k-50k, 142.5% for AGIs $50k-75k, 1195.0% for AGIs $100k-200k, 25205.0% for AGIs over 200k)
Profit/loss from business: +$13,461 (reported on 25.9% of returns)
Here:
+$13,461
State:
+$10,888
(% of AGI for various income ranges: 241.9% for AGIs below $25k, 332.6% for AGIs $25k-50k, 746.2% for AGIs $50k-75k, 536.2% for AGIs $100k-200k, 7410.0% for AGIs over 200k)
Taxable individual retirement arrangement distribution: $29,543 (reported on 13.0% of returns)
76449:
$29,543
Texas:
$24,740
(% of AGI for various income ranges: 245.3% for AGIs $25k-50k, 1122.5% for AGIs $50k-75k, 1083.8% for AGIs $100k-200k, 9525.0% for AGIs over 200k)
Total itemized deductions: $38,267 (reported on 11.1% of returns)
Here:
$38,267
State:
$40,428
(% of AGI for various income ranges: 1747.5% for AGIs $50k-75k, 1347.5% for AGIs $100k-200k, 10580.0% for AGIs over 200k)
Charity contributions: $12,825 (reported on 7.4% of returns)
Here:
$12,825
State:
$18,201
(% of AGI for various income ranges: 73.2% for AGIs $25k-50k, 365.0% for AGIs $100k-200k, 2975.0% for AGIs over 200k)
Taxes paid: $7,817 (reported on 11.1% of returns)
76449:
$7,817
State:
$7,821
(% of AGI for various income ranges: 295.0% for AGIs $50k-75k, 292.5% for AGIs $100k-200k, 2340.0% for AGIs over 200k)
Earned income credit: $2,333 (reported on 16.7% of returns)
Here:
$2,333
State:
$2,584
(% of AGI for various income ranges: 107.7% for AGIs below $25k, 73.7% for AGIs $25k-50k)
Percentage of individuals using paid preparers for their 2020 taxes: 92.6%
Here:
93%
State:
92%
(% for various income ranges: 91.7% for AGIs below $25k, 96.0% for AGIs $25k-50k, 92.3% for AGIs $50k-75k, 88.9% for AGIs $75k-100k, 93.8% for AGIs $100k-200k, 88.9% for AGIs over 200k)
Averages for the 2012 tax year for zip code 76449, filed in 2013:
Average Adjusted Gross Income (AGI) in 2012: $66,850 (Individual Income Tax Returns)
Here:
$66,850
State:
$65,384
Salary/wage: $53,610 (reported on 73.5% of returns)
Here:
$53,610
State:
$52,524
(% of AGI for various income ranges: 60.8% for AGIs below $25k, 73.4% for AGIs $25k-50k, 69.5% for AGIs $50k-75k, 67.3% for AGIs $75k-100k, 55.3% for AGIs $100k-200k, 48.5% for AGIs over 200k)
Taxable interest for individuals: $2,026 (reported on 35.7% of returns)
This zip code:
$2,026
Texas:
$2,372
(% of AGI for various income ranges: 1.0% for AGIs below $25k, 0.4% for AGIs $25k-50k, 0.3% for AGIs $50k-75k, 0.4% for AGIs $75k-100k, 2.0% for AGIs $100k-200k, 1.3% for AGIs over 200k)
Ordinary dividends: $4,488 (reported on 16.3% of returns)
Here:
$4,488
State:
$9,721
(% of AGI for various income ranges: 1.2% for AGIs below $25k, 0.6% for AGIs $25k-50k, 1.9% for AGIs $50k-75k, 0.9% for AGIs $100k-200k, 1.5% for AGIs over 200k)
Net capital gain/loss in AGI: +$28,393 (reported on 14.3% of returns)
Here:
+$28,393
State:
+$35,319
(% of AGI for various income ranges: 0.5% for AGIs $25k-50k, 0.2% for AGIs $50k-75k, 0.5% for AGIs $100k-200k, 17.9% for AGIs over 200k)
Profit/loss from business: +$17,642 (reported on 26.5% of returns)
Here:
+$17,642
State:
+$13,732
(% of AGI for various income ranges: 17.4% for AGIs below $25k, 9.0% for AGIs $25k-50k, 3.9% for AGIs $50k-75k, 7.1% for AGIs $75k-100k, 8.0% for AGIs $100k-200k, 4.8% for AGIs over 200k)
Taxable individual retirement arrangement distribution: $17,750 (reported on 10.2% of returns)
76449:
$17,750
Texas:
$19,511
(% of AGI for various income ranges: 5.5% for AGIs below $25k, 6.5% for AGIs $50k-75k, 6.2% for AGIs $100k-200k)
Total itemized deductions: $29,668 (20% of AGI, reported on 25.5% of returns)
Here:
$29,668
State:
$24,724
Here:
20.0% of AGI
State:
15.9% of AGI
(% of AGI for various income ranges: 8.3% for AGIs below $25k, 10.7% for AGIs $25k-50k, 7.5% for AGIs $50k-75k, 9.4% for AGIs $75k-100k, 14.7% for AGIs $100k-200k, 12.0% for AGIs over 200k)
Charity contributions: $7,147 (reported on 17.3% of returns)
Here:
$7,147
State:
$6,808
(% of AGI for various income ranges: 1.6% for AGIs below $25k, 1.8% for AGIs $50k-75k, 2.4% for AGIs $100k-200k, 2.9% for AGIs over 200k)
Taxes paid: $7,588 (reported on 24.5% of returns)
76449:
$7,588
State:
$6,921
(% of AGI for various income ranges: 1.1% for AGIs below $25k, 1.2% for AGIs $25k-50k, 1.7% for AGIs $50k-75k, 1.9% for AGIs $75k-100k, 3.8% for AGIs $100k-200k, 3.7% for AGIs over 200k)
Earned income credit: $2,011 (reported on 19.4% of returns)
Here:
$2,011
State:
$2,570
(% of AGI for various income ranges: 7.1% for AGIs below $25k, 1.1% for AGIs $25k-50k)
Percentage of individuals using paid preparers for their 2012 taxes: 60.2%
Here:
60%
State:
51%
(% for various income ranges: 54.1% for AGIs below $25k, 55.0% for AGIs $25k-50k, 60.0% for AGIs $50k-75k, 66.7% for AGIs $75k-100k, 72.7% for AGIs $100k-200k, 83.3% for AGIs over 200k)
Averages for the 2004 tax year for zip code 76449, filed in 2005:
Average Adjusted Gross Income (AGI) in 2004: $44,363 (Individual Income Tax Returns)
Here:
$44,363
State:
$47,881
Salary/wage: $36,138 (reported on 74.0% of returns)
Here:
$36,138
State:
$41,947
(% of AGI for various income ranges: 181.8% for AGIs below $10k, 73.8% for AGIs $10k-25k, 73.7% for AGIs $25k-50k, 69.9% for AGIs $50k-75k, 60.5% for AGIs $75k-100k, 43.3% for AGIs over 100k)
Taxable interest for individuals: $2,631 (reported on 42.1% of returns)
This zip code:
$2,631
Texas:
$2,255
(% of AGI for various income ranges: 10.6% for AGIs below $10k, 1.7% for AGIs $10k-25k, 2.0% for AGIs $25k-50k, 0.6% for AGIs $50k-75k, 0.8% for AGIs $75k-100k, 4.0% for AGIs over 100k)
Taxable dividends: $3,490 (reported on 15.9% of returns)
Here:
$3,490
State:
$4,261
(% of AGI for various income ranges: 2.5% for AGIs below $10k, 0.6% for AGIs $10k-25k, 1.1% for AGIs $25k-50k, 1.1% for AGIs $50k-75k, 0.3% for AGIs $75k-100k, 1.8% for AGIs over 100k)
Net capital gain/loss: +$34,325 (reported on 16.8% of returns)
Here:
+$34,325
State:
+$16,110
(% of AGI for various income ranges: 3.9% for AGIs below $10k, 0.5% for AGIs $10k-25k, 1.2% for AGIs $25k-50k, 0.2% for AGIs $50k-75k, 6.8% for AGIs $75k-100k, 28.9% for AGIs over 100k)
Profit/loss from business: +$8,169 (reported on 25.7% of returns)
Here:
+$8,169
State:
+$11,013
(% of AGI for various income ranges: -0.5% for AGIs below $10k, 10.0% for AGIs $10k-25k, 2.5% for AGIs $25k-50k, 5.2% for AGIs $50k-75k, 9.0% for AGIs $75k-100k, 3.3% for AGIs over 100k)
IRA payment deduction: $3,667 (reported on 2.0% of returns)
76449:
$3,667
Texas:
$3,120
Total itemized deductions: $21,210 (18% of AGI, reported on 19.6% of returns)
Here:
$21,210
State:
$19,631
Here:
18.1% of AGI
State:
18.9% of AGI
(% of AGI for various income ranges: 8.8% for AGIs $10k-25k, 6.5% for AGIs $25k-50k, 10.7% for AGIs $50k-75k, 9.7% for AGIs $75k-100k, 10.4% for AGIs over 100k)
Charity contributions deductions: $5,973 (5% of AGI, reported on 16.6% of returns)
Here:
$5,973
State:
$4,753
Here:
4.6% of AGI
State:
4.2% of AGI
(% of AGI for various income ranges: 1.0% for AGIs $10k-25k, 1.1% for AGIs $25k-50k, 1.9% for AGIs $50k-75k, 2.3% for AGIs $75k-100k, 3.3% for AGIs over 100k)
Total tax: $7,928 (reported on 70.6% of returns)
76449:
$7,928
State:
$9,058
(% of AGI for various income ranges: 9.9% for AGIs below $10k, 4.1% for AGIs $10k-25k, 6.1% for AGIs $25k-50k, 8.9% for AGIs $50k-75k, 12.2% for AGIs $75k-100k, 19.5% for AGIs over 100k)
Earned income credit: $1,854 (reported on 21.3% of returns)
Here:
$1,854
State:
$2,024
Percentage of individuals using paid preparers for their 2004 taxes: 59.3%
Here:
59%
State:
57%
(% for various income ranges: 50.7% for AGIs below $10k, 58.1% for AGIs $10k-25k, 61.4% for AGIs $25k-50k, 66.7% for AGIs $50k-75k, 65.4% for AGIs $75k-100k, 68.9% for AGIs over 100k)
Household received Food Stamps/SNAP in the past 12 months: 91 Household did not receive Food Stamps/SNAP in the past 12 months: 1,079
Women who had a birth in the past 12 months: 26 (27 now married, 0 unmarried) Women who did not have a birth in the past 12 months: 381 (167 now married, 213 unmarried)
Housing units in zip code 76449 with a mortgage: 351 Median monthly owner costs for units with a mortgage: $1,835 Median monthly owner costs for units without a mortgage: $650
Residents with income below the poverty level in 2022:
This zip code:
13.2%
Whole state:
14.0%
Residents with income below 50% of the poverty level in 2022:
This zip code:
9.4%
Whole state:
7.4%
Median number of rooms in houses and condos:
Here:
5.8
State:
6.3
Median number of rooms in apartments:
Here:
4.9
State:
4.0
Notable locations in this zip code not listed on our city pages
Notable locations in zip code 76449: Belding Ranch (A), Camp Constantin (B), Graford Rural Volunteer Fire Department (C), Possum Kingdom Lake Volunteer Emergency Medical Services (D). Display/hide their locations on the map
Streams, rivers, and creeks: Vaughn Branch (A), Soda Springs Creek (B), Salt Branch (C), Pecan Branch (D), Loving Creek (E), Elm Creek (F), Flatrock Branch (G), Frog Branch (H), Grindstone Creek (I). Display/hide their locations on the map
Size of family households: 469 2-persons, 124 3-persons, 61 4-persons, 47 5-persons, 13 6-persons, 6 7-or-more-persons
Size of nonfamily households: 343 1-person, 119 2-persons
218 married couples with children.
83 single-parent households (25 men, 58 women).
95.7% of residents of 76449 zip code speak English at home.
4.8% of residents speak Spanish at home (62% very well, 14% well, 12% not well, 12% not at all).
Foreign born population: 78 (3.2%) (72.0% of them are naturalized citizens)
This zip code:
3.2%
Whole state:
17.2%
25%Honduras
23%Barbados
12%France
26%American
25%English
11%German
5%Irish
4%Norwegian
3%Italian
2%European
Year of entry for the foreign-born population
112010 or later
132000 to 2009
01990 to 1999
63Before 1990
Facilities with environmental interests located in this zip code:
AMERICAN TELEPHONE AND TELEGRAPH CORPORA (9 MI W NW L435160 RR in GRAFORD, TX)
(Resource Conservation and Recovery Act (tracking hazardous waste)) Alternative names: AMERICAN TEL & TEL CO LONG LINES
Housing units lacking complete plumbing facilities: 8.7% Housing units lacking complete kitchen facilities: 8.6%
69.5%Electricity
16.7%Utility gas
12.8%Bottled, tank, or LP gas
Population in 1990: 2,235.
Place of birth for U.S.-born residents:
This state: 1,681
Northeast: 37
Midwest: 214
South: 214
West: 207
55% of the 76449 zip code residents lived in the same house 5 years ago. Out of people who lived in different houses, 34% lived in this county. Out of people who lived in different counties, 50% lived in Texas.
91% of the 76449 zip code residents lived in the same house 1 year ago. Out of people who lived in different houses, 10% moved from this county. Out of people who lived in different houses, 86% moved from different county within same state. Out of people who lived in different houses, 5% moved from different state. Out of people who lived in different houses, 4% moved from abroad.
Private vs. public school enrollment:
Students in private schools in grades 1 to 8 (elementary and middle school):
Here:
0.0%
Texas:
8.8%
Students in private schools in grades 9 to 12 (high school): 11
Here:
12.6%
Texas:
8.0%
Students in private undergraduate colleges:
Here:
1.7%
Texas:
16.2%
Occupation by median earnings in the past 12 months ($)
248,974Transportation occupations
136,506Computer and mathematical occupations
90,401Business and financial operations occupations
74,612Life, physical, and social science occupations
69,120Management occupations
61,116Health diagnosing and treating practitioners and other technical occupations
Top industries in this zip code by the number of employees in 2005:
Other Services (except Public Administration): Civic and Social Organizations (50-99 employees: 1 establishment, 1-4 employees: 2 establishments)
Accommodation and Food Services: Hotels (except Casino Hotels) and Motels (50-99: 1)
Finance and Insurance: Commercial Banking (20-49: 1)
Arts, Entertainment, and Recreation: Marinas (10-19: 1, 5-9: 1)
Construction: Other Heavy and Civil Engineering Construction (10-19: 1, 1-4: 1)
Construction: Land Subdivision (10-19: 1)
Construction: Plumbing, Heating, and Air-Conditioning Contractors (10-19: 1)
Real Estate and Rental and Leasing: Offices of Real Estate Agents and Brokers (5-9: 1, 1-4: 2)
Fatal accident statistics in 2014:
Fatal accident count: 2
Vehicles involved in fatal accidents: 3
Fatal accidents caused by drunken drivers: 1
Fatalities: 2
Persons involved in fatal accidents: 3
Pedestrians involved in fatal accidents: 0
Fatal accident statistics in 2010:
Fatal accident count: 1
Vehicles involved in fatal accidents: 1
Fatal accidents caused by drunken drivers: 1
Fatalities: 1
Persons involved in fatal accidents: 1
Pedestrians involved in fatal accidents: 0
2003 - 2018 National Fire Incident Reporting System (NFIRS) incidents
Based on the data from the years 2003 - 2018 the average number of fire incidents per year is 10. The highest number of fires - 45 took place in 2018, and the least - 0 in 2005. The data has a rising trend.
When looking into fire subcategories, the most incidents belonged to: Outside Fires (70.5%), and Structure Fires (23.7%).
Fire incident types reported to NFIRS in Zip Code 76449


 Nearest zip codes: 76484, 76067, 76427, 76486, 76475, 76490.


 Based on the data from the years 2003 - 2018 the average number of fire incidents per year is 10. The highest number of fires - 45 took place in 2018, and the least - 0 in 2005. The data has a rising trend.
 When looking into fire subcategories, the most incidents belonged to: Outside Fires (70.5%), and Structure Fires (23.7%).