Estimated zip code population in 2022: 13,352 Zip code population in 2010: 13,258 Zip code population in 2000: 12,502
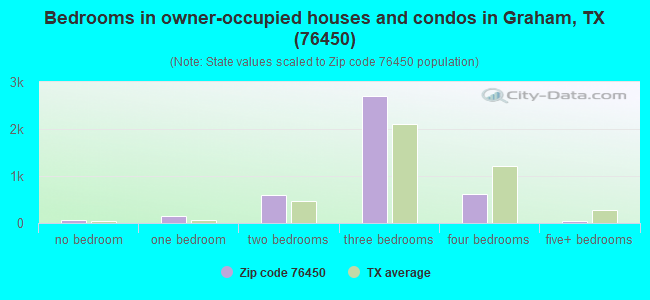
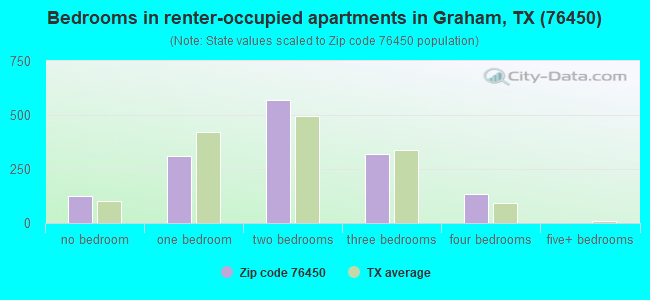
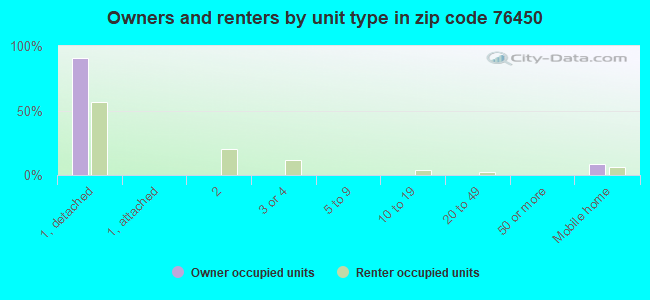
Houses and condos: 6,559 Renter-occupied apartments: 1,452
% of renters here:
26%
State:
38%
March 2022 cost of living index in zip code 76450: 78.1 (low, U.S. average is 100)
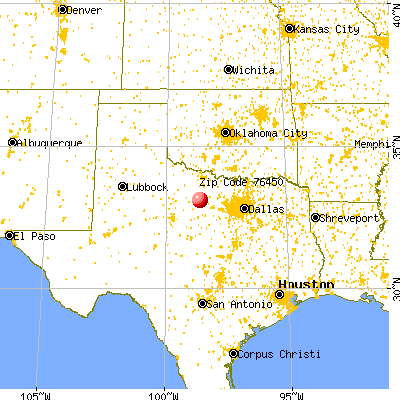
Land area: 461.1 sq. mi. Water area: 15.2 sq. mi.
Population density: 29 people per square mile
(very low).
OSM Map
General Map
Google Map
MSN Map
OSM Map
General Map
Google Map
MSN Map
OSM Map
General Map
Google Map
MSN Map
OSM Map
General Map
Google Map
MSN Map
Please wait while loading the map...
Real estate property taxes paid for housing units in 2022:
This zip code:
1.3% ($2,538)
Texas:
1.5% ($4,050)
Median real estate property taxes paid for housing units with mortgages in 2022: $2,961 (1.4%) Median real estate property taxes paid for housing units with no mortgage in 2022: $2,429 (1.3%)
Averages for the 2020 tax year for zip code 76450, filed in 2021:
Average Adjusted Gross Income (AGI) in 2020: $71,834 (Individual Income Tax Returns)
Here:
$71,834
State:
$77,054
Salary/wage: $50,259 (reported on 78.9% of returns)
Here:
$50,259
State:
$62,766
(% of AGI for various income ranges: 1272.3% for AGIs below $25k, 3538.4% for AGIs $25k-50k, 6543.3% for AGIs $50k-75k, 9677.4% for AGIs $75k-100k, 18612.7% for AGIs $100k-200k, 66178.3% for AGIs over 200k)
Taxable interest for individuals: $2,591 (reported on 29.6% of returns)
This zip code:
$2,591
Texas:
$2,665
(% of AGI for various income ranges: 18.1% for AGIs below $25k, 34.6% for AGIs $25k-50k, 77.5% for AGIs $50k-75k, 85.6% for AGIs $75k-100k, 176.1% for AGIs $100k-200k, 4115.0% for AGIs over 200k)
Ordinary dividends: $9,546 (reported on 17.0% of returns)
Here:
$9,546
State:
$10,044
(% of AGI for various income ranges: 27.5% for AGIs below $25k, 45.0% for AGIs $25k-50k, 124.9% for AGIs $50k-75k, 120.9% for AGIs $75k-100k, 426.4% for AGIs $100k-200k, 9875.0% for AGIs over 200k)
Net capital gain/loss in AGI: +$31,570 (reported on 16.6% of returns)
Here:
+$31,570
State:
+$39,590
(% of AGI for various income ranges: 26.8% for AGIs below $25k, 63.7% for AGIs $25k-50k, 269.3% for AGIs $50k-75k, 290.3% for AGIs $75k-100k, 1237.0% for AGIs $100k-200k, 37673.3% for AGIs over 200k)
Profit/loss from business: +$12,802 (reported on 24.6% of returns)
Here:
+$12,802
State:
+$10,888
(% of AGI for various income ranges: 214.8% for AGIs below $25k, 233.8% for AGIs $25k-50k, 433.0% for AGIs $50k-75k, 562.4% for AGIs $75k-100k, 1130.3% for AGIs $100k-200k, 7230.0% for AGIs over 200k)
Taxable individual retirement arrangement distribution: $21,376 (reported on 9.3% of returns)
76450:
$21,376
Texas:
$24,740
(% of AGI for various income ranges: 47.5% for AGIs below $25k, 119.2% for AGIs $25k-50k, 232.3% for AGIs $50k-75k, 402.6% for AGIs $75k-100k, 956.7% for AGIs $100k-200k, 6126.7% for AGIs over 200k)
Self-employed (Keogh) retirement plans: $16,467 (reported on 0.5% of returns)
76450:
$16,467
Texas:
$29,298
(% of AGI for various income ranges: 149.7% for AGIs $100k-200k)
Total itemized deductions: $51,528 (reported on 5.5% of returns)
Here:
$51,528
State:
$40,428
(% of AGI for various income ranges: 58.9% for AGIs below $25k, 86.2% for AGIs $25k-50k, 333.9% for AGIs $50k-75k, 316.5% for AGIs $75k-100k, 1228.5% for AGIs $100k-200k, 12731.7% for AGIs over 200k)
Charity contributions: $23,496 (reported on 4.3% of returns)
Here:
$23,496
State:
$18,201
(% of AGI for various income ranges: 23.6% for AGIs $25k-50k, 65.8% for AGIs $50k-75k, 58.2% for AGIs $75k-100k, 335.5% for AGIs $100k-200k, 6553.3% for AGIs over 200k)
Taxes paid: $6,519 (reported on 5.4% of returns)
76450:
$6,519
State:
$7,821
(% of AGI for various income ranges: 6.3% for AGIs below $25k, 11.2% for AGIs $25k-50k, 30.4% for AGIs $50k-75k, 52.9% for AGIs $75k-100k, 179.4% for AGIs $100k-200k, 1433.3% for AGIs over 200k)
Earned income credit: $2,465 (reported on 19.2% of returns)
Here:
$2,465
State:
$2,584
(% of AGI for various income ranges: 115.5% for AGIs below $25k, 92.9% for AGIs $25k-50k, 3.2% for AGIs $50k-75k)
Percentage of individuals using paid preparers for their 2020 taxes: 93.4%
Here:
93%
State:
92%
(% for various income ranges: 93.2% for AGIs below $25k, 92.4% for AGIs $25k-50k, 95.2% for AGIs $50k-75k, 94.3% for AGIs $75k-100k, 94.0% for AGIs $100k-200k, 91.3% for AGIs over 200k)
Averages for the 2012 tax year for zip code 76450, filed in 2013:
Average Adjusted Gross Income (AGI) in 2012: $64,188 (Individual Income Tax Returns)
Here:
$64,188
State:
$65,384
Salary/wage: $45,102 (reported on 80.6% of returns)
Here:
$45,102
State:
$52,524
(% of AGI for various income ranges: 73.0% for AGIs below $25k, 77.2% for AGIs $25k-50k, 74.9% for AGIs $50k-75k, 77.2% for AGIs $75k-100k, 64.7% for AGIs $100k-200k, 26.3% for AGIs over 200k)
Taxable interest for individuals: $2,273 (reported on 31.0% of returns)
This zip code:
$2,273
Texas:
$2,372
(% of AGI for various income ranges: 1.3% for AGIs below $25k, 0.7% for AGIs $25k-50k, 0.9% for AGIs $50k-75k, 0.7% for AGIs $75k-100k, 1.1% for AGIs $100k-200k, 1.5% for AGIs over 200k)
Ordinary dividends: $8,379 (reported on 16.1% of returns)
Here:
$8,379
State:
$9,721
(% of AGI for various income ranges: 1.4% for AGIs below $25k, 0.7% for AGIs $25k-50k, 0.7% for AGIs $50k-75k, 0.8% for AGIs $75k-100k, 1.3% for AGIs $100k-200k, 4.3% for AGIs over 200k)
Net capital gain/loss in AGI: +$24,740 (reported on 14.7% of returns)
Here:
+$24,740
State:
+$35,319
(% of AGI for various income ranges: 0.7% for AGIs below $25k, 0.2% for AGIs $25k-50k, 0.8% for AGIs $50k-75k, 0.9% for AGIs $75k-100k, 2.4% for AGIs $100k-200k, 14.2% for AGIs over 200k)
Profit/loss from business: +$24,367 (reported on 24.0% of returns)
Here:
+$24,367
State:
+$13,732
(% of AGI for various income ranges: 12.5% for AGIs below $25k, 5.9% for AGIs $25k-50k, 4.4% for AGIs $50k-75k, 4.4% for AGIs $75k-100k, 6.7% for AGIs $100k-200k, 14.4% for AGIs over 200k)
Taxable individual retirement arrangement distribution: $14,816 (reported on 9.8% of returns)
76450:
$14,816
Texas:
$19,511
(% of AGI for various income ranges: 2.4% for AGIs below $25k, 2.3% for AGIs $25k-50k, 2.5% for AGIs $50k-75k, 2.0% for AGIs $75k-100k, 3.0% for AGIs $100k-200k, 1.8% for AGIs over 200k)
Self-employment retirement plans: $25,975 (reported on 0.7% of returns)
76450:
$25,975
Texas:
$23,938
Total itemized deductions: $28,346 (17% of AGI, reported on 19.1% of returns)
Here:
$28,346
State:
$24,724
Here:
17.3% of AGI
State:
15.9% of AGI
(% of AGI for various income ranges: 6.6% for AGIs below $25k, 5.7% for AGIs $25k-50k, 7.0% for AGIs $50k-75k, 8.6% for AGIs $75k-100k, 11.0% for AGIs $100k-200k, 8.9% for AGIs over 200k)
Charity contributions: $9,987 (reported on 14.7% of returns)
Here:
$9,987
State:
$6,808
(% of AGI for various income ranges: 0.5% for AGIs below $25k, 1.0% for AGIs $25k-50k, 1.3% for AGIs $50k-75k, 1.7% for AGIs $75k-100k, 2.6% for AGIs $100k-200k, 3.6% for AGIs over 200k)
Taxes paid: $5,084 (reported on 18.7% of returns)
76450:
$5,084
State:
$6,921
(% of AGI for various income ranges: 0.7% for AGIs below $25k, 0.8% for AGIs $25k-50k, 1.2% for AGIs $50k-75k, 1.5% for AGIs $75k-100k, 2.1% for AGIs $100k-200k, 1.6% for AGIs over 200k)
Earned income credit: $2,230 (reported on 20.0% of returns)
Here:
$2,230
State:
$2,570
(% of AGI for various income ranges: 6.8% for AGIs below $25k, 1.4% for AGIs $25k-50k)
Percentage of individuals using paid preparers for their 2012 taxes: 67.3%
Here:
67%
State:
51%
(% for various income ranges: 63.4% for AGIs below $25k, 63.9% for AGIs $25k-50k, 69.1% for AGIs $50k-75k, 72.0% for AGIs $75k-100k, 74.1% for AGIs $100k-200k, 88.5% for AGIs over 200k)
Averages for the 2004 tax year for zip code 76450, filed in 2005:
Average Adjusted Gross Income (AGI) in 2004: $41,438 (Individual Income Tax Returns)
Here:
$41,438
State:
$47,881
Salary/wage: $31,036 (reported on 79.3% of returns)
Here:
$31,036
State:
$41,947
(% of AGI for various income ranges: 98.2% for AGIs below $10k, 73.6% for AGIs $10k-25k, 80.7% for AGIs $25k-50k, 74.2% for AGIs $50k-75k, 65.8% for AGIs $75k-100k, 31.6% for AGIs over 100k)
Taxable interest for individuals: $2,757 (reported on 36.1% of returns)
This zip code:
$2,757
Texas:
$2,255
(% of AGI for various income ranges: 6.1% for AGIs below $10k, 3.2% for AGIs $10k-25k, 1.3% for AGIs $25k-50k, 1.8% for AGIs $50k-75k, 3.5% for AGIs $75k-100k, 2.6% for AGIs over 100k)
Taxable dividends: $5,188 (reported on 18.7% of returns)
Here:
$5,188
State:
$4,261
(% of AGI for various income ranges: 3.4% for AGIs below $10k, 1.0% for AGIs $10k-25k, 0.5% for AGIs $25k-50k, 0.7% for AGIs $50k-75k, 1.3% for AGIs $75k-100k, 4.8% for AGIs over 100k)
Net capital gain/loss: +$18,617 (reported on 18.6% of returns)
Here:
+$18,617
State:
+$16,110
(% of AGI for various income ranges: -2.1% for AGIs below $10k, 0.7% for AGIs $10k-25k, 0.6% for AGIs $25k-50k, 1.3% for AGIs $50k-75k, 4.0% for AGIs $75k-100k, 20.3% for AGIs over 100k)
Profit/loss from business: +$14,541 (reported on 25.8% of returns)
Here:
+$14,541
State:
+$11,013
(% of AGI for various income ranges: 4.9% for AGIs below $10k, 9.4% for AGIs $10k-25k, 5.4% for AGIs $25k-50k, 4.0% for AGIs $50k-75k, 9.5% for AGIs $75k-100k, 13.5% for AGIs over 100k)
IRA payment deduction: $3,462 (reported on 2.9% of returns)
76450:
$3,462
Texas:
$3,120
(% of AGI for various income ranges: 0.4% for AGIs $10k-25k, 0.3% for AGIs $25k-50k, 0.2% for AGIs $50k-75k, 0.3% for AGIs $75k-100k, 0.2% for AGIs over 100k)
Self-employed pension: $19,773 (reported on 0.8% of returns)
Here:
$19,773
Texas:
$16,401
Total itemized deductions: $22,028 (21% of AGI, reported on 15.6% of returns)
Here:
$22,028
State:
$19,631
Here:
21.2% of AGI
State:
18.9% of AGI
(% of AGI for various income ranges: 10.6% for AGIs below $10k, 5.1% for AGIs $10k-25k, 7.0% for AGIs $25k-50k, 7.4% for AGIs $50k-75k, 9.0% for AGIs $75k-100k, 10.1% for AGIs over 100k)
Charity contributions deductions: $7,127 (7% of AGI, reported on 12.8% of returns)
Here:
$7,127
State:
$4,753
Here:
6.6% of AGI
State:
4.2% of AGI
(% of AGI for various income ranges: 0.5% for AGIs below $10k, 0.8% for AGIs $10k-25k, 1.4% for AGIs $25k-50k, 1.9% for AGIs $50k-75k, 2.7% for AGIs $75k-100k, 3.2% for AGIs over 100k)
Total tax: $7,155 (reported on 69.7% of returns)
76450:
$7,155
State:
$9,058
(% of AGI for various income ranges: 3.3% for AGIs below $10k, 4.3% for AGIs $10k-25k, 6.3% for AGIs $25k-50k, 8.6% for AGIs $50k-75k, 12.1% for AGIs $75k-100k, 19.9% for AGIs over 100k)
Earned income credit: $1,856 (reported on 20.5% of returns)
Here:
$1,856
State:
$2,024
Percentage of individuals using paid preparers for their 2004 taxes: 67.0%
Here:
67%
State:
57%
(% for various income ranges: 59.5% for AGIs below $10k, 68.6% for AGIs $10k-25k, 68.6% for AGIs $25k-50k, 67.0% for AGIs $50k-75k, 74.0% for AGIs $75k-100k, 78.1% for AGIs over 100k)
Household received Food Stamps/SNAP in the past 12 months: 623 Household did not receive Food Stamps/SNAP in the past 12 months: 5,005
Women who had a birth in the past 12 months: 109 (69 now married, 39 unmarried) Women who did not have a birth in the past 12 months: 2,691 (1,327 now married, 1,359 unmarried)
Housing units in zip code 76450 with a mortgage: 1,737 (8 second mortgage, 8 home equity loan) Median monthly owner costs for units with a mortgage: $1,338 Median monthly owner costs for units without a mortgage: $608
Residents with income below the poverty level in 2022:
This zip code:
14.9%
Whole state:
14.0%
Residents with income below 50% of the poverty level in 2022:
This zip code:
11.1%
Whole state:
7.4%
Median number of rooms in houses and condos:
Here:
6.0
State:
6.3
Median number of rooms in apartments:
Here:
4.3
State:
4.0
Notable locations in this zip code not listed on our city pages
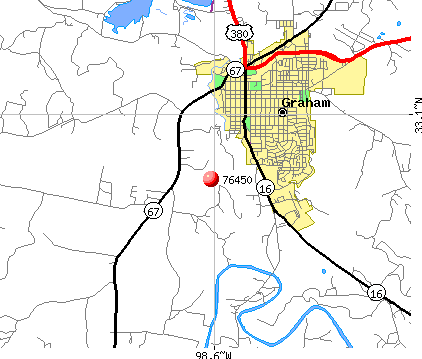
Notable locations in zip code 76450: Drummond (A), Flatrock Community Center (B), Graham Power Plant (C), Young County Rural Volunteer Fire Department Station 5 (D), Young County Rural Volunteer Fire Department Station 3 (E), Possum Kingdom West Side Volunteer Fire Department (F), Graham Fire and Rescue Department (G), Possum Kingdom West Lake Volunteer Emergency Medical Service (H), National Theater (I), Spencer Boyd Street Houses (J). Display/hide their locations on the map
Churches in zip code 76450 include: Tonk Valley Church (A), Church of God (B), Loving Highway Church of Christ (C), Church of Christ (D), Saint Marys Catholic Church (E), Morningside Baptist Church (F), Faith Baptist Church (G), Bethel Baptist Church (H), Grace Chapel Church (I). Display/hide their locations on the map
Cemeteries: Ming Bend Cemetery (1), Veale Creek Cemetery (2), Mountain Home Cemetery (3), Murray Cemetery (4), Tonk Valley Cemetery (5), Brooks Cemetery (6), Center Ridge Cemetery (7). Display/hide their locations on the map
Reservoirs: Union Lake (A), Tub Tank (B), Lake Graham (C), Lake Eddleman (D), Bait Tank (E), Manning Vick Lake 1 (F), Johnston Lake (G), Stephens Company Water Company Reservoir (H). Display/hide their locations on the map
Streams, rivers, and creeks: Brier Branch (A), Briar Creek (B), Willow Branch (C), Veale Creek (D), Turtle Hole Creek (E), Tonk Branch (F), Sandy Creek (G), Ratliff Branch (H), Pickard Creek (I). Display/hide their locations on the map
In group quarters: 203 (-1 institutionalized population)
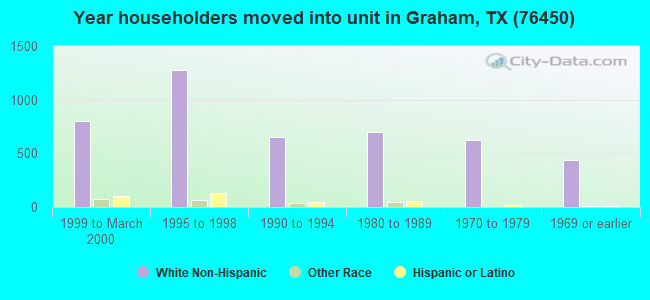
Size of family households: 1,980 2-persons, 614 3-persons, 863 4-persons, 242 5-persons, 57 6-persons, 18 7-or-more-persons
Size of nonfamily households: 1,523 1-person, 250 2-persons, 86 3-persons
2,189 married couples with children.
859 single-parent households (361 men, 498 women).
84.0% of residents of 76450 zip code speak English at home.
15.6% of residents speak Spanish at home (46% very well, 28% well, 19% not well, 6% not at all).
0.1% of residents speak other Indo-European language at home (100% very well).
0.2% of residents speak other language at home (100% very well).
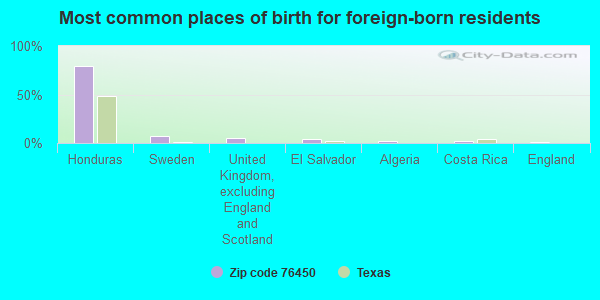
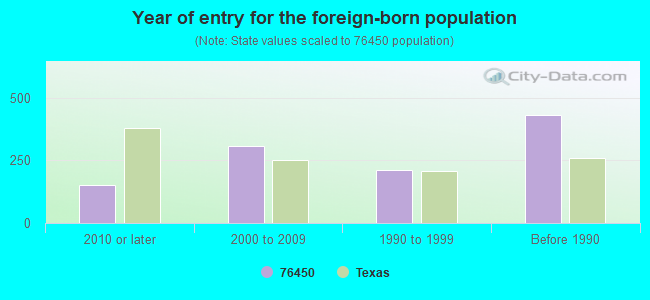
Foreign born population: 1,106 (8.3%) (39.0% of them are naturalized citizens)
This zip code:
8.3%
Whole state:
17.2%
79%Honduras
7%Sweden
6%United Kingdom, excluding England and Scotland
4%El Salvador
2%Algeria
2%Costa Rica
1%England
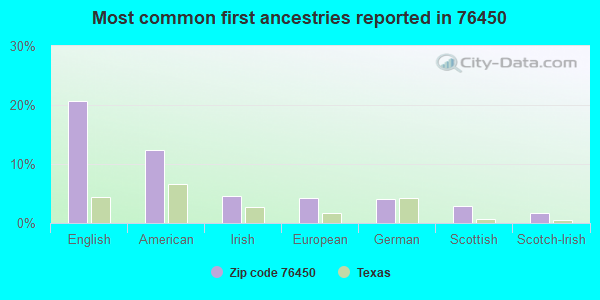
21%English
12%American
5%Irish
4%European
4%German
3%Scottish
2%Scotch-Irish
Year of entry for the foreign-born population
1502010 or later
3072000 to 2009
2111990 to 1999
431Before 1990
Facilities with environmental interests located in this zip code:
AMF TUBOSCOPE (700 LOVING RD in GRAHAM, TX)
(Resource Conservation and Recovery Act (tracking hazardous waste))
ARCO PIPE LINE CO (US HIGHWAY 1 MI S OF in GRAHAM, TX)
(Resource Conservation and Recovery Act (tracking hazardous waste)) Alternative names: ARCO PIPELINE CO MOSE STATION
AFCO NO 10116 (1234 BUNGER RD in GRAHAM, TX)
Conditionally Exempt Small Quantity Generators, less than 100 kg/month of hazardous waste (Resource Conservation and Recovery Act (tracking hazardous waste)) - notification Organizations: MICOR ENERGY LLC DBA AFCO (CONTACT/OWNER)
Housing units lacking complete plumbing facilities: 7.2% Housing units lacking complete kitchen facilities: 4.1%
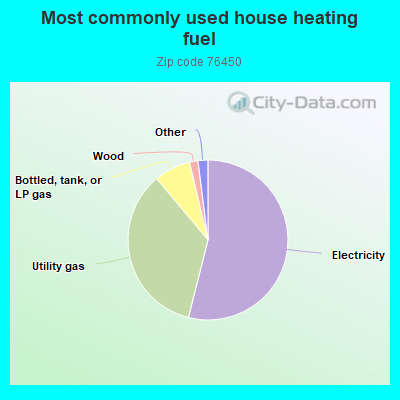
54.0%Electricity
35.0%Utility gas
7.4%Bottled, tank, or LP gas
1.7%Wood
0.8%No fuel used
0.7%Coal or coke
Population in 1990: 12,511.
Place of birth for U.S.-born residents:
This state: 9,733
Northeast: 96
Midwest: 487
South: 834
West: 995
57% of the 76450 zip code residents lived in the same house 5 years ago. Out of people who lived in different houses, 51% lived in this county. Out of people who lived in different counties, 50% lived in Texas.
86% of the 76450 zip code residents lived in the same house 1 year ago. Out of people who lived in different houses, 41% moved from this county. Out of people who lived in different houses, 36% moved from different county within same state. Out of people who lived in different houses, 14% moved from different state. Out of people who lived in different houses, 9% moved from abroad.
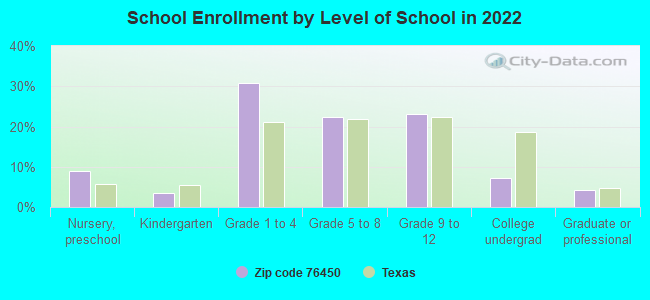
Private vs. public school enrollment:
Students in private schools in grades 1 to 8 (elementary and middle school): 110
Here:
7.0%
Texas:
8.8%
Students in private schools in grades 9 to 12 (high school): 35
Here:
5.2%
Texas:
8.0%
Students in private undergraduate colleges:
Here:
0.0%
Texas:
16.2%
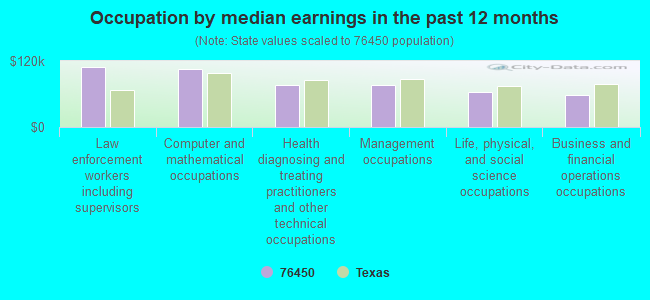
Occupation by median earnings in the past 12 months ($)
109,198Law enforcement workers including supervisors
105,853Computer and mathematical occupations
76,859Health diagnosing and treating practitioners and other technical occupations
76,000Management occupations
64,296Life, physical, and social science occupations
58,246Business and financial operations occupations
Companies with federal contracts located in this zip code (GRAHAM, TX):
MEDIA RECOVERY OF DELAWARE, IN (623 ELM SUITE 407; small business) : $489,693 in 18 contractsfrom 2000 to 2006
Contracts for Office Information System Equipment, ADP Supplies, ADP Central Processing Unit (CPU, Computer), Digital, Transformers: Distribution and Power Station, and moreby Navy, Farm Service Agency, Internal Revenue Service, National Oceanic and Atmospheric Administration/Under Secretary for Oceans and Atmosphere, and others Signed by year:2000: $39,900; 2001: $72,000; 2002: $0; 2003: $56,387; 2004: $189,187; 2005: $128,201; 2006: $4,018.
Biggest contracts:
$87,822 with Navy for Office Information System Equipment. Signed on 2005-07-08. Completion date: 2005-08-31.
$81,250 with Farm Service Agency for ADP Supplies. Taking place in MO. Signed on 2004-07-26. Completion date: 2004-08-26.
$72,000 with Internal Revenue Service for ADP Central Processing Unit (CPU, Computer), Digital. Taking place in OH. Signed on 2001-06-15. Completion date: 2001-09-15.
$41,026 with National Oceanic and Atmospheric Administration/Under Secretary for Oceans and Atmosphere for Transformers: Distribution and Power Station. Signed on 2004-01-27. Completion date: 2004-02-13.
GUARANTY ABSTRACT CO (421 4TH ST; small business) : $75,000 in 3 contractsfrom 2005 to 2006
$25,000 with Army for Real Estate Brokerage Services. Signed on 2006-01-27. Completion date: 2006-08-03.
$25,000, same as above.Signed on 2005-08-03. Completion date: 2006-08-03.
$25,000 with U.S. Army Corps of Engineers - civil program financing only for Real Estate Brokerage Services. Signed on 2005-08-03. Completion date: 2006-08-03.
MARSHALL, KING, & HINSON, INC (500 OAK ST; small business) : $50,000 in 2 contractsin 2005
$25,000 with Army for Real Estate Brokerage Services. Signed on 2005-08-03. Completion date: 2006-08-03.
$25,000 with U.S. Army Corps of Engineers - civil program financing only for Real Estate Brokerage Services. Signed on 2005-08-03. Completion date: 2006-08-03.
SOUTHERN BLEACHER CO INC (801 FIFTH ST; small business)
$26,275 with Army for Installation of Equipment -- Furniture. Taking place in NY. Signed on 2005-06-30. Completion date: 2005-09-09.
Top industries in this zip code by the number of employees in 2005:
Other Services (except Public Administration): Religious Organizations (20-49: 2, 10-19: 2, 5-9: 2, 1-4: 9)
Health Care and Social Assistance: Offices of Physicians (except Mental Health Specialists) (20-49: 1, 10-19: 3, 5-9: 6)
People in group quarters in 2010:
132 people in nursing facilities/skilled-nursing facilities
85 people in local jails and other municipal confinement facilities
People in group quarters in 2000:
159 people in nursing homes
89 people in other noninstitutional group quarters
32 people in local jails and other confinement facilities (including police lockups)
10 people in homes for the mentally retarded
Fatal accident statistics in 2014:
Fatal accident count: 2
Vehicles involved in fatal accidents: 3
Fatal accidents caused by drunken drivers: 1
Fatalities: 2
Persons involved in fatal accidents: 3
Pedestrians involved in fatal accidents: 0
Fatal accident statistics in 2013:
Fatal accident count: 1
Vehicles involved in fatal accidents: 1
Fatal accidents caused by drunken drivers: 0
Fatalities: 1
Persons involved in fatal accidents: 1
Pedestrians involved in fatal accidents: 0
2002 - 2018 National Fire Incident Reporting System (NFIRS) incidents
Based on the data from the years 2002 - 2018 the average number of fire incidents per year is 55. The highest number of fires - 136 took place in 2011, and the least - 11 in 2007. The data has a rising trend.
When looking into fire subcategories, the most incidents belonged to: Outside Fires (57.1%), and Structure Fires (28.5%).
Fire incident types reported to NFIRS in Zip Code 76450


 Nearest zip codes: 76481, 76427, 76460, 76429, 76374, 76459.


 Based on the data from the years 2002 - 2018 the average number of fire incidents per year is 55. The highest number of fires - 136 took place in 2011, and the least - 11 in 2007. The data has a rising trend.
 When looking into fire subcategories, the most incidents belonged to: Outside Fires (57.1%), and Structure Fires (28.5%).