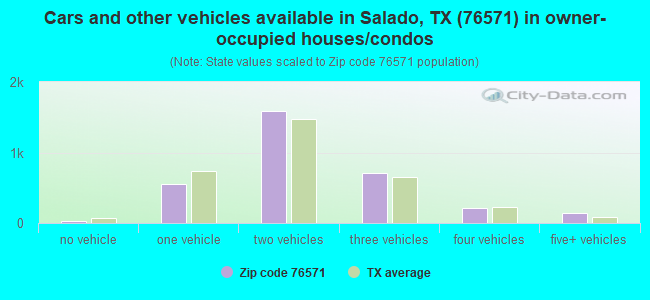
Estimated zip code population in 2022: 9,907 Zip code population in 2010: 6,790 Zip code population in 2000: 5,051
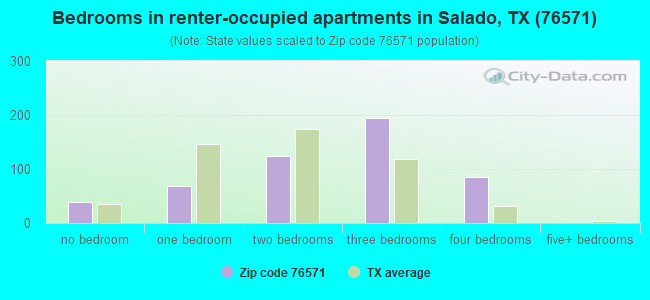
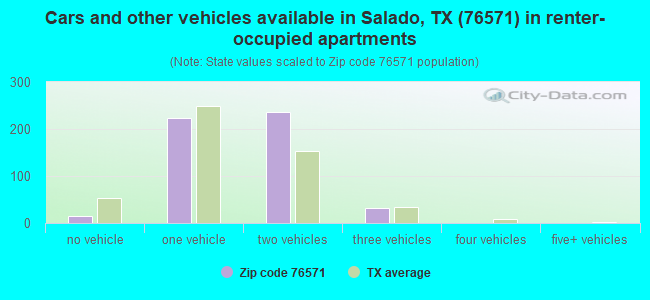
Houses and condos: 4,024 Renter-occupied apartments: 508
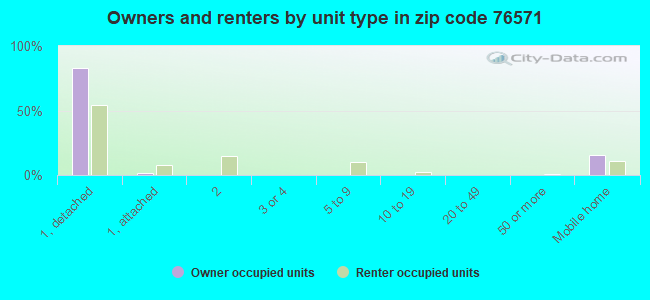
% of renters here:
14%
State:
38%
March 2022 cost of living index in zip code 76571: 81.5 (low, U.S. average is 100)
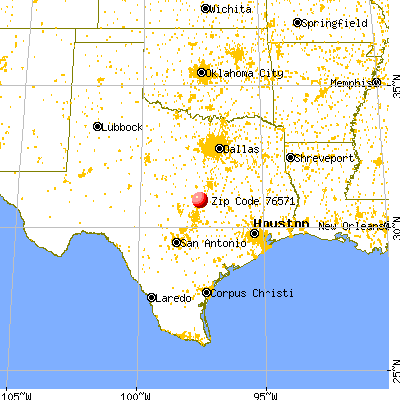
Land area: 118.2 sq. mi. Water area: 4.6 sq. mi.
Population density: 84 people per square mile
(very low).
OSM Map
General Map
Google Map
MSN Map
OSM Map
General Map
Google Map
MSN Map
OSM Map
General Map
Google Map
MSN Map
OSM Map
General Map
Google Map
MSN Map
Please wait while loading the map...
Real estate property taxes paid for housing units in 2022:
This zip code:
1.2% ($4,756)
Texas:
1.5% ($4,050)
Median real estate property taxes paid for housing units with mortgages in 2022: $5,778 (1.2%) Median real estate property taxes paid for housing units with no mortgage in 2022: $3,459 (1.1%)
Estimated median house/condo value in 2022: $406,504
76571:
$406,504
Texas:
$275,400
According to our research of Texas and other state lists, there were 11 registered sex offenders living in 76571 zip code as of May 28, 2024. The ratio of all residents to sex offenders in zip code 76571 is 593 to 1. The ratio of registered sex offenders to all residents in this zip code is lower than the state average.
Median resident age:
This zip code:
46.4 years
Texas median age:
35.6 years
Average household size:
This zip code:
2.6 people
Texas:
2.6 people
Averages for the 2020 tax year for zip code 76571, filed in 2021:
Average Adjusted Gross Income (AGI) in 2020: $117,191 (Individual Income Tax Returns)
Here:
$117,191
State:
$77,054
Salary/wage: $86,815 (reported on 76.4% of returns)
Here:
$86,815
State:
$62,766
(% of AGI for various income ranges: 1194.4% for AGIs below $25k, 3388.9% for AGIs $25k-50k, 5829.0% for AGIs $50k-75k, 8390.7% for AGIs $75k-100k, 17598.3% for AGIs $100k-200k, 66320.0% for AGIs over 200k)
Taxable interest for individuals: $2,381 (reported on 40.3% of returns)
This zip code:
$2,381
Texas:
$2,665
(% of AGI for various income ranges: 28.1% for AGIs below $25k, 34.0% for AGIs $25k-50k, 72.6% for AGIs $50k-75k, 77.7% for AGIs $75k-100k, 186.3% for AGIs $100k-200k, 1307.2% for AGIs over 200k)
Ordinary dividends: $7,798 (reported on 26.0% of returns)
Here:
$7,798
State:
$10,044
(% of AGI for various income ranges: 26.8% for AGIs below $25k, 64.4% for AGIs $25k-50k, 87.2% for AGIs $50k-75k, 130.7% for AGIs $75k-100k, 304.8% for AGIs $100k-200k, 3420.0% for AGIs over 200k)
Net capital gain/loss in AGI: +$38,988 (reported on 26.0% of returns)
Here:
+$38,988
State:
+$39,590
(% of AGI for various income ranges: 13.1% for AGIs below $25k, 64.4% for AGIs $25k-50k, 147.7% for AGIs $50k-75k, 258.0% for AGIs $75k-100k, 749.7% for AGIs $100k-200k, 22365.0% for AGIs over 200k)
Profit/loss from business: +$17,840 (reported on 22.8% of returns)
Here:
+$17,840
State:
+$10,888
(% of AGI for various income ranges: 175.4% for AGIs below $25k, 362.1% for AGIs $25k-50k, 497.7% for AGIs $50k-75k, 401.7% for AGIs $75k-100k, 769.8% for AGIs $100k-200k, 4155.0% for AGIs over 200k)
Taxable individual retirement arrangement distribution: $27,453 (reported on 12.4% of returns)
76571:
$27,453
Texas:
$24,740
(% of AGI for various income ranges: 69.0% for AGIs below $25k, 149.5% for AGIs $25k-50k, 338.7% for AGIs $50k-75k, 478.0% for AGIs $75k-100k, 975.2% for AGIs $100k-200k, 3015.6% for AGIs over 200k)
Self-employed (Keogh) retirement plans: $15,880 (reported on 1.1% of returns)
76571:
$15,880
Texas:
$29,298
(% of AGI for various income ranges: 441.1% for AGIs over 200k)
Total itemized deductions: $37,044 (reported on 13.2% of returns)
Here:
$37,044
State:
$40,428
(% of AGI for various income ranges: 227.0% for AGIs $25k-50k, 421.0% for AGIs $50k-75k, 508.3% for AGIs $75k-100k, 1117.6% for AGIs $100k-200k, 6163.9% for AGIs over 200k)
Charity contributions: $16,084 (reported on 11.1% of returns)
Here:
$16,084
State:
$18,201
(% of AGI for various income ranges: 25.6% for AGIs $25k-50k, 65.4% for AGIs $50k-75k, 116.0% for AGIs $75k-100k, 286.2% for AGIs $100k-200k, 3139.4% for AGIs over 200k)
Taxes paid: $7,823 (reported on 13.4% of returns)
76571:
$7,823
State:
$7,821
(% of AGI for various income ranges: 41.8% for AGIs $25k-50k, 100.5% for AGIs $50k-75k, 143.3% for AGIs $75k-100k, 271.1% for AGIs $100k-200k, 1156.7% for AGIs over 200k)
Earned income credit: $2,179 (reported on 9.1% of returns)
Here:
$2,179
State:
$2,584
(% of AGI for various income ranges: 79.0% for AGIs below $25k, 66.3% for AGIs $25k-50k)
Percentage of individuals using paid preparers for their 2020 taxes: 92.4%
Here:
92%
State:
92%
(% for various income ranges: 89.6% for AGIs below $25k, 92.3% for AGIs $25k-50k, 91.5% for AGIs $50k-75k, 91.5% for AGIs $75k-100k, 94.8% for AGIs $100k-200k, 94.5% for AGIs over 200k)
Averages for the 2012 tax year for zip code 76571, filed in 2013:
Average Adjusted Gross Income (AGI) in 2012: $82,330 (Individual Income Tax Returns)
Here:
$82,330
State:
$65,384
Salary/wage: $65,691 (reported on 79.0% of returns)
Here:
$65,691
State:
$52,524
(% of AGI for various income ranges: 69.7% for AGIs below $25k, 70.9% for AGIs $25k-50k, 66.2% for AGIs $50k-75k, 68.9% for AGIs $75k-100k, 63.2% for AGIs $100k-200k, 56.7% for AGIs over 200k)
Taxable interest for individuals: $1,854 (reported on 43.3% of returns)
This zip code:
$1,854
Texas:
$2,372
(% of AGI for various income ranges: 2.4% for AGIs below $25k, 1.1% for AGIs $25k-50k, 0.8% for AGIs $50k-75k, 0.8% for AGIs $75k-100k, 1.0% for AGIs $100k-200k, 0.8% for AGIs over 200k)
Ordinary dividends: $5,102 (reported on 25.6% of returns)
Here:
$5,102
State:
$9,721
(% of AGI for various income ranges: 2.7% for AGIs below $25k, 1.3% for AGIs $25k-50k, 1.4% for AGIs $50k-75k, 1.2% for AGIs $75k-100k, 1.4% for AGIs $100k-200k, 1.9% for AGIs over 200k)
Net capital gain/loss in AGI: +$10,783 (reported on 23.5% of returns)
Here:
+$10,783
State:
+$35,319
(% of AGI for various income ranges: 0.2% for AGIs $25k-50k, 0.5% for AGIs $50k-75k, 0.8% for AGIs $75k-100k, 2.0% for AGIs $100k-200k, 7.0% for AGIs over 200k)
Profit/loss from business: +$18,970 (reported on 22.3% of returns)
Here:
+$18,970
State:
+$13,732
(% of AGI for various income ranges: 10.4% for AGIs below $25k, 5.5% for AGIs $25k-50k, 4.2% for AGIs $50k-75k, 3.3% for AGIs $75k-100k, 5.7% for AGIs $100k-200k, 4.8% for AGIs over 200k)
Taxable individual retirement arrangement distribution: $21,538 (reported on 13.7% of returns)
76571:
$21,538
Texas:
$19,511
(% of AGI for various income ranges: 3.3% for AGIs below $25k, 3.6% for AGIs $25k-50k, 3.9% for AGIs $50k-75k, 4.2% for AGIs $75k-100k, 4.8% for AGIs $100k-200k, 2.1% for AGIs over 200k)
Self-employment retirement plans: $18,233 (reported on 0.9% of returns)
76571:
$18,233
Texas:
$23,938
Total itemized deductions: $25,322 (18% of AGI, reported on 38.1% of returns)
Here:
$25,322
State:
$24,724
Here:
18.1% of AGI
State:
15.9% of AGI
(% of AGI for various income ranges: 14.7% for AGIs below $25k, 12.2% for AGIs $25k-50k, 13.2% for AGIs $50k-75k, 12.3% for AGIs $75k-100k, 12.5% for AGIs $100k-200k, 9.8% for AGIs over 200k)
Charity contributions: $6,145 (reported on 31.4% of returns)
Here:
$6,145
State:
$6,808
(% of AGI for various income ranges: 1.3% for AGIs below $25k, 1.9% for AGIs $25k-50k, 2.2% for AGIs $50k-75k, 1.9% for AGIs $75k-100k, 2.6% for AGIs $100k-200k, 2.6% for AGIs over 200k)
Taxes paid: $6,585 (reported on 37.8% of returns)
76571:
$6,585
State:
$6,921
(% of AGI for various income ranges: 2.4% for AGIs below $25k, 2.8% for AGIs $25k-50k, 3.2% for AGIs $50k-75k, 3.4% for AGIs $75k-100k, 3.8% for AGIs $100k-200k, 2.2% for AGIs over 200k)
Earned income credit: $2,144 (reported on 11.0% of returns)
Here:
$2,144
State:
$2,570
(% of AGI for various income ranges: 4.8% for AGIs below $25k, 1.0% for AGIs $25k-50k)
Percentage of individuals using paid preparers for their 2012 taxes: 54.3%
Here:
54%
State:
51%
(% for various income ranges: 46.5% for AGIs below $25k, 52.5% for AGIs $25k-50k, 55.6% for AGIs $50k-75k, 55.3% for AGIs $75k-100k, 59.1% for AGIs $100k-200k, 76.2% for AGIs over 200k)
Averages for the 2004 tax year for zip code 76571, filed in 2005:
Average Adjusted Gross Income (AGI) in 2004: $62,836 (Individual Income Tax Returns)
Here:
$62,836
State:
$47,881
Salary/wage: $51,754 (reported on 76.8% of returns)
Here:
$51,754
State:
$41,947
(% of AGI for various income ranges: 134.4% for AGIs below $10k, 65.8% for AGIs $10k-25k, 67.9% for AGIs $25k-50k, 69.1% for AGIs $50k-75k, 67.3% for AGIs $75k-100k, 57.8% for AGIs over 100k)
Taxable interest for individuals: $2,541 (reported on 53.9% of returns)
This zip code:
$2,541
Texas:
$2,255
(% of AGI for various income ranges: 12.2% for AGIs below $10k, 4.1% for AGIs $10k-25k, 2.4% for AGIs $25k-50k, 1.8% for AGIs $50k-75k, 1.8% for AGIs $75k-100k, 2.0% for AGIs over 100k)
Taxable dividends: $3,018 (reported on 31.5% of returns)
Here:
$3,018
State:
$4,261
(% of AGI for various income ranges: 8.6% for AGIs below $10k, 3.2% for AGIs $10k-25k, 1.5% for AGIs $25k-50k, 1.4% for AGIs $50k-75k, 1.0% for AGIs $75k-100k, 1.4% for AGIs over 100k)
Net capital gain/loss: +$17,310 (reported on 30.0% of returns)
Here:
+$17,310
State:
+$16,110
(% of AGI for various income ranges: -3.0% for AGIs below $10k, 0.9% for AGIs $10k-25k, 1.0% for AGIs $25k-50k, 1.5% for AGIs $50k-75k, 2.9% for AGIs $75k-100k, 14.5% for AGIs over 100k)
Profit/loss from business: +$14,657 (reported on 24.4% of returns)
Here:
+$14,657
State:
+$11,013
(% of AGI for various income ranges: 10.4% for AGIs below $10k, 11.5% for AGIs $10k-25k, 7.1% for AGIs $25k-50k, 3.0% for AGIs $50k-75k, 5.0% for AGIs $75k-100k, 5.8% for AGIs over 100k)
IRA payment deduction: $3,722 (reported on 3.3% of returns)
76571:
$3,722
Texas:
$3,120
(% of AGI for various income ranges: 2.9% for AGIs below $10k, 0.3% for AGIs $25k-50k, 0.3% for AGIs $50k-75k, 0.2% for AGIs $75k-100k, 0.1% for AGIs over 100k)
Self-employed pension: $13,923 (reported on 1.4% of returns)
Here:
$13,923
Texas:
$16,401
Total itemized deductions: $20,167 (20% of AGI, reported on 40.3% of returns)
Here:
$20,167
State:
$19,631
Here:
19.5% of AGI
State:
18.9% of AGI
(% of AGI for various income ranges: 23.2% for AGIs below $10k, 13.2% for AGIs $10k-25k, 14.6% for AGIs $25k-50k, 13.0% for AGIs $50k-75k, 13.9% for AGIs $75k-100k, 12.0% for AGIs over 100k)
Charity contributions deductions: $5,087 (5% of AGI, reported on 34.8% of returns)
Here:
$5,087
State:
$4,753
Here:
4.7% of AGI
State:
4.2% of AGI
(% of AGI for various income ranges: 2.7% for AGIs below $10k, 1.8% for AGIs $10k-25k, 2.3% for AGIs $25k-50k, 2.3% for AGIs $50k-75k, 2.2% for AGIs $75k-100k, 3.4% for AGIs over 100k)
Total tax: $10,671 (reported on 78.9% of returns)
76571:
$10,671
State:
$9,058
(% of AGI for various income ranges: 4.6% for AGIs below $10k, 4.6% for AGIs $10k-25k, 6.5% for AGIs $25k-50k, 8.7% for AGIs $50k-75k, 11.2% for AGIs $75k-100k, 18.0% for AGIs over 100k)
Earned income credit: $1,717 (reported on 10.3% of returns)
Here:
$1,717
State:
$2,024
Percentage of individuals using paid preparers for their 2004 taxes: 60.9%
Here:
61%
State:
57%
(% for various income ranges: 54.3% for AGIs below $10k, 62.1% for AGIs $10k-25k, 62.8% for AGIs $25k-50k, 59.7% for AGIs $50k-75k, 59.2% for AGIs $75k-100k, 67.0% for AGIs over 100k)
Likely homosexual households (counted as self-reported same-sex unmarried-partner households)
Lesbian couples: 0.0% of all households
Gay men: 1.1% of all households
Household received Food Stamps/SNAP in the past 12 months: 176 Household did not receive Food Stamps/SNAP in the past 12 months: 3,567
Women who had a birth in the past 12 months: 28 (16 now married, 11 unmarried) Women who did not have a birth in the past 12 months: 1,733 (1,127 now married, 595 unmarried)
Housing units in zip code 76571 with a mortgage: 1,776 (86 second mortgage, 55 both second mortgage and home equity loan) Houses without a mortgage: 34
Median monthly owner costs for units with a mortgage: $2,143 Median monthly owner costs for units without a mortgage: $787
Residents with income below the poverty level in 2022:
This zip code:
7.8%
Whole state:
14.0%
Residents with income below 50% of the poverty level in 2022:
This zip code:
2.4%
Whole state:
7.4%
Median number of rooms in houses and condos:
Here:
6.3
State:
6.3
Median number of rooms in apartments:
Here:
4.6
State:
4.0
Notable locations in this zip code not listed on our city pages
Notable locations in zip code 76571: Solana Ranch (A), Colonel Elijah Sterling Clack Robertson Plantation (B), Fowler House (C), George Washington Baines House (D), Hendrickson-Caskey House (E), Levi Tenney House (F), Major A J Rose House (G), Central Texas Area Museum (H), Davis House (I), Captain Robert Halley House (J), Barbee-Berry Mercantile Building (K), Barton House (L), Anderson House and Store (M), Armstrong-Adams House (N), Norton-Orgain House (O), White-Aiken House (P), Vickrey House (Q), Twelve Oaks House (R), Tyler House (S), Stagecoach Inn (T). Display/hide their locations on the map
Churches in zip code 76571 include: Cedar Knob Church (A), Cedar Valley Church (B), Salado United Methodist Church (C), Grace Baptist Church (D), Saint Josephs Episcopal Church (E), Presbyterian Church of Salado (F), Church of Christ (G), United Methodist Church of Salado (H), First Baptist Church (I). Display/hide their locations on the map
Streams, rivers, and creeks: Watkins Branch (A), Smith Branch (B), Willingham Branch (C), Rumsey Creek (D), Mustang Creek (E), Buttermilk Creek (F). Display/hide their locations on the map
Size of family households: 1,639 2-persons, 361 3-persons, 675 4-persons, 196 5-persons, 46 6-persons, 40 7-or-more-persons
Size of nonfamily households: 610 1-person, 167 2-persons, 13 4-persons
2,093 married couples with children.
152 single-parent households (79 men, 73 women).
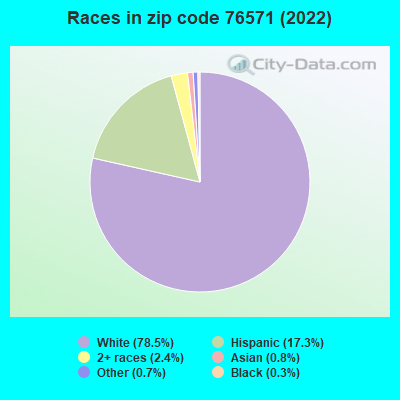
89.9% of residents of 76571 zip code speak English at home.
8.8% of residents speak Spanish at home (63% very well, 29% well, 3% not well, 5% not at all).
1.4% of residents speak other Indo-European language at home (95% very well, 5% well).
0.2% of residents speak Asian or Pacific Island language at home (100% very well).
0.1% of residents speak other language at home (100% very well).
Foreign born population: 602 (6.1%) (51.4% of them are naturalized citizens)
This zip code:
6.1%
Whole state:
17.2%
66%Honduras
16%North Macedonia (Macedonia)
2%Sweden
2%France
2%Uganda
1%Singapore
1%Bhutan
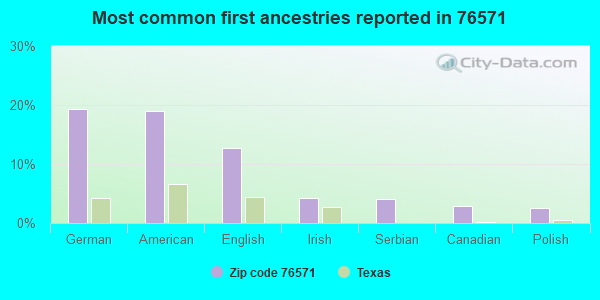
19%German
19%American
13%English
4%Irish
4%Serbian
3%Canadian
3%Polish
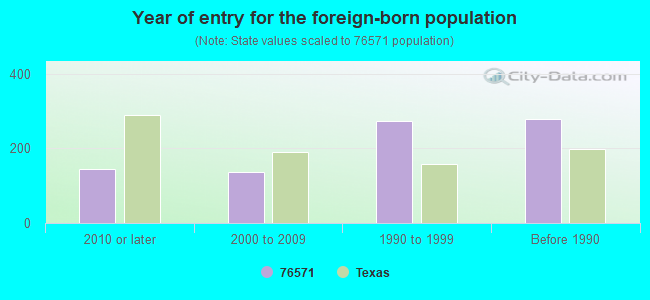
Year of entry for the foreign-born population
1452010 or later
1372000 to 2009
2731990 to 1999
279Before 1990
Housing units lacking complete kitchen facilities: 1.5%
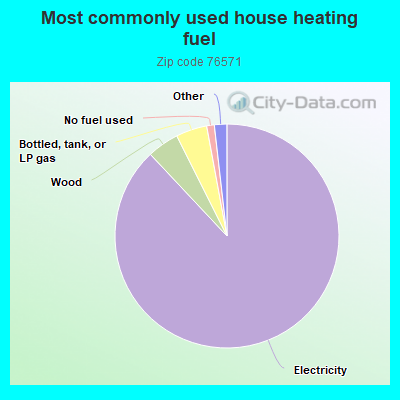
88.1%Electricity
4.6%Wood
4.5%Bottled, tank, or LP gas
1.1%No fuel used
0.9%Fuel oil, kerosene, etc.
0.9%Utility gas
Population in 1990: 3,454. Population change in the 1990s: +1,597 (+46.2%).
Place of birth for U.S.-born residents:
This state: 5,990
Northeast: 372
Midwest: 847
South: 910
West: 925
46% of the 76571 zip code residents lived in the same house 5 years ago. Out of people who lived in different houses, 46% lived in this county. Out of people who lived in different counties, 50% lived in Texas.
88% of the 76571 zip code residents lived in the same house 1 year ago. Out of people who lived in different houses, 42% moved from this county. Out of people who lived in different houses, 14% moved from different county within same state. Out of people who lived in different houses, 45% moved from different state. Out of people who lived in different houses, 3% moved from abroad.
Private vs. public school enrollment:
Students in private schools in grades 1 to 8 (elementary and middle school): 169
Here:
15.9%
Texas:
8.8%
Students in private schools in grades 9 to 12 (high school): 44
Here:
7.1%
Texas:
8.0%
Students in private undergraduate colleges: 17
Here:
7.6%
Texas:
16.2%
Occupation by median earnings in the past 12 months ($)
118,928Life, physical, and social science occupations
117,442Business and financial operations occupations
93,064Architecture and engineering occupations
88,347Computer and mathematical occupations
87,156Construction and extraction occupations
84,176Health diagnosing and treating practitioners and other technical occupations
Companies with federal contracts located in this zip code:
DOUGLASS ANESTHESIA SERVICE (317 SALADO CREEK PL in SALADO, TX; small business) : $783,562 in 8 contractsfrom 2000 to 2005
Contracts for Anesthesiology Services, Pharmacology Services by Army Signed by year:2000: $199,760; 2001: $199,760; 2002: $199,760; 2003: $199,760; 2004: -$6,952; 2005: -$8,526; 2006: $0.
Biggest contracts:
$199,760 with Army for Anesthesiology Services. Signed on 2003-10-20. Completion date: 2002-09-30.
$199,760, same as above.Signed on 2002-10-23. Completion date: 2002-09-30.
$199,760, same as above.Signed on 2001-11-02. Completion date: 2002-09-30.
$199,760 with Army for Pharmacology Services. Signed on 2000-10-27. Completion date: 2004-09-30.
Top industries in this zip code by the number of employees in 2005:
Accommodation and Food Services: Hotels (except Casino Hotels) and Motels (100-249 employees: 1 establishment, 1-4 employees: 1 establishment)
Accommodation and Food Services: Full-Service Restaurants (20-49: 2, 5-9: 4)
Administrative and Support and Waste Management and Remediation Services: Document Preparation Services (50-99: 1)
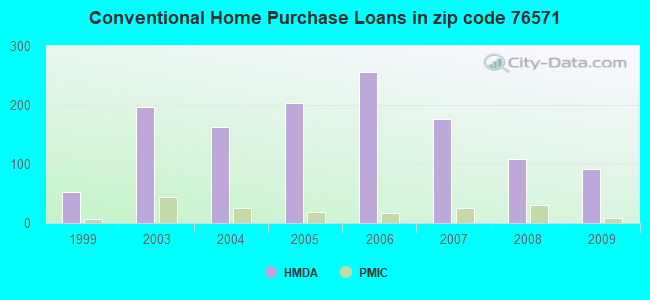
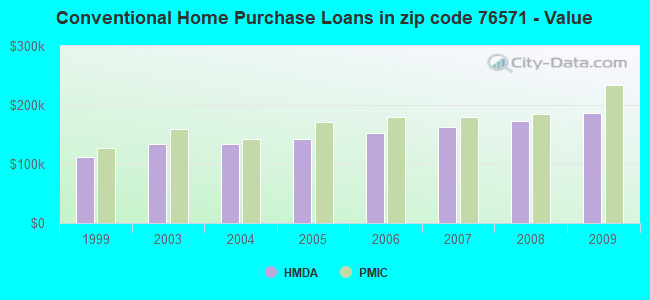
Detailed PMIC statistics for the following Tracts:0234.01
2002 - 2018 National Fire Incident Reporting System (NFIRS) incidents
According to the data from the years 2002 - 2018 the average number of fires per year is 52. The highest number of fires - 91 took place in 2011, and the least - 28 in 2015. The data has a growing trend.
When looking into fire subcategories, the most incidents belonged to: Outside Fires (64.3%), and Mobile Property/Vehicle Fires (18.9%).
Fire incident types reported to NFIRS in Zip Code 76571


 Nearest zip codes: 76537, 76548, 76573, 76559, 76513, 76542.
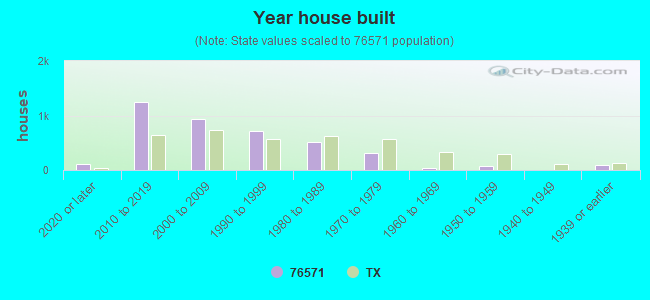


 : $783,562 in 8 contracts from 2000 to 2005

 According to the data from the years 2002 - 2018 the average number of fires per year is 52. The highest number of fires - 91 took place in 2011, and the least - 28 in 2015. The data has a growing trend.
 When looking into fire subcategories, the most incidents belonged to: Outside Fires (64.3%), and Mobile Property/Vehicle Fires (18.9%).