Estimated zip code population in 2022: 1,399 Zip code population in 2010: 1,563 Zip code population in 2000: 1,447
Houses and condos: 719 Renter-occupied apartments: 114
% of renters here:
20%
State:
38%
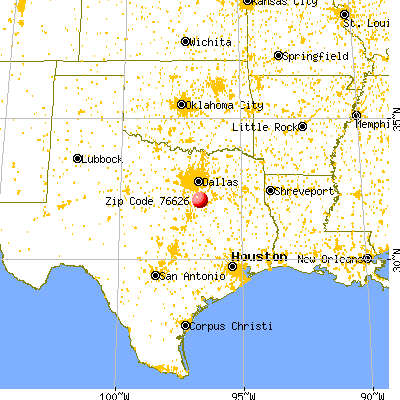
March 2022 cost of living index in zip code 76626: 79.0 (low, U.S. average is 100)
Land area: 40.9 sq. mi. Water area: 0.4 sq. mi.
Population density: 34 people per square mile
(very low).
OSM Map
General Map
Google Map
MSN Map
OSM Map
General Map
Google Map
MSN Map
OSM Map
General Map
Google Map
MSN Map
OSM Map
General Map
Google Map
MSN Map
Please wait while loading the map...
Real estate property taxes paid for housing units in 2022:
This zip code:
1.4% ($2,398)
Texas:
1.5% ($4,050)
Median real estate property taxes paid for housing units with mortgages in 2022: $2,836 (1.4%) Median real estate property taxes paid for housing units with no mortgage in 2022: $1,125 (1.0%)
Business Search- 14 Million verified businesses
Males: 604
(43.2%)
Females: 794
(56.8%)
For population 25 years and over in 76626:
High school or higher: 91.9%
Bachelor's degree or higher: 15.0%
Graduate or professional degree: 2.7%
Unemployed: 5.1%
Mean travel time to work (commute): 41.0 minutes
For population 15 years and over in 76626:
Never married: 20.5%
Now married: 65.4%
Separated: 2.5%
Widowed: 6.0%
Divorced: 5.6%
Zip code 76626 compared to state average:
Median house value below state average.
Black race population percentage significantly below state average.
Hispanic race population percentage significantly below state average.
Foreign-born population percentage significantly below state average.
Renting percentage below state average.
Length of stay since moving in significantly above state average.
Number of college students significantly below state average.
Percentage of population with a bachelor's degree or higher below state average.
Averages for the 2020 tax year for zip code 76626, filed in 2021:
Average Adjusted Gross Income (AGI) in 2020: $59,262 (Individual Income Tax Returns)
Here:
$59,262
State:
$77,054
Salary/wage: $53,986 (reported on 83.1% of returns)
Here:
$53,986
State:
$62,766
(% of AGI for various income ranges: 1122.4% for AGIs below $25k, 3376.9% for AGIs $25k-50k, 6691.2% for AGIs $50k-75k, 8210.0% for AGIs $75k-100k, 18845.6% for AGIs $100k-200k)
Taxable interest for individuals: $622 (reported on 23.4% of returns)
This zip code:
$622
Texas:
$2,665
(% of AGI for various income ranges: 8.2% for AGIs below $25k, 8.1% for AGIs $25k-50k, 13.8% for AGIs $50k-75k, 15.0% for AGIs $75k-100k, 72.2% for AGIs $100k-200k)
Ordinary dividends: $1,825 (reported on 10.4% of returns)
Here:
$1,825
State:
$10,044
(% of AGI for various income ranges: 15.9% for AGIs below $25k, 42.5% for AGIs $50k-75k, 94.4% for AGIs $100k-200k)
Net capital gain/loss in AGI: +$1,967 (reported on 11.7% of returns)
Here:
+$1,967
State:
+$39,590
(% of AGI for various income ranges: 28.7% for AGIs $50k-75k, 181.1% for AGIs $100k-200k)
Profit/loss from business: +$8,007 (reported on 18.2% of returns)
Here:
+$8,007
State:
+$10,888
(% of AGI for various income ranges: 155.9% for AGIs below $25k, 122.5% for AGIs $25k-50k, 521.2% for AGIs $50k-75k, 270.0% for AGIs $100k-200k)
Taxable individual retirement arrangement distribution: $22,600 (reported on 5.2% of returns)
76626:
$22,600
Texas:
$24,740
(% of AGI for various income ranges: 158.2% for AGIs below $25k, 1058.3% for AGIs $75k-100k)
Earned income credit: $2,721 (reported on 18.2% of returns)
Here:
$2,721
State:
$2,584
(% of AGI for various income ranges: 144.7% for AGIs below $25k, 84.4% for AGIs $25k-50k)
Percentage of individuals using paid preparers for their 2020 taxes: 92.2%
Here:
92%
State:
92%
(% for various income ranges: 92.0% for AGIs below $25k, 94.7% for AGIs $25k-50k, 90.9% for AGIs $50k-75k, 87.5% for AGIs $75k-100k, 91.7% for AGIs $100k-200k, 100.0% for AGIs over 200k)
Averages for the 2012 tax year for zip code 76626, filed in 2013:
Average Adjusted Gross Income (AGI) in 2012: $49,154 (Individual Income Tax Returns)
Here:
$49,154
State:
$65,384
Salary/wage: $45,109 (reported on 80.9% of returns)
Here:
$45,109
State:
$52,524
(% of AGI for various income ranges: 69.2% for AGIs below $25k, 76.7% for AGIs $25k-50k, 81.0% for AGIs $50k-75k, 81.8% for AGIs $75k-100k, 66.9% for AGIs $100k-200k)
Taxable interest for individuals: $520 (reported on 29.4% of returns)
This zip code:
$520
Texas:
$2,372
(% of AGI for various income ranges: 0.9% for AGIs below $25k, 0.5% for AGIs $25k-50k, 0.2% for AGIs $50k-75k, 0.2% for AGIs $75k-100k, 0.2% for AGIs $100k-200k)
Ordinary dividends: $600 (reported on 7.4% of returns)
Here:
$600
State:
$9,721
Net capital gain/loss in AGI: +$9,967 (reported on 8.8% of returns)
Here:
+$9,967
State:
+$35,319
Profit/loss from business: +$9,375 (reported on 23.5% of returns)
Here:
+$9,375
State:
+$13,732
(% of AGI for various income ranges: 16.7% for AGIs below $25k, 6.7% for AGIs $25k-50k, 2.6% for AGIs $50k-75k, 6.9% for AGIs $75k-100k)
Taxable individual retirement arrangement distribution: $11,260 (reported on 7.4% of returns)
76626:
$11,260
Texas:
$19,511
Total itemized deductions: $19,243 (22% of AGI, reported on 20.6% of returns)
Here:
$19,243
State:
$24,724
Here:
22.2% of AGI
State:
15.9% of AGI
(% of AGI for various income ranges: 9.1% for AGIs $25k-50k, 7.8% for AGIs $50k-75k, 9.4% for AGIs $75k-100k, 9.1% for AGIs $100k-200k)
Charity contributions: $5,480 (reported on 14.7% of returns)
Here:
$5,480
State:
$6,808
(% of AGI for various income ranges: 2.5% for AGIs below $25k, 3.2% for AGIs $50k-75k, 2.2% for AGIs $100k-200k)
Taxes paid: $3,579 (reported on 20.6% of returns)
76626:
$3,579
State:
$6,921
(% of AGI for various income ranges: 1.1% for AGIs $25k-50k, 1.2% for AGIs $50k-75k, 1.8% for AGIs $75k-100k, 2.1% for AGIs $100k-200k)
Earned income credit: $2,400 (reported on 20.6% of returns)
Here:
$2,400
State:
$2,570
(% of AGI for various income ranges: 7.6% for AGIs below $25k, 1.6% for AGIs $25k-50k)
Percentage of individuals using paid preparers for their 2012 taxes: 55.9%
Here:
56%
State:
51%
(% for various income ranges: 52.0% for AGIs below $25k, 50.0% for AGIs $25k-50k, 60.0% for AGIs $50k-75k, 57.1% for AGIs $75k-100k, 75.0% for AGIs $100k-200k)
Averages for the 2004 tax year for zip code 76626, filed in 2005:
Average Adjusted Gross Income (AGI) in 2004: $36,917 (Individual Income Tax Returns)
Here:
$36,917
State:
$47,881
Salary/wage: $35,781 (reported on 81.0% of returns)
Here:
$35,781
State:
$41,947
(% of AGI for various income ranges: 108.9% for AGIs below $10k, 76.0% for AGIs $10k-25k, 83.5% for AGIs $25k-50k, 84.4% for AGIs $50k-75k, 75.3% for AGIs $75k-100k, 61.8% for AGIs over 100k)
Taxable interest for individuals: $1,259 (reported on 31.6% of returns)
This zip code:
$1,259
Texas:
$2,255
(% of AGI for various income ranges: 8.7% for AGIs below $10k, 0.8% for AGIs $10k-25k, 0.4% for AGIs $25k-50k, 1.0% for AGIs $50k-75k, 1.6% for AGIs $75k-100k, 0.8% for AGIs over 100k)
Taxable dividends: $316 (reported on 8.8% of returns)
Here:
$316
State:
$4,261
(% of AGI for various income ranges: 0.4% for AGIs below $10k, 0.2% for AGIs $10k-25k, 0.1% for AGIs $50k-75k, 0.1% for AGIs over 100k)
Net capital gain/loss: +$2,718 (reported on 10.9% of returns)
Here:
+$2,718
State:
+$16,110
(% of AGI for various income ranges: -0.6% for AGIs below $10k, -0.1% for AGIs $25k-50k, 1.4% for AGIs $50k-75k, 0.7% for AGIs $75k-100k, 1.6% for AGIs over 100k)
Profit/loss from business: +$7,128 (reported on 22.8% of returns)
Here:
+$7,128
State:
+$11,013
(% of AGI for various income ranges: 15.7% for AGIs below $10k, 9.7% for AGIs $10k-25k, 6.8% for AGIs $25k-50k, 4.1% for AGIs $50k-75k, 1.5% for AGIs $75k-100k)
Total itemized deductions: $15,181 (22% of AGI, reported on 17.9% of returns)
Here:
$15,181
State:
$19,631
Here:
21.7% of AGI
State:
18.9% of AGI
(% of AGI for various income ranges: 29.8% for AGIs below $10k, 5.2% for AGIs $25k-50k, 6.8% for AGIs $50k-75k, 9.1% for AGIs $75k-100k, 11.1% for AGIs over 100k)
Charity contributions deductions: $4,306 (6% of AGI, reported on 15.1% of returns)
Here:
$4,306
State:
$4,753
Here:
6.0% of AGI
State:
4.2% of AGI
(% of AGI for various income ranges: 6.0% for AGIs below $10k, 0.7% for AGIs $25k-50k, 1.8% for AGIs $50k-75k, 2.4% for AGIs $75k-100k, 3.0% for AGIs over 100k)
Total tax: $4,686 (reported on 72.6% of returns)
76626:
$4,686
State:
$9,058
(% of AGI for various income ranges: 4.8% for AGIs below $10k, 3.9% for AGIs $10k-25k, 7.5% for AGIs $25k-50k, 8.3% for AGIs $50k-75k, 11.0% for AGIs $75k-100k, 15.2% for AGIs over 100k)
Earned income credit: $1,819 (reported on 22.2% of returns)
Here:
$1,819
State:
$2,024
Percentage of individuals using paid preparers for their 2004 taxes: 62.2%
Here:
62%
State:
57%
(% for various income ranges: 59.7% for AGIs below $10k, 63.3% for AGIs $10k-25k, 61.9% for AGIs $25k-50k, 64.0% for AGIs $50k-75k, 55.6% for AGIs $75k-100k, 74.2% for AGIs over 100k)
Household received Food Stamps/SNAP in the past 12 months: 64 Household did not receive Food Stamps/SNAP in the past 12 months: 507
Women who had a birth in the past 12 months: 25 (26 now married, 0 unmarried) Women who did not have a birth in the past 12 months: 307 (191 now married, 113 unmarried)
Housing units in zip code 76626 with a mortgage: 275 (1 second mortgage) Median monthly owner costs for units with a mortgage: $1,561 Median monthly owner costs for units without a mortgage: $397
Residents with income below the poverty level in 2022:
This zip code:
6.3%
Whole state:
14.0%
Residents with income below 50% of the poverty level in 2022:
This zip code:
2.1%
Whole state:
7.4%
Median number of rooms in houses and condos:
Here:
6.2
State:
6.3
Median number of rooms in apartments:
Here:
5.2
State:
4.0
Notable locations in this zip code not listed on our city pages
Reservoirs: Soil Conservation Service Site 105b Reservoir (A), Soil Conservation Service Site 121 Reservoir (B), Soil Conservation Service Site 123 Reservoir (C), Soil Conservation Service Site 134 Reservoir (D), Soil Conservation Service Site 119b Reservoir (E), Soil Conservation Service Site 119a Reservoir (F), Soil Conservation Service Site 104a Reservoir (G), Soil Conservation Service Site 104b Reservoir (H). Display/hide their locations on the map
Size of family households: 199 2-persons, 182 3-persons, 37 4-persons, 19 5-persons, 14 6-persons, 7 7-or-more-persons
Size of nonfamily households: 106 1-person, 6 2-persons
215 married couples with children.
90 single-parent households (19 men, 71 women).
95.7% of residents of 76626 zip code speak English at home.
3.7% of residents speak Spanish at home (85% very well, 15% well).
0.4% of residents speak other Indo-European language at home (100% very well).
Foreign born population: 11 (0.8%) (29.4% of them are naturalized citizens)
This zip code:
0.8%
Whole state:
17.2%
55%France
18%Honduras
24%American
11%German
10%Scottish
9%Irish
7%French
3%European
3%Scotch-Irish
Year of entry for the foreign-born population
02010 or later
42000 to 2009
21990 to 1999
5Before 1990
Housing units lacking complete plumbing facilities: 5.4% Housing units lacking complete kitchen facilities: 7.5%
68.5%Electricity
27.2%Utility gas
4.1%Bottled, tank, or LP gas
Population in 1990: 1,594.
Place of birth for U.S.-born residents:
This state: 1,194
Northeast: 3
Midwest: 31
South: 108
West: 35
63% of the 76626 zip code residents lived in the same house 5 years ago. Out of people who lived in different houses, 42% lived in this county. Out of people who lived in different counties, 50% lived in Texas.
93% of the 76626 zip code residents lived in the same house 1 year ago. Out of people who lived in different houses, 41% moved from this county. Out of people who lived in different houses, 50% moved from different county within same state. Out of people who lived in different houses, 7% moved from different state.
Private vs. public school enrollment:
Students in private schools in grades 1 to 8 (elementary and middle school): 2
Here:
1.8%
Texas:
8.8%
Students in private schools in grades 9 to 12 (high school): 11
Here:
13.3%
Texas:
8.0%
Students in private undergraduate colleges:
Here:
0.0%
Texas:
16.2%
Occupation by median earnings in the past 12 months ($)
88,222Management occupations
87,715Production occupations
54,826Sales and related occupations
52,567Education, training, and library occupations
46,114Construction and extraction occupations
44,281Installation, maintenance, and repair occupations
Top industries in this zip code by the number of employees in 2005:
Other Services (except Public Administration): Other Personal Care Services (5-9 employees: 1 establishment)
Professional, Scientific, and Technical Services: Commercial Photography (1-4: 1)
Finance and Insurance: Commercial Banking (1-4: 1)
Other Services (except Public Administration): Religious Organizations (1-4: 1)
Construction: Plumbing, Heating, and Air-Conditioning Contractors (1-4: 1)
Administrative and Support and Waste Management and Remediation Services: Security Systems Services (except Locksmiths) (1-4: 1)
People in group quarters in 2000:
11 people in other noninstitutional group quarters
Fatal accident statistics in 2010:
Fatal accident count: 1
Vehicles involved in fatal accidents: 3
Fatal accidents caused by drunken drivers: 0
Fatalities: 1
Persons involved in fatal accidents: 6
Pedestrians involved in fatal accidents: 0
2002 - 2018 National Fire Incident Reporting System (NFIRS) incidents
According to the data from the years 2002 - 2018 the average number of fires per year is 15. The highest number of reported fire incidents - 37 took place in 2015, and the least - 0 in 2013. The data has an increasing trend.
When looking into fire subcategories, the most incidents belonged to: Outside Fires (60.3%), and Structure Fires (31.3%).
Fire incident types reported to NFIRS in Zip Code 76626


 Nearest zip codes: 76623, 75102, 76641, 76651, 75101, 76041.


 According to the data from the years 2002 - 2018 the average number of fires per year is 15. The highest number of reported fire incidents - 37 took place in 2015, and the least - 0 in 2013. The data has an increasing trend.
 When looking into fire subcategories, the most incidents belonged to: Outside Fires (60.3%), and Structure Fires (31.3%).